(USTs are MIXED on ~90% avg volumes)while WE slept; China CUTS (mortgage rates); default rates ticking higher; and important 'forecast update' (bullish goal posts moved ...)
thebondbeat.substack.com
(USTs are MIXED on ~90% avg volumes)while WE slept; China CUTS (mortgage rates); default rates ticking higher; and important 'forecast update' (bullish goal posts moved ...)
(USTs are MIXED on ~90% avg volumes)while WE slept; China CUTS (mortgage rates); default rates ticking higher; and important 'forecast update' (bullish goal posts moved ...)
Good morning … Some news crossing wire about 555a,
Things so bad (over there) they are gonna be good (over here)? Next question then, #GotBONDS?
ZH: 2Y Auction Stops Through, Prices Above 5% For The First Time In 17 Years ZH: Solid 5Y Auction Sees Strong Demand Despite Tiny Tail
While I may have neglected to mention yesterday’s double-header, this afternoons 7yr bit MORE intriguing as it offers bit MORE duration and often times, elicits more interest from overseas participants …
I’d mention momentum seems oversold and we’re at / near top end of range (approx 4.44%), the chart is not compelling, at least not to ME … perhaps a good auction, a bid following and some pain (missing an opportunity to be more boldly bullish here / now) ahead of NFP Friday is in order but for now, well … here is a snapshot OF USTs as of 705a:
… HEREis what this shop says be behind the price action overnight…
… WHILE YOU SLEPT Treasuries are mixed with the curve pivoting steeper around a little-changed 7y point thanks to the 2y and 5y rolls. DXY is UNCHD while front WTI futures are higher (+0.8%). Asian stocks were all in the green (SHCOMP +1.2% on pledges for more stimulus in China), EU and UK share markets are all higher (FTSE 100 +1.6%, SX5E +0.45%) while ES futures are little-changed here at 6:45am. Our overnight US rates flows saw a quiet Asian session (60% of ave volume) but activity picked-up markedly in London's AM hours with brisk activity seen in the 2y and 5y rolls alongside good demand for 30yrs (typically against 5's and 10's). We also saw selling in the front-end (2's-3's) from fast$. Overnight Treasury volume here just before 7am was ~90% of average despite the weak activity during the Asian session.
… Our last attachment may be worth considering as we get the latest JOLTS print(s) at 10am. The BLS response rate for JOLTS is now roughly 1/2 what it was back in 2018. We have no clue why this is but thought it interesting anyway...
Kinda makes the data point many are buzzin’ about today, well, seem to pack much less of a punch? Dunno BUT … for some MORE of the news you can use » The Morning Hark - 29 Aug 2023 and IGMs Press Picks in effort to to help weed thru the noise (some of which can be found over here at Finviz).
Before I continue with SOME of what Global Wall Street is saying / sellin’, I have to pause and ask …
ZH: 5 Months After SVB's Collapse, SF Fed's Bank Supervisor 'Retires'
… Any way we think he wasn’t FORCED to fall on his sword so that someone else at FRBSF (the boss) didn’t have to? Askin’ for a friend …
From some of the news to some of THE VIEWS you might be able to use… here’s SOME of what Global Wall St is sayin’ …
AAM VIEWPOINTS — DEFAULT RISK: IS THE WORST BEHIND US? (an interesting run through CONSUMER DEFAULT RISKS, visuals included…jumping to AAMs conclusion…)
… Also noted, household savings supplemented by pandemic-era government payments seem to be dwindling and inflation is eroding wage gains (with real wages being negative). As backlogs of pent-up demand shrink and the labor market weakens, it seems even more likely that top lines (corporate sales) will remain under stress with a growing number of retailers relying on price increases to offset volume declines.
…Conclusion: Given the increasing fragility of the consumer as credit card debt grows on top of higher interest rates, and corporate credit strength already weakening as interest rates rise and cash flows weaken, there appears to be accelerating pressures for a worsening default rate that could very well be higher than that of consensus.
BMO - Forecast Update: Gonna win state... (when these guys speak folks should ought to lean in and listen … just like THIS … reads somewhat less bullish given pushing OUT timeline of WHEN they suggest rates to be lower)
Taking inspiration from Don Billingsley's famous quote in Friday Night Lights "we're gonna win state, but not tonight", we're extending the timeframe for our forecasts for the return of 3-handles across the US rates curve. Attached are the specifics. The most relevant shift is in 10-year yields, which we now see ending 2023 at 3.75% and remaining in a 3.25%-3.75% zone throughout much of next year. Eventually, the Fed will be able to declare victory in its battle with inflation and 10-year breakevens will shift back closer toward the pre-pandemic norms (vs. 231 bp this morning); thereby carrying nominal rates lower along for the ride. Similarly, the lagged impact of monetary policy will catch up with the labor market and when the unemployment rate begins marching higher, it will be difficult for the Fed to control through rhetoric alone -- ultimately requiring a policy response. Moreover, we see the 2s/10s curve remaining stubbornly inverted throughout the balance of 2023 and not able to sustainably shift into positive territory until late 2024.
The reason for the change is straightforward; the labor market has proven far more resilient than we originally assumed. A tight jobs market has afforded the Fed the luxury of extended window during which to remain hawkish and avoid normalizing policy rates lower. The ability of workers to continue to extract higher nominal wages has also kept Powell biased toward higher-for-longer and the performance of the real economy has allowed this stance to persist. We continue to see a return of 10s to the 3.00%-3.25% range as the path of least resistance in the coming quarters; just not tonight.
At the heart of our assessment of the stock market is our Capitalized Profits Model.
That model takes economy-wide profits (excluding profits or losses generated by the Federal Reserve) quarter by quarter going back nearly seventy years and discounts those profits by the 10-year Treasury Note yield in each of those quarters. We then compare discounted profits in those quarters with discounted profits today, putting equal weight on every previous quarter, and using that average to estimate value.
At Friday’s close, the 10-year Treasury was yielding 4.24%. Plugging that yield into the model (and assuming profits remain at the same level as they were in the first quarter) suggests a fair value for the S&P 500 of 3,170, substantially lower than the Friday close of 4,406.
It's important to recognize that the Cap Profits Model isn’t a “trading” model. You shouldn’t use it day-to-day; stocks can remain significantly overvalued or undervalued for prolonged periods of time. However, the model can be used to gauge how attractive stocks are relative to normal….
… One way to bring fair value up to Friday’s close of 4,406 would be for the 10-year yield to drop to 3.05%. But what do the economy as a whole and profits in particular look like in a scenario with a much lower long-term bond yield? The yield curve would be very deeply inverted and nominal GDP growth would have to be either much slower or expected to slow substantially in the near future. In turn, that would probably mean weaker profits…
…Again, don’t use the model as a reason to sell all your stocks today; that would be foolish. Investors should be focused on their long-term goals and their appetite for risk. The model is telling investors they should be at least a little wary and should allocate to sectors that are cheap relative to the market as a whole. Allocation is always important, and doubly so under conditions like these.
Goldilocks - US Daily: Remote Work, Three Years Later (i worked ‘remote’ for nearly 30yrs before it was cool … in / around NY metro area, NOT spending 2hrs commuting — EACH WAY — is a BIG deal)
The share of US workers working from home (WFH) at least part of the week has stabilized at around 20-25%, below its peak of 47% at the height of the pandemic but well above the pre-pandemic average of 2.6%. In this US Daily, we discuss the implications of WFH for office demand, consumer spending, and productivity.
The persistence of WFH reflects both structural and cyclical factors. Structurally, the pandemic-related lockdowns spurred technological innovations that make teleworking easier, and surveys show that workers now place more value on being able to work from home. Cyclically, tight labor markets over the last two years have made employers more willing to allow employees to work remotely. Using state-level data, we find that a 1pp increase in the job-worker gap leads to a 0.3pp increase in the share of remote job postings. This implies that further labor market rebalancing should reduce the share of remote job postings from 11.5% to 10.8% in the next 3 years.
WFH has reduced office utilization rates but has not yet led to substantial declines in office occupancy rates because most firms are locked in long duration leases. Going forward, 17% of all office leases are scheduled to expire by the end of 2024, 47% between 2024-2029, and the rest after 2030. Our baseline estimates suggest that remote work will likely exert 0.8pp of upward pressure on the office vacancy rate by 2024, an additional 2.3pp over 2025-2029, and another 1.8pp in 2030 and beyond, though this is likely to be partially offset by a decline in new construction.
The shift to remote work has also changed the geographic distribution of retail spending and employment. While spending on services that require face-to-face contact has now fully recovered in the aggregate, the recovery has been skewed towards suburban areas and away from city centers where traditional office-related activities take place.
Economic studies disagree on the productivity effects of WFH, with estimates ranging from -19% to +13% and compared to our baseline of +3% for pandemic productivity gains more generally. The lack of consensus across these studies is likely driven by differences in how they measure productivity and the types of tasks and industries they study. More recent studies that measure productivity through complex performance metrics in industries involving high-cognitive tasks reveal more negative effects.
UBSs Paul Donovan - Disinflation forces show up, again (haters gonna hate, this guy has something to offer but I dunno … seems to ME to almost ALWAYS be more ‘bout the catchy h’line as opposed TO content … I would note THIS VISUAL / TWEET, for example, which likely says as much // MORE ‘bout disinflation and EZ M3 than the following)
The UK BRC shop price index showed further disinflation in August. The moderating inflation was led by food inflation slowing, which may not entirely translate into official consumer prices. The risk with profit-led inflation is that companies lose customer loyalty. As attacks on profit-led inflation have increased, UK supermarkets have responded with two-tier pricing offering discounts to customers with loyalty cards. Those discounts appear in the BRC data, but not in the official consumer price data.
Eurozone M3 money supply turned negative last year. This does not mean deflation is around the corner (you cannot consider money supply without considering money demand). However, weaker bank lending is behind the move. The ECB’s autopilot tightening of policy is doing what it is supposed to by slowing credit growth, but unfortunately slowing credit growth does not offset energy-led or profit-led inflation.
US JOLTS labor market data will pretend to record job vacancies. The response rate for the survey underpinning this data is so low that only the weirdest of the weird can be presumed to respond. However, reported vacancies should decline. This is less because of an easing labor market, and more because job hopping is slowing.
Germany and the US offer consumer sentiment polls. These will exaggerate reality, as always.
WisdomTree’s Prof. Siegel: Case of Buy on the Rumor, Sell on the News (interesting and provoking of thought from someone who’s typically known for the more rosy outlook…)
… I was frankly disappointed in Powell’s speech. Since the last FOMC meeting last month, the only economic dynamic that occurred is an uptick in economic growth projections—particularly from real time forecasting models like those from the Atlanta Fed that show an over 5% estimate for Q3 real GDP…
… All that said, we are still quite early before the next FOMC point. Most do not see a rate increase at the September meeting and all eyes go to November. The market has started pricing in a 50-50 probability of a November hike, but we will get a lot more data before the November meeting. We are seeing rising delinquencies on auto loans, on credit cards, and there are signs of a credit default cycle picking up. These are downside risks…
… This week is a big week on the data front. We're going to have the money supply, Case-Shiller housing index, JOLTS and Friday’s labor market report. We also will get the PCE inflation data and the second estimate of GDP. Enjoy the final stretch of summer and let’s see how the data comes in this week!
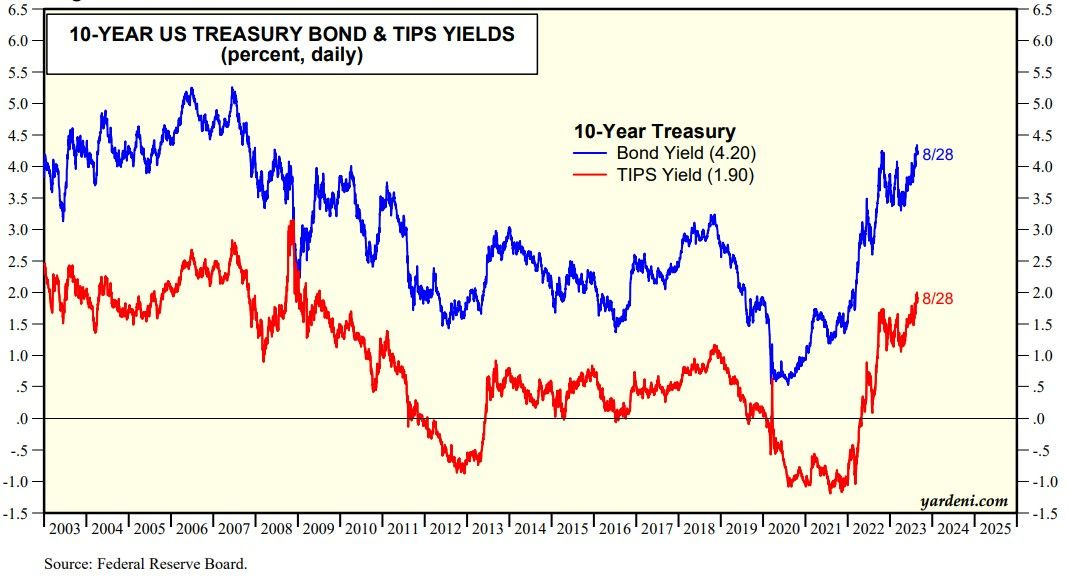
Today, the stock market performed better because the bond market performed better. The 10-year US Treasury bond yield remained below 4.25%, which was last year's peak (chart). A few days ago it rose slightly above that rate but didn't follow through to the upside. The same can be said for the 10-year TIPS yield, which backed off from 2.00%.
Breakouts above these resistance levels would undoubtedly unnerve the stock market, especially technology stocks, and particularly the MegaCap-8. The good news is that the Citigroup Economic Surprise Index (CESI) may be peaking (chart).
AND this mornings edition of something for those of us who are visual learners, a couple charts with this 1st one from a bond bullish report …
Alpine Macro - Bond Selloff: What’s Next? (the shop is admittedly ‘offsides’ but it was their concluding visual which offers a reason for pause and consideration)
The incredible resilience of the economy is both impressive and baffling. Naturally, many have begun to question whether the world has grossly underestimated the neutral rate of interest, or R*. Bond bears have powerful advocates, ranging from Bill Dudley, former New York Fed President, to Lawrence Summers, former Treasury Secretary, who thinks the fair value for 10-year Treasury yields is around 4.75%.
We have taken a constructive view on duration. Admittedly, we have been offside, to date. Nevertheless, we believe that bond yields are indeed close to, if not already at their cyclical tops. Below is our thought process…
… Chart 11 shows that the recent selloff in long bonds has primarily been caused by expectations of rates staying at elevated levels for “longer” rather than heading “higher”.
With changes in the expected path of Fed policy being a major driver of bond yields, we still see scope for a bond rally if, as we expect, inflation continues to melt, forcing the Fed to pivot more quickly than expected.
CitiFX - Chart of the Day: Update on the 2s10s curve
US 2s10s Curve: Last week, it posted a bearish outside week after failing to get above pivotal resistance at the 55-week MA.
The 55-week MA proved to be significant resistance back when it halted the steepening in March.
Therefore, this suggests a bit of a breather in the recent bear steepening that has occurred.
Visuals aside (well, almost NOT completely) a few words from a quasi OFFICIAL source,
St. Louis Fed FRED BLOG - Explaining the Fed’s recent conventional and unconventional monetary policy
This FRED graph chronicles the advent of “unconventional” monetary policy in
the US since the 2007-08 financial crisis and the recent efforts by the Federal Reserve to normalize monetary policy. The graph shows the unemployment rate (in blue), the stock of mortgage-backed securities held by the Federal Reserve (in green), and the effective federal funds rate (in red). While the first series reflects an objective of monetary policy, the other two series reflect instruments of monetary policy: the federal funds rate being a “conventional” instrument and the large holdings of mortgage-backed securities being an “unconventional” instrument.
Three recessions are visible, represented by gray shaded areas. In each recession, the unemployment rate increased and, in response, the Federal Reserve lowered the federal funds rate to stimulate economic activity. After the 2007-08 financial crisis, the federal funds rate became so low (virtually zero) that there was no way to lower it any further. So, the Fed put in place alternative means of stimulating the economy—hence, the label “unconventional monetary policy,” which includes large purchases of mortgage-backed securities starting in late 2008 (again: the green line). These unconventional actions by the Federal Reserve are often referred to as quantitative easing (QE). By purchasing large quantities of assets, the Federal Reserve lowered their yields, which is a mechanism akin to lowering interest rates to stimulate economic activity.
As the unemployment rate declined from its 2010 peak, the Federal Reserve started, in 2016, to “normalize” its monetary policy first by raising the federal funds rate again and then, in 2018, by gradually reducing the stock of mortgage-backed securities it held.
In 2020, the COVID-19-induced crisis prompted the Federal Reserve to lower the federal funds rate to its lowest possible level once again and to further stock up on mortgage-backed securities.
The unemployment rate declined rapidly after 2020 and, in 2022, the Federal Reserve started to raise the federal funds rate and reduce its holdings of mortgage-backed securities again. In this instance, however, inflation (not represented on the graph) played an important role. Until 2021, inflation had changed little, particularly in comparison with the changes in the unemployment rate. With the rise of inflation in 2021, the Federal Reserve had an additional motivation to increase the federal funds rate…
Finally, given recent attention TO AI (yesterday mention of MSs Sunday Start — disinflationary at first, but then…), here’s likely what IS actually going on in boardrooms and strat meetings everywhere


