(USTs modestly lower, flatter on decent o/n volumes)while WE slept; "Gradually, Then Suddenly"; MARG debt;
Good morning … Over the weekend, YELLEN SAYS, ‘US banks may tighten lending and negate need for more rate hikes’ (RTRS) while there are ongoing, Discussions between global regulators looking at moving “Interest Rate Risk in the Banking Book” to Pillar 1 of Basel rules and for the US to update the concept of “internationally active” banks.
YELLEN interview (CNN so, lets assume you didn’t see it yet)
Yellen to CNN: Despite banking crisis, soft landing still possibl
HERE in print (via CNBC?), she goes on to talk about how credit likely to tighten and, well, it shall take an economic toll …
… “Banks are likely to become somewhat more cautious in this environment,” Yellen said in the interview, which is scheduled to air on Sunday. “We already saw some tightening of lending standards in the banking system prior to that episode, and there may be some more to come.”
Oddly enough, one cannot find VIDEO interview anywhere … Funny but not, really.
It’s funny because she’s no longer the Fed chairman (unless I’ve missed the memo) and only the political appointed Treasury secy…Odd line of questioning but then … Funny one cannot find her sayin’ it but then, she’s becoming more and more a political hack, as each day passes…
Funny but then. NOT. Cuz, you know. CNN.
Feel better? They’ve ‘got this’ and … well, the message? REMAIN CALM, ALL IS WELL (?) Sorry. NOT sorry.
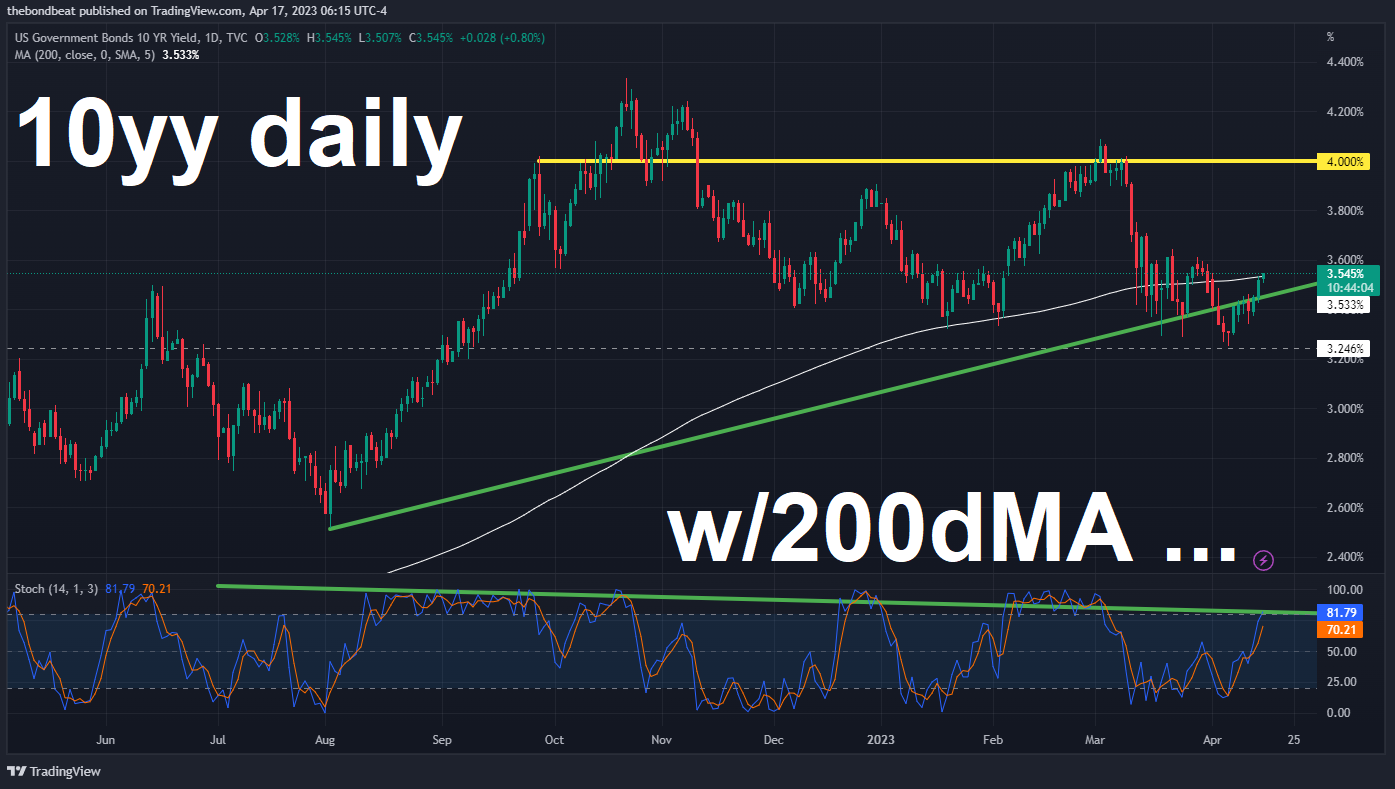
Moving along … 10yy having a peak AT / ABOVE 200dMA (3.533%) …
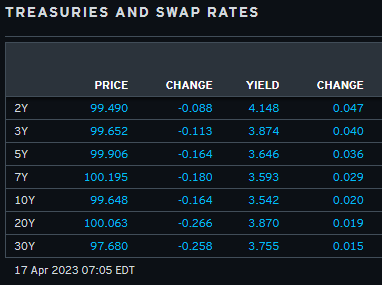
Make of it whatever you will … I do see momentum becoming oversold (but not yet there, on verge of bullish cross) … AND … here is a snapshot OF USTs as of 705a:
… HERE is what this shop says be behind the price action overnight…
… WHILE YOU SLEPT
Treasuries are modestly lower and the curve flatter this morning after being sharply unchanged 90mins ago (EGB's still little changed, Gilts higher) after an 8.8k block sale in FV futures once past the London crossover. DXY is modestly higher (+0.13%) while front WTI futures are modestly lower (-0.5%). Asian stocks were paced higher by Chinese exchanges (home prices rose at fastest pace in 21mo), EU and UK share markets are mixed while ES futures are little changed here at 6:50am. Our overnight US rates flows saw Treasuries richen during another quiet Asian session with a 7.5k block buy of TY's reported before the London open. We did see better paying during Asian hours, lifting spreads in the long-end a touch. Once London opened, fast$ sold ahead of supply with real$ names paying the front end. Desk colleagues note 'good' liquidity conditions but muted turnover. By our sheets, overnight Treasury volume actually looked pretty decent (~125% of ave) with solid turnover registered in 2's through 5's.… we show in this morning's first attachment of Treasury 5yrs that price momentum (lower panel) is with the tactical bears at the moment where a return to late March's spike high in rate ~3.80% can't be ruled out over the coming days
… and for some MORE of the news you can use » IGMs Press Picks for today (17 APR) to help weed thru the noise (some of which can be found over here at Finviz).
From some of the news to some of THE VIEWS you might be able to use… here’s what Global Wall St is sayin’ … I’ll begin by offering THIS LINK through to what little Global Wall St had to say over the weekend.
In as far as today goes, there are a very FEW things from the inbox to share …
First up a weekly WORLD economic view attempting to frame the battle of soft v hard data. Seth Carpenter notes,
The Weekly Worldview: The Tortoise and the Hare – Hard vs Soft Data
Soft data has proven to be more volatile in recent years. As we navigate this unique economic cycle, it is important to maintain perspective on what the speed and volatility of soft data tells us relative to hard data outturns.… Looking at the recent data, we can see that in 4Q22, there was a synchronized global decline in Manufacturing PMIs that found some respite in January and February before declining again in March. Actual industrial production has lagged the PMI decline, but in recent months we finally saw negative y/y industrial production as Europe and the US pulled down the global output (Exhibit 1). In speaking to investors, there is hope that the Chinese cycle provides a floor for the industrial cycle globally. Our recent work suggests that this hope may spring eternal,as this cycle is very different to previous cycles – something we have discussed in the past (see here).
AND a few MORE words from MS — these are on stocks, as is customary on a Sunday …
Sunday Start | What's Next in Global Macro: Gradually, Then Suddenly
A month ago, when the banking stress first surfaced, our primary takeaway for US equity markets was that it would likely lead to a credit crunch (here and here). Given our already well below-consensus outlook for corporate earnings, it simply gave us more confidence in that view. Fast forward to today and the data suggest a credit crunch has started. More specifically, they show the biggest two-week decline in lending by banks on record, as they simultaneously sell mortgages and Treasuries at a record pace to offset deposit flight. In fact, since the Fed began raising rates a year ago, almost $1 trillion in deposits have left the banking system. Throw in the already tight lending standards and it’s no surprise credit growth is shrinking. If that isn’t enough, last week the latest small business survey showed that credit availability had its biggest monthly drop in 20 years, while interest costs are at a 15-year high.
There's a passage in Ernest Hemingway's The Sun Also Rises in which a character is asked how he went bankrupt. “Two ways,” he answers. “Gradually, then suddenly.” This is a good description of recent bank failures. The losses from long-duration Treasury holdings and concentrated deposit risk built up gradually over the past year, and then suddenly accelerated, leading to the surprising failures of SIVB and SBNY. In hindsight, these failures seem predictable given the speed and magnitude of the Fed’s rate hikes, some regrettable regulatory treatment of bank assets – i.e., duration not risk-adjusted for Treasuries – and concentrated deposits from corporates. Nevertheless, most did not see the failures coming, which leads to the question of what other surprises may be coming from the most abrupt monetary policy adjustment in history?
In contrast to what we expected, the S&P 500 and Nasdaq have traded well since SIVB first announced it was insolvent. However, small caps, banks and other highly levered stocks have traded poorly as the market leadership turned more defensive, in line with our sector and style recommendations. Our contention is that the major averages are hanging around current levels due mostly to their defensive/high-quality characteristics and lower back-end rates. However, that should not necessarily be viewed as a signal that all is well. On the contrary, the gradual deterioration in the growth outlook continues, which means even these large-cap indices are at risk of a sudden fall like those we have witnessed in the regional banking index and small caps.
The analogy with Hemingway’s poetic passage can extend to the earnings growth deterioration observed over the past year. Until now, the decline in earnings estimates for the S&P 500 has been steady and gradual. Since peaking in June last year, the forward 12-month bottom-up consensus EPS forecast for the S&P 500 has fallen at a rate of approximately 9% per annum, which is not severe enough for equity investors to demand the higher equity risk premium we think they should. Further comforting investors is the consensus earnings forecast that implies 1Q will be the trough rate of change (y/y %) for the S&P 500 EPS, a key buy signal that we would normally embrace – if we believed it.
Instead, if we are right on our well below-consensus NTM EPS forecast, the pace of decline in these estimates should increase materially over the next few months/quarters as revenue growth begins to disappoint. To date, most of the disappointment on earnings has been a result of lower profitability, particularly in the technology, consumer goods and communications services sectors. To those investors cheering the softer-than-expected inflation data last week, we would say be careful what you wish for. Falling inflation last week, especially for goods, is a sign of waning demand, and inflation is the one thing holding up revenue growth for many businesses. The gradually eroding margins to date have been mostly a function of bloated cost structures. If/when revenues begin to disappoint, that margin degradation can be much more sudden (Exhibit 1), and that’s when the market can suddenly get in front of the earnings decline we are forecasting, too.
The S&P 500 EPS forecast has been falling gradually since June, but may soon drop more suddenly
Which then translates TO a note on a Monday as well, from Mike Wilson, noting …
Weekly Warm-up: Gradually, Then Suddenly
With the fastest Fed policy shift in 40 years, we think more negative surprises lie ahead for investors. One that we think is in plain sight is earnings forecasts that remain too optimistic. Record narrow breadth suggests the broader market could suddenly acknowledge this risk during 1Q results..
Gradually, Then Suddenly...Very few saw the sudden failures of SIVB and SBNY last month but that is exactly how these things happen—gradually, then suddenly—especially after the Fed has tightened policy faster than at any time in the past 40 years. We wonder what other "surprises" lie ahead for investors as the Fed hasn't been able to back off its fight against inflation. Our top concern is that earnings estimates remain too high and are likely to fall rapidly as revenue growth is the next shoe to drop, in our view.
Earnings Preview…Consensus expects 5% sales growth but -8% earnings growth for 1Q as negative operating leverage cuts into margins. Estimates for 1Q23 have been lowered 15% from the 2022 peak with 6% of that reduction coming since the beginning of the year. Investor focus is likely to be on credit availability, consumer spending, margins, and forward guidance, in particular.
Signals from the Soft Data...Our economists' composite Business Conditions Index (a survey of our equity analysts) fell to a cycle low in April. As our economists note: "Worries over tighter credit conditions weighed heavily on sentiment in April." We find that the MS Business Conditions Index is highly correlated to earnings revisions and points to a decline in revisions breadth from current levels. Further, the NFIB Small Business Optimism Survey continues to show weakness, and our industry group analysis shows that cyclical industries are already priced for a material rebound in the ISM Composite PMI…
… In addition to our view that earnings are likely to disappoint beyond Q1, we are also still dealing with an inflation problem despite the softer than expected inflation data mentioned above. In fact, on Friday we got a conflicting data point from the University of Michigan consumer confidence survey which showed a very large uptick in consumers' 1-year inflation expectations (Exhibit 3).
This is an important number because the Fed pays attention to it,and the bond market knows it. As a result, rates moved higher on Friday with the 10-year UST yield now back above the 200-day moving average just a week after it looked like it was breaking down. To be clear, the 10-year yield moved higher all week even with the softer CPI and PPI. This is due in part to the internals of these data series which were not as soft. More specifically, the Fed's favorite measure of core services inflation remains too high for its liking. In some ways, it feels like our original thesis of Fire and Ice could be back in play with the Fed forced to stay with its tightening path into a slowing economy and earnings. Our economists are now looking for 2Q GDP growth to be below zero with little improvement in 3Q. This jibes with our earnings forecast which assumes most of the downside being driven by lower margins, especially if revenues begin to disappoint from here. Such low real GDP growth increases that risk.
Wait, so … stock jockey’s watchin’ RATES? Lets me try that again … from another stock jockey, this time from across the pond,
U.S. Equity Insights: Leading Indicators Set the Tone
After a busy week of macro data, we revisit leading economic indicators (LEI) and their widening disconnect vs. consensus EPS estimates. LEI is firmly in recessionary territory and, building from our prior analysis of historical negative revision cycles, we are incrementally confident that earnings are due for a reckoning.
Oh nevermind … you get it … stock jockeys here, there and everywhere are watching rates and fact is we’re ALL macro tourists…
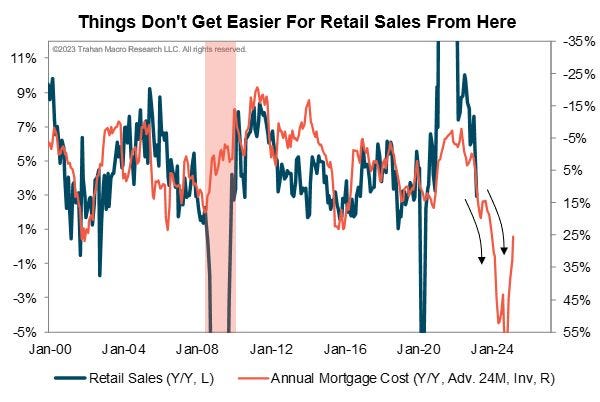
Welp, can’t beat ‘em then … join ‘em. Check this hit out from LinkedIN and Francois Trahan who attempting to connect dots between ReSale Tales and the cost of ones mortgage …
Not sure why anyone is surprised that Retail Sales are slowing? We have seen leading indicators of employment soften in recent months AND this is what happens to retail sales in the wake of higher rates. This chart shows that Retail Sales are behaving quite normally in this cycle. Retail Sales are plotted here with the cost of mortgaging the average house. This series is really good as an anticipatory indicator as it captures both the interest effect as well as the change in home prices (a proxy for inflation). Yes, both components that make up this indicator have pulled back in recent months BUT it leads Retail Sales by a full 2 years. Worded differently, Retail Sales are likely slowing through the end of 2024 which is an eternity from here. Moreover, it did overshoot in the GFC so who knows what lies beyond 2024. We shall see. FT
And since we’re talkin’ visuals and setting them ahead 24m, AND I’m a visual learner,
Chart of the Day: S&P 500 vs Margin Debt Change
The recent rise in interest rates has encouraged investors to take on less margin.
For some perspective, take today’s chart which overlays the 24-month change in inflation-adjusted margin debt on top of the inflation-adjusted S&P 500.
Conclusion…
The stock market has tended to struggle soon after a surge in margin debt.
And…
Stocks have tended to rally soon after a significant contraction in margin debt.
Hmmm okie dokie. When I was in a more relevant trading FI seat I wouldn’t frame the change in MARG debt on a 24m ROC basis and the correlation appeared far tighter and it was NOT something any of us — bond OR stock jockey’s spun in an equity bullish way.
In other words, NOT the chart I expected to find BUT INTERESTING, nonetheless
Remember, I’m never one to goalseek or shape / shift the narrative as I’ve never had an ax to grind.
Same newsletter / source offers some YTD RETURNS
Chart of the Day: Total Return by Asset Class
Which asset class has been the place to be so far in 2023?
Today’s chart answers that question by presenting the inflation-adjusted total return for five asset classes.
Today’s chart illustrates that stocks have significantly outperformed other asset classes since 2010 (gray columns).
So far this year, all asset classes (except for cash) are in positive territory (blue columns).
However, it is stocks that lead.
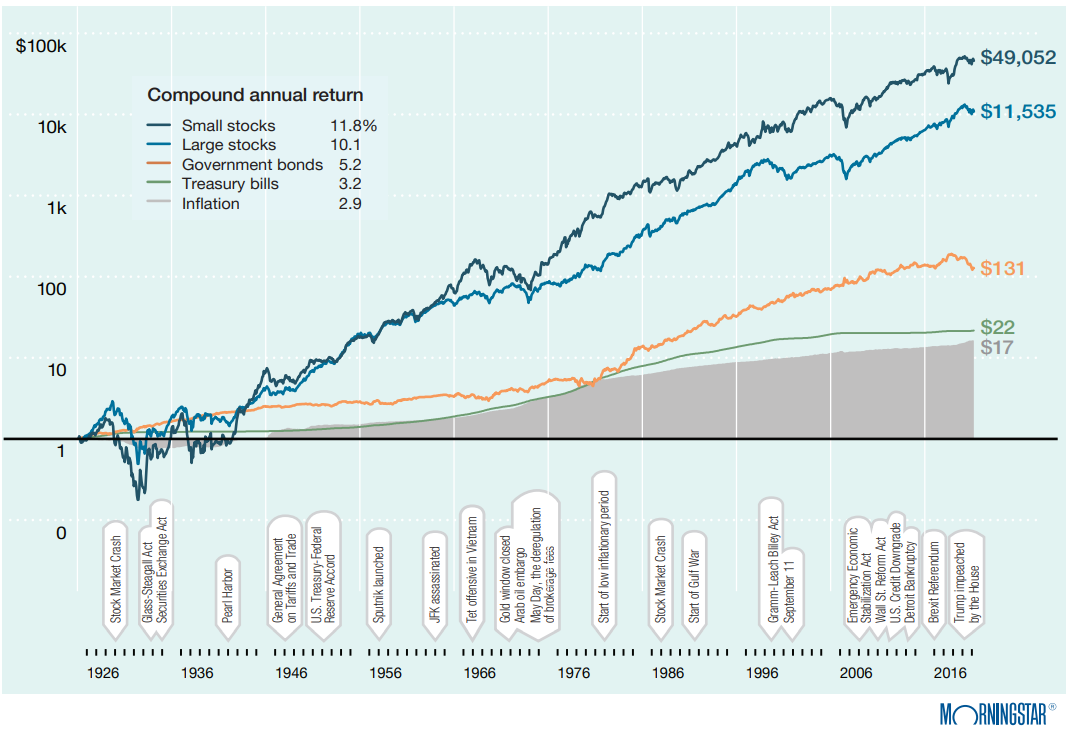
And so not only is it STOCKS FOR THE LONG RUN but also here, in this case, for the short run, too…here’s a look at 1926 - 2022 (latest avail)
A 96-year examination of past capital market returns provides historical insight into the performance characteristics of various asset classes. This graph illustrates the hypothetical growth of inflation and a $1 investment in four traditional asset classes from Jan. 1, 1926, through Dec. 31, 2022….
That in mind … some more of the ECONOMIC week ahead via Yardeni
The Economic Week Ahead: April 17-21
This is a light week for economic indicators, but there will be plenty of earnings calls to keep investors busy. We will be focusing on the two regional business surveys for April released by the FRBNY (Mon) and the Philly Fed (Thu). Together, they tend to foretell the outcome of the three other regional business surveys released later this month as well as the national M-PMI (out early next month) (chart). Collectively, they've been getting weaker and weaker over the past year and a half reflecting consumers pivoting from spending on goods to spending on services. We expect to see some bottoming action soon.
For more — economic calendars — HERE is what was noted over the weekend and … THAT is all for now. Off to the day job…have a great start to the day and week ahead!


