Good morning … I’ve not much to add to what those bright minds on Global Wall Street added (HERE) and to my update yesterday (HERE) and so a quick look at 10s vs 50dMA …
CAUTION WARRANTED in the shorter-term ….
… here is a snapshot OF USTs as of 705a:
… HEREis what this shop says be behind the price action overnight…
… WHILE YOU SLEPT Treasuries are modestly lower with the curve flatter despite bear steepening moves seen this morning in the German and UK bond markets. DXY is modestly lower (-0.12%) while front WTI futures are higher (+1.7%) after Russia and Saudi Arabia pledged to continue their voluntary supply cuts RTRS Asian stocks followed New York prices higher (KOSDAQ +7.3% this morning), EU and UK share markets are mixed/lower while ES futures are showing +0.2% here at 6:55am. Our overnight US rates flows saw the bear flattening shift begin during Asian hours where we saw active, 2-way trades from fast$ during the session. There were brief rate spikes higher during Asian hours and they were well-absorbed each time. In London's AM hours we've seen good buying in P-strips, helping to flatten the curve. We've also seen some real$ flattening interest in 2s5s curve. Overnight Treasury volume was about average except in 2yrs (163% of ave)…
… Back to Treasuries, US 10yrs have yet to take out their well-defined bear trendline, respecting local resistance near the October move lows (~4.51%) on Friday.
HE does it far better but … for some MORE of the news you can use » The Morning Hark - 6 Nov 2023 and IGMs Press Picks (who CONTINUES to be sportin’ that new, fresh look) in effort to to help weed thru the noise (some of which can be found over here at Finviz).
Moving from some of the news to some of THE VIEWS you might be able to use… here’s SOME of what Global Wall St is sayin’ …
Apollo- Trend Decline in Foreign Ownership of US Treasuries (positions matter as much and here are some of WHO is buyin/sellin)
A decade ago, foreigners owned 33% of US government debt. That number has now declined to 23%, see chart below.
CitiFX Techs - Bonds: Shaken-up; back-end stirred (continue to fancy bullish steepening trades and offering LEVELS TO WATCH…)
US 10yr yields:
Key support: 4.51%-4.52% (55-day MA and October low). We tested this on Friday
Opens a move towards: 4.34%-4.36% (2022 high, August 2023 highs)
US 30yr yields:
Key support: 4.64%-4.66% (55-day MA, October low).
Opens a move towards: 4.42%-4.47% (August 2023 high, 2022 high)
… The big story of last week was the epic rally in bonds and equities. It seems our seasonal chart we published on October 27th (link here), that basically said the bottom in US equity markets in H2 occurs on that day (using nearly 100 years of data), has picked the local lows perfectly.
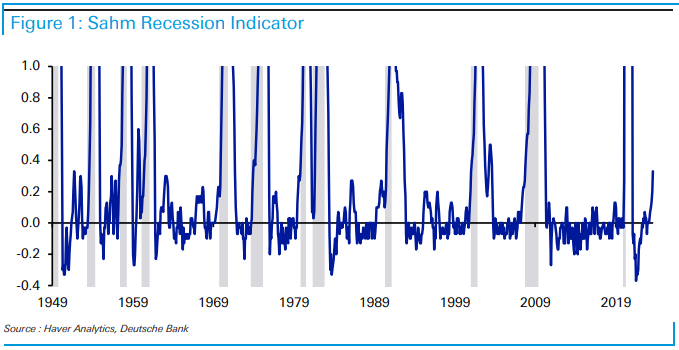
The S&P 500 (+5.85%) had its best week in a year and 10 and 30yr US yields rallied -26.4bps and -24.8bps respectively and had their best week since March and January. For Treasuries there was much talk about the QRA (quarterly refunding announcement) driving the rally. There's no doubt that this was the initial catalyst but the rally had 4 stages. First the QRA, then the weak ISM, then the dovish Fed (all on the same day), and then finally a weak payrolls report on Friday which we'll discuss at the end when we briefly recap the past week. The one thing we’ll say here is that the Sahm Rule got a little closer to being triggered with US unemployment (3.9%) now 0.5pp above its lows in April. The trigger is the 3m moving average being 0.5pp above the 3m moving average lows of the last 12 months and when this happens the US economy has always been in, or about to be in, recession (using post WWII data). It is currently 0.33% above the lows. So one to watch. The fascinating thing about markets is that the path to a hard landing is often via the appearance of a soft landing first. So we’re in this window where the data is softening but if it only ends up softens a bit, and then stabilising, then its great news. However if it's the start of something bigger it's not. The former scenario won out last week as you’ll see in more detail at the end in our review…
DB - Mapping Markets: 6 takeaways after a pivotal week in markets
… In light of these events, we discuss 6 takeaways for what this could mean going forward:
The US jobs report had lots of negative signals, and the data is consistent with other late-cycle periods just before a recession.
The bad data wasn’t confined to the jobs report. Several important releases from the US and Europe are suggesting a slowdown or contraction.
Despite the bad data last week, for now at least, these are not conditions historically associated with a pivot towards rate cuts.
This is also at least the seventh time this cycle that expectations have risen about a dovish central bank pivot.
All that being said, tipping points occur suddenly. Looking through history, a meaningful rise in unemployment or another shock could mean rate cuts happen quickly.
Bonds have been on track for a 3rd consecutive annual loss and remain so, including US Treasuries. But after last week’s rally, they're not too far away from being in positive territory for 2023.
Bloomberg’s global bond aggregate rose +1.93% last week, meaning that its YTD decline is now only at -1.24%.
Likewise for US Treasuries, a +1.61% recovery last week means its YTD performance is now at -0.97%.
Conclusion The data releases last week have added to the signals that the economy is looking late-cycle. But for now at least, it would still be historically early for a pivot towards rate cuts, particularly since inflation is still well above central bank targets. Nevertheless, history also tells us that this pivot can happen suddenly when it does occur, so further rises in unemployment or another negative shock could well be the catalyst for that occurring.
Goldilocks - 2024 Capex Outlook: Past the Peak on Subsidy-Led Spending
… Taken together, we expect business fixed investment growth to slow from +4% in 2023 to +1¾% in 2024 (Q4/Q4). We expect stronger growth of +2½% annualized in the first half of 2024—reflecting strong energy structures investment and rebounding equipment and intellectual property product investment—and weaker growth of +1% in the second half of 2024, as construction spending on manufacturing facilities declines.
MS - If At First You Don't Succeed | Global Macro Strategist (the move lower in bond yields causing FOMO)
Buy, buy bonds again. After the FOMC meeting, we reengaged with the long duration trade in the US. We remain neutral on the USD for now. While financial conditions have returned to nearly September FOMC meeting levels, economic data come mixed, with more recent data showing negative momentum.
… THREE STRIKES AGAINST DURATION BEARS IN ONE WEEK Last week, we suggested yields levels may be close to peaking – but don't yet have clear catalysts to drive them down meaningfully. And this week we go not one, not two, but three meaningful catalysts that have already spurred a rally in duration (see Exhibit 15 and Exhibit 16) and with potentially more to go. The three catalysts in this last week were:
Lower coupon supply: The US Treasury showed flexibility and lowered long-end coupon supply in line with our expectations but defying market expectations.
Weak labor market data: A very weak payroll report, offering the most number of downside surprises since 2019, weak unit labor costs and wages, and weaker soft data.
We recommended entering 3m30y ATM -25 receivers after the FOMC meeting on Wednesday (FOMC reaction below), as a way to add bullish exposure with limited downside, and continue to suggest holding the trade. We stay long SFRZ4 on SFRU3Z4Z5 fly. Next, we detail our takeaways from the three factors described above, starting with the latest payroll data….
…The market was heavily focused on Atlanta Fed GDPNow in 3Q as growth expectations kept rising (Exhibit 25). While early days, 4Q23 GDPNow is tracking at a mere 1.3% versus having been close to 5% for 3Q23. Additionally, our US economics team has been flagging the risk of lower GDP growth driven by the end of the student loan moratorium as well as a reversal of one-time upside from movies and concerts in 3Q23.
MS - Weekly Warm-up: What's Driving the Rally in Bonds and Stocks?
… Equity indices experienced their strongest weekly rally all year led by many of the YTD laggards. While we will keep an open mind, the move thus far looks more like a bear market rally rather than the start of a sustained upswing, particularly in light of weaker earnings revisions and macro data.
Rally in bonds drives stocks to best week in a year... We think last week's rally in stocks was mainly a function of the fall in back-end Treasury yields. In our view, the drop in Treasury yields was more related to the lower than expected coupon issuance guidance and weaker economic data as opposed to the bullish interpretation (for equities) that the Fed is going to cut rates earlier next year in the absence of a labor cycle.
…In our view, this move in equities was more about the strong rally in bonds than anything else. After another historic rise this past quarter, 10-year Treasury yields finally reached the psychologically important level of 5 percent near the end of last month. Real 10-year yields reached 2.5%—the highest level since 2007, excluding late 2008 when breakevens collapsed. One factor driving bond yields lower last week was the Treasury's announcement of its planned longer-term securities issuance which came in lighter than feared. We also attribute the rate move to the notion that economic data is starting to show signs of cooling from its torrid pace in 3Q. More specifically, Manufacturing and Services ISM PMIs fell by more than expected. The labor market data was more mixed on the surface but did indicate further signs of slowing. Continuing claims are now up more than 35% from the cycle trough, and the unemployment rate is now up 0.5% from the lows, often important thresholds in past cycles. Finally, revisions to past non-farm payroll data have consistently been negative this year, while the household labor survey indicted we lost 348,000 jobs last month. Given the absolute level of yields and the slowing growth and inflation backdrop, bonds may finally be attracting larger asset allocators.
Market reactions last week highlight the dangers of central banks bleating about data dependency without explaining their medium-term framework or how they expect policy to transmit to the real economy. It leaves investors tending to react very strongly to individual data items, even when (as with the US employment data) the figures are not precise and will likely be revised significantly.
This is not to say that markets are wrong to assume an economic slowdown and the peak of interest rates. “Higher for longer” for interest rates was always more of a media catchphrase than policy analysis. However, the Powell Federal Reserve may not start to reverse policy errors with rate cuts before the middle of next year, and reacting forcefully to every single data release between now and then is going to be exhausting…
Last week was a wild one for sure in the bond and stock markets. The bond yield plunged and stock prices soared led by SMidCaps and interest-rate sensitive sectors and industries. Fears that the bond yield might continue to surge above 5.00% evaporated in response to weaker-than-expected employment indicators and a broadening consensus that the Fed is done raising the federal funds rate. The bond yield plunged 41bps from last month's peak of 4.98% on October 19 to 4.57% on Friday (chart). The 2-year yield dropped 31bps from 5.14% to 4.83% over this same period. The yield curve spread is now just -26bps.
The stock market seems to be following the classic pattern of a bullish year that started with a very positive January Barometer. The S&P 500 was up 6.2% this year during that month. It is also the third year of the presidential cycle, which tends to be the best of the four years of a presidential term. Even the seasonal script is back in play after last week's epic rally. September and October have a tendency to be tough months for the stock market, setting the stage for Santa Claus rallies during the final two months of the year…
The 10-Year Treasury yield had one of its biggest weekly drops since the Financial Crisis last week:
Bloomberg - The Tipping Point From Tight to… What, Exactly? (Auther’s OpED)
The economy is slowing, and monetary authorities think financial conditions are tight. A big market rally could upset that view.
… All this said, how exactly has the market reacted? This is where it gets very interesting. After a summer in which the Fed and other central banks had convinced markets that they really would keep rates “higher for longer,” that belief has taken a sharp knock. Bloomberg’s estimates of the rates priced in for the Fed in January of 2025, and for the European Central Bank in June next year, have dropped very sharply. The assumption once more is that the easing cycle will get going next year and move quite swiftly once it starts:
That’s quite a move. As for the critical 10-year Treasury yield, it had looked as though the bond selloff was overdone. Last week’s surge back into bonds has left the 10-year yield challenging the short-term support of its 50-day moving average. A few more days of traffic in the same direction are needed before we can clearly say that the upward trend is over:
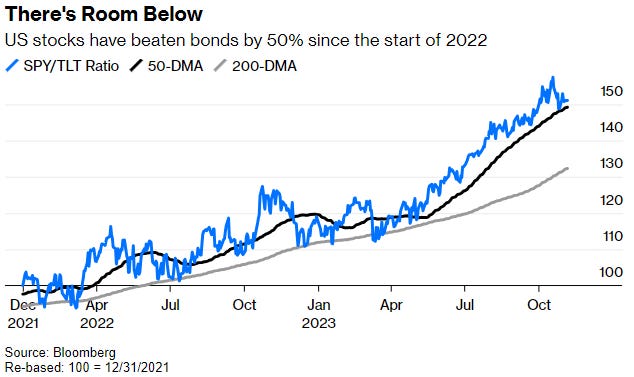
… The essential asset allocation choice between stocks and bonds remains more finely balanced than ever. Proxied by the main exchange-traded funds tracking the S&P 500 and Bloomberg’s index of Treasuries dated 20 years or longer (universally known by their tickers SPY and TLT), we find that the dramatic upward trend for stocks compared to bonds remains intact, but that the last few days have brought it back to test short-term resistance, despite the rise in stocks. If bonds were to gain more, there is a lot further for this ratio to move:
… How do you define what conditions matter in any case? And if it’s the market that has made conditions tighter, it follows that it can also make them looser. Buying things like credit because tight conditions mean there will be no more rate hikes is self-defeating, as it loosens conditions again.
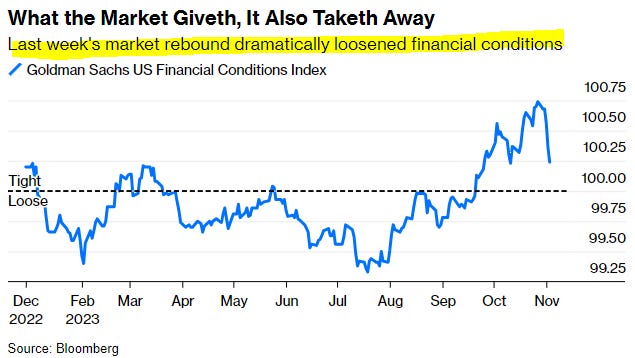
For a demonstration of this last effect, here’s the Goldman Sachs financial conditions index (whose genesis Bloomberg Opinion colleague Bill Dudley explains here). It’s defined by its inventors as “a weighted average of riskless interest rates, the exchange rate, equity valuations, and credit spreads, with weights that correspond to the direct impact of each variable on GDP.” It suggests that conditions were as tight as they had been all year to start last week, and since then they’ve dropped more than half of the way toward neutral:
This is a classic example of what the financier George Soros calls “reflexivity” — the capacity of markets to create their own reality, and not just reflect an external state of affairs…
… Moving on to definitions, the longest running index in use today is kept by the Chicago Fed. It’s constructed to have an average value of zero, and then its scale is measured by the number of standard deviations by which conditions differ from that average. This means that the index grows less variable over time, but the general pattern is that conditions are usually somewhat easy — and that when they tighten, they can get very tight indeed. But that doesn’t apply at present. Looking back 50 years, we discover that national financial conditions were actually looser than average at the beginning of last week:
That suggests that monetary policy still isn’t biting. But the Fed has a more recent internal benchmark, explained here, which is published monthly and currently available until the end of September. It’s based on seven variables: the fed funds rate, the 10-year yield, the 30-year fixed mortgage rate, the triple-B corporate bond yield, Dow Jones’ total stock market index, the Zillow house price index, and the nominal broad dollar index, and is weighted according to the impact they’re each having on the economy. The index shows the impact that the change in these measures in the preceding three years will have on gross domestic product over the next year, and it suggests life was getting difficult by the end of September:
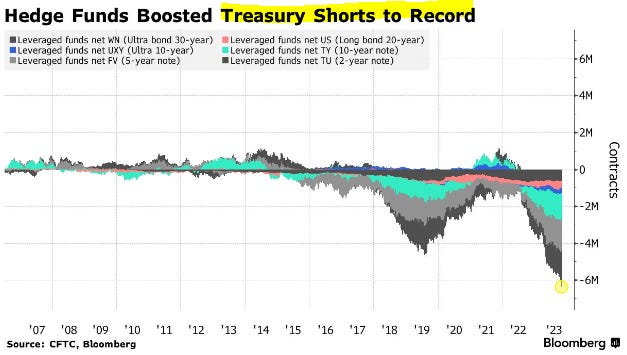
Bloomberg- Hedge Funds Catapulted Treasury Shorts to Record at Wrong Time (POSITIONS matter … more just below)
Investors boost net short UST futures bets to most since 2006
‘Short US Treasuries positioning was at an extreme’: Macquarie
Hedge funds extended short positions on Treasuries to a record just before smaller-than-expected US bond sales and weaker jobs data spurred a rally.
Leveraged funds ramped up net short Treasury futures positions to the most in data going back to 2006, according to an aggregate of the latest Commodity Futures Trading Commission figures as of Oct. 31. The bets persisted even though the cash bonds had rallied the week before.
“It feels like short US Treasuries positioning was at an extreme last week, which was an accident waiting to happen,” said Gareth Berry, strategist at Macquarie Group Ltd. in Singapore. “Price action in Treasuries for the past few months was a classic case of a persuasive story feeding the price action, until it went too far, leading to an overshoot which is now correcting.”
Yields on 10-year Treasuries have fallen 43 basis points since their 5.02% peak on Oct. 23, as traders for the $26 trillion bond market swung back to pricing the end of rate hikes. The combination of more benign US refunding needs, weaker-than-expected jobs data and signs of the Federal Reserve turning less hawkish may have spurred wide-spread covering of short positions.
Investors may also have taken short positions as part of the basis trade, a strategy that seeks to benefit from small pricing mismatch between futures and the underlying bonds for the contract. The trade often involves heavy borrowing, which can worsen market volatility when funds are forced to close positions in a hurry.
According to the latest CFTC data, asset managers extended their bullish positions in Treasury futures.
Traders are pricing in more than 100 basis points of cuts by the end of next year from an expected peak rate of 5.37%, swaps data show. They have brought forward their predictions for the first cut to June from July following the policy decision and payrolls data.
US officials signaling discomfort with higher yields “puts the brake on momentum-driven selling,” Citigroup Inc. strategists including Jabaz Mathai wrote in a note. “The combination of weaker data, dovish signals from Powell and a better-than-expected refunding outlook means that Treasuries are likely to continue rallying” into the new week.
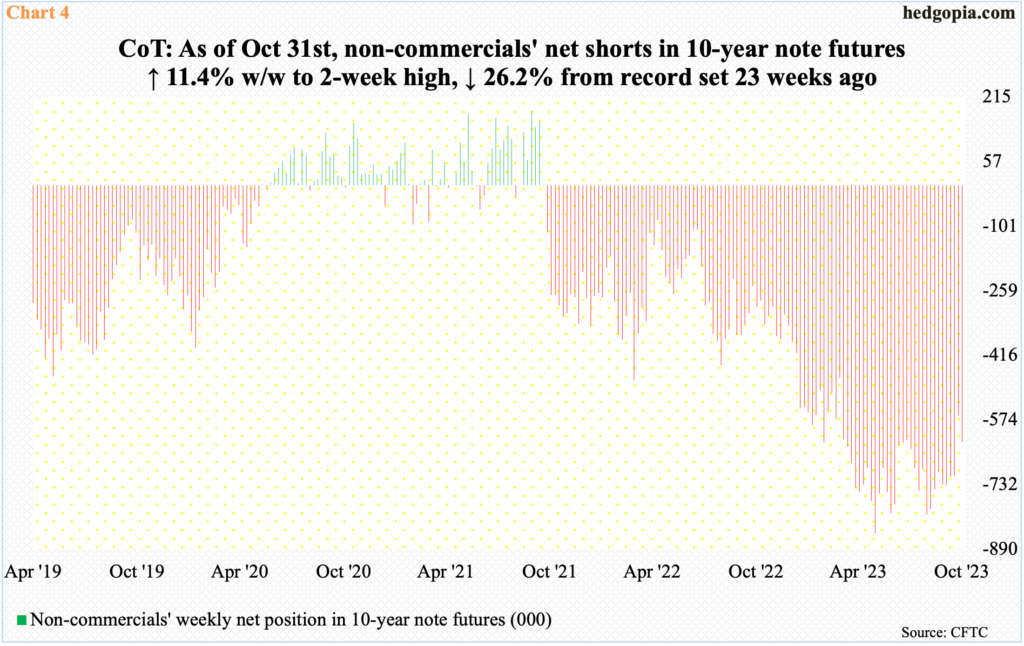
Hedgopia - Peak In 10-Year Treasury Yield Likely Leads To Sustained Covering By Zealous Shorts (POSITIONS matter and this short note worth a look IMO)
It is probable the 10-year T-yield has peaked at five percent. In this scenario, a sustained move lower will put shorts, who were heavily betting on higher rates, under pressure to cover.
Two weeks ago, the 10-year treasury yield met with strong resistance at five percent – or just under. For three consecutive sessions in October, the level denied bond bears (on price) continued momentum, with a high of 4.997 percent on the 23rd, preceded by 4.993 percent on the 20th and 4.996 percent on the 19th…
… The 10-year followed the short rates higher (Chart 2). Early March last year, it touched 1.68 percent before heading up.
… Mid-October, short interest on TLT (iShares 20+ Year Treasury Bond ETF) shot up 52.2 percent period-over-period to 46.3 million – a record high. In seven months, short interest has tripled (Chart 3). Giving credit where credit is due, these shorts have killed it directionally, as yields headed higher and prices lower. (Prices and yields have an inverse relationship.) But any signal that the trade has run its course will tempt them to lock in the gains. This in and of itself can send rates on the long end of the yield curve lower – timing and magnitude notwithstanding.
Similar dynamics are in play in the futures market, where non-commercials have accumulated net shorts in 10-year note futures up to the gills.
As of May 30th this year, these traders were net short 850,421 contracts – a record. Since then, holdings have fluctuated quite a bit but in essence non-commercials are hanging on to their overall bearish theme. As of last Tuesday, they were net short 627,698 contracts, down 26.2 percent from the May high but still massive.
Once these traders decide to go the other way and begin to cut back their holdings, yields are likely to face a headwind – which in and of itself has the potential to act as a self-fulfilling prophecy.


IMHO Someone(s) want: Gold below $2,000
10 yr below 5%,
and Oil below $90