Good morning … NFP dead ahead and any / all predetermined narratives will likely be tossed to the cutting room floor, as they normally are. Fear NOT as Global Wall Street will come to rescue with new, improved and even BETTER narrative. Hopefully I’ll have time over the coming weekend to organize and update that weekly ‘spin’.
That said, what follows cannot be of much use to anyone by definition … prices are set to change and instantly reflect new / different outcomes of all sorts and so, I’ll save ANY / all spin until weekend and provide you SOME spin to consider and essentially help pass time between now and 830a. And speaking of SPIN, Mary Daly (FRBSF) spoke yesterday in NY …
… If we continue to see a cooling labor market and inflation heading back to our target, we can hold interest rates steady and let the effects of policy continue to work. Importantly, even if we hold rates where they are today, policy will grow increasingly restrictive as inflation and inflation expectations fall. So, holding rates steady is an active policy action.
Likewise, if financial conditions, which have tightened considerably in the past 90 days, remain tight, the need for us to take further action is diminished…
… SO basically, recent tightening in financial conditions = a hike. She said as much,
Daly: Recent Bond Market Tightening Equals One Rate Hike
For those thinking about markets doing the Feds work (Daly) and for those looking short term bets, here’s something to consider,
BBG: Bond Traders Are Betting Historic Sums on November Federal Reserve Meeting
By Edward Bolingbroke
Open interest in fed funds futures contract rises to record
Wagers on a Nov. 1 hike appear to be leading the charge
Bolingbroke one of the best … YOU — betting on Nov 1 hike — are becoming the not-so-silent majority?
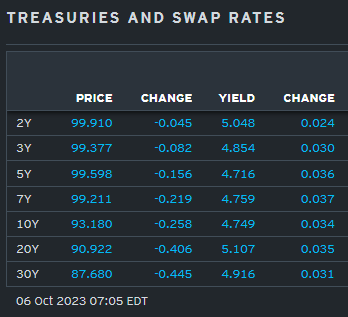
Before rushing TO ‘double top’ judgement, kindly note momentum (stochastics, bottom panel) where rates have taken a step BACK from the edge of the cliff, I’d be wary of declaring ‘victory’ and backing up the truck to BUY 2s … Unless, of course, you are a disinflation’ista and think NFP about to fall off aforementioned cliff taking ‘flation along with it.
That is for another day and … here is a snapshot OF USTs as of 705a:
… HEREis what this shop says be behind the price action overnight…
… WHILE YOU SLEPT Treasuries are modestly cheaper across the curve on ~70% volumes, as a routine BoJ funding operation left JGBs slightly steeper and a light calendar in the EU leaves US NFP the main-event. EGBs are underperforming on a better-than-expected German factory orders report, peripheral spreads just 0.5-1.5bps wider alongside a decent pop in EU bourses (DAX +1%). USD-crosses are generally listless, save for a +0.4% rally in USDJPY (to 149.05). The energy complex, coming off a couple rough days of sledding, is looking more stable this morning with Oil futures +0.3%, gasoline +1.2%, and HO +1.3%. UST flows have been un-exciting so far, mostly book-squaring variations, some flattening seen in 5s10s SOFR, and light receiving interest in 20y space. S&P futures are +9pts here at 7am.
… and for some MORE of the news you can use » The Morning Hark - 6 Oct 2023 and IGMs Press Picks (who CONTINUES to be sportin’ that new, fresh look) in effort to to help weed thru the noise (some of which can be found over here at Finviz).
Moving from some of the news to some of THE VIEWS you might be able to use… here’s SOME of what Global Wall St is sayin’ (in a similar sorta way you’ll find content if you pay for ZH PREMIUM? except … they are SELLIN other folks data where as I’m just point it out and links provided — should work IF you have permission and should NOT work if you don’t … HOW can THEY do that?? askin’ for a friend as I never understood how they do it…)
BAML - Real money longs intact: AMs extend duration, UST fund inflows recover (positions matter and this a good recap / view of how they COULD impact moves we see into / thru / beyond NFP)
No clear evidence Last week’s rate selloff occurred alongside a recovery in UST fund inflows, an add to asset manager longs, and no clear shift in duration views from benchmark fixed income funds. While CTAs appear to be maintaining steepeners and shorts, our models suggest that they haven’t been adding materially to these positions alongside the recent price action. The continued move higher in rates leaves a vulnerable long position likely held by the real money community that has not been abandoned based on our overall flows assessment.
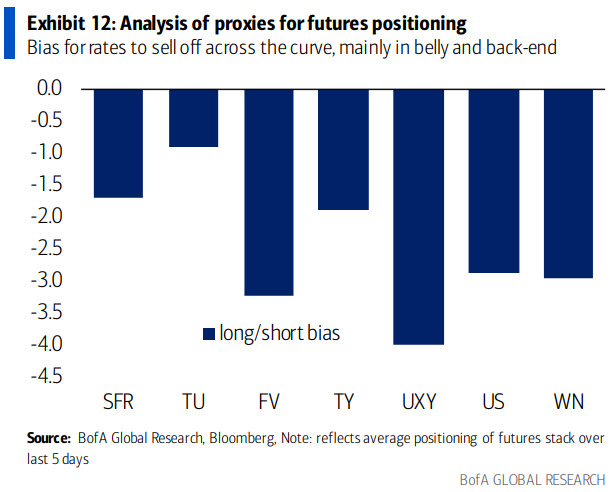
Bias is higher and steeper Our futures positioning proxy (for construction details see: Gauging positioning in Treasury Futures) reflects a bias for rates to sell off, most notably in FV and US (Exhibit 12). Across the curve, the composition of open interest shows a significantly higher share of shorts that are ITM vs longs (Exhibit 11). The stronger bias for longer vs shorter tenors to selloff also points to greater long covering potential at the backend which could exacerbate bear steepening. On the week through Thursday, open interest increased—with shorts added particularly in the belly of the curve.
BCA - How Far From The Peak?
… Looking ahead, we see inflation continuing to moderate and believe that the Fed will respond by holding the funds rate steady at its current level for a prolonged period, much as it did in 2006/07. In response, Treasury yields will soon peak once this shift in Fed policy becomes apparent and will then enter a sideways trading range.
That said, with the market’s rate expectations still below the Fed’s median “dot” and elevated long bond positioning among asset managers, the selling could continue in the near term. Though, in the absence of a second wave of inflation and the resumption of Fed rate hikes, we view the current funds rate of 5.33% as a firm cap on yields further out the curve (Chart 1).
US bond investors should keep portfolio duration close to benchmark and favor carry trades that will profit in an environment of a stable funds rate and falling yield volatility.
Barclays - U.S. Equity Strategy: Food for Thought: Don't Poke the Bear Steepener (all the rage with note — noted HERE YEST — about how the only thing which would stop rates selling off was equity correction)
Bear steepening out of inversion seems to break from tradition in terms of yield curve recession signals of the recent past. However, looking further back to prior high-inflationary periods suggests that we have traveled this road before, which would leave equities few opportunities to escape unscathed.
BNP - Global rates: More duration to digest in 2024 (NOT what any of us wanna see / read AND reminiscent of Apollo’s point HERE YEST)
The sharp rise in funding needs seen in the US and eurozone this year is unlikely to be repeated in 2024, with total net issuance (bills and coupons) likely to stabilize or decline outside of the UK.
Despite some fiscal stabilization, QT (ongoing in the US, accelerating in Europe and the UK) and a tilt towards more coupon issuance will mean that global supply (ex T-bills) to the public rises meaningfully in 2024.
In aggregate, we project USD2,948bn in net coupon supply net of QT in 2024, a 48% rise from 2023.
This may sustain some of the reset higher in yields even if economic weakness sets in, while supporting tighter swap spreads and pressure on the periphery in Europe.
BNP - Brent: Buy the dip (NOT what any of us wanna see / read)
We initiate a trade idea to buy the Jan Brent contract for USD82.85/bbl because we think the current sell-off is overdone
We expect prices to rise again to above USD90/bbl when refinery maintenance ends in November and historically low Cushing stocks become the focus point again
We reflect this conviction by suggesting investors buy the …
DB - CoTD: Happy 15th birthday to the QE era (noted HERE on ZH, “Happy 15th Birthday to The QE Era” too…so apparently its a big deal)
It's 15 years this week since TARP finally got passed through Congress at the second attempt. Although the financial crisis was in full flow by then, this legislation arguably marked the point where central bank asset purchases became mainstream. G10 balance sheets totalled around $5tn at this point, having slowly reached this over centuries of history. By the end of 2021, this figure was close to $30tn. These are now declining given QT and various other run-offs. Currently, this is having the greatest impact on government bonds as reduced demand (which QT is a big part) has met higher supply…
… Bonds have been poor performers, which is a legacy of the index rebalancing repeatedly at lower and lower (near zero) yields in the 2010s. Yields are generally around the same level as they were just before TARP so the poor returns are not because of the yield on offer back then. The long-term 100 year return of 10yr USTs and Bunds has been 4.8% and 4.1% p.a., respectively. But over the last 15yrs they've been at 1.9% and 1.7%, respectively. So while QE directly purchased them, the reality is that eventually so much QE and government spending occurred, that ultimately inflation and supply have overwhelmed bonds in return terms…
DB - USD rate forecast: full steep ahead (timely after noting how bad USTs have done — relatively speaking - since QE era has begun)
… The resulting UST forecast has the 2y ending this year at 4.45% before dropping to 3.4% by mid-2024 – as recession and Fed rate cuts approach – and drifting down further from there. While the 10y can undoubtedly rise above 5% in the near-term, we project it will also end the year lower, at 4.4%, and decline to 4.1% by mid-next year. We continue to forecast a significantly steeper curve, with 2s10s ending this year close to zero. Relative to forwards, the forecast entails lower yields – especially at the front-end – and a steeper curve, but far-forward rates (e.g., 5y5y) that are broadly in-line…
… The market is largely pricing a soft landing, while our forecast is predicated on a mild recession with some upside to term premia and above-consensus r-star. The main risk directionally to the forecast would be a more resilient labor market and persistent inflation that leads to further Fed hikes and more gradual cuts. On the other hand, a deeper recession would result in an easier Fed, lower yields, and a steeper curve, though in that scenario as long as our views on higher r-star and term premia are correct, the impact on the 10y forecast should be modest. We see tighter-than-expected fiscal policy as a key potential catalyst for a deeper downturn.
We estimate nonfarm payrolls rose by 200k in September (mom sa), above consensus of +170k. Big Data indicators indicate strong job growth on net, and we place little weight on the ADP miss because of its lop-sided composition and because of the negative correlation between that indicator and nonfarm payroll growth. Additionally, the further decline in initial jobless claims is consistent with fewer end-of-summer layoffs than usual. On the negative side, September payrolls exhibit a downward bias in the initial prints, with job growth subsequently revised higher in eight of the last ten years (we assume a 40-50k headwind in tomorrow’s report). We do not assume a drag from labor disputes, because the United Auto Workers strike started after the beginning of the survey week.
We estimate that the unemployment rate declined one tenth to 3.7%—in line with consensus—reflecting a rise in household employment and unchanged labor force participation at 62.8% (we do not expect the August rise in the foreign-born labor force to reverse). We estimate a 0.30% increase in average hourly earnings (mom sa) that edges the year-on-year rate lower by 1bp to 4.28%, reflecting waning wage pressures but positive calendar effects (the latter worth +5bps month-over-month, on our estimates). Consensus for average hourly earnings is +0.3% mom and +4.3% yoy.
… As we move into a new regime of lower inflation, we should look to concerted changes in stock prices relative to bond yields. We’ve seen, as evidenced in the 1970s, that when inflation is high, rising yields do significant damage to stocks. Also, when inflation cools, and yields turn lower, then stocks can do well, as we saw in the 1980s and 1990s. inflation continues to decelerate, the high interest rates we’re currently experiencing don’t necessarily spell doom for stocks. The chart below shows recent history during the 2020s and how this new trend could already be materializing.
Conclusion As we wrote in this week’s Weekly Market Commentaryhere, we believe interest rates hold the key to whether we get a fourth quarter rally from stocks, and inflation may hold the key to whether interest rates come down—though there are certainly other factors putting upward pressure on interest rates (including government dysfunction in Washington, D.C.).
Given the historical relationship between stocks and bond yields, we believe lower inflation will eventually be met with negative correlations between stocks and yields, and we will see stocks up as yields fall. The timing is uncertain, but with the Federal Reserve likely done hiking interest rates and inflation poised to continue its steady decline in the coming months, we wouldn’t be surprised if stocks started another run higher in short order. Something else to keep in mind: The best two-month period of the calendar for stocks historically is November-December as we wrote about here.
There is more uncertainty around payrolls than usual. Other labor measures differed sharply in September. Our 180k forecast for total payrolls and 150k for private is on trend, still below earlier in the year. UE slips 0.1pp to 3.7% , with no change in participation. AHE stalls at 0.3%M/4.3%Y.
UBS - More soft-landing signals? (ah, hope continues to spring eternal)
This is your monthly reminder that average hourly earnings are not wages, and wages are not labor costs. There is only a weak link from average earnings to inflation pressures from labor costs. Otherwise, it is US employment report Friday—a survey that has been declining in quality in recent years, but which is still a market obsession. Because the US Federal Reserve is a reactive institution, today’s report will impact monetary policy expectations. The skew in market forecasts is for a weaker number.
Stepping back from the noise the US labor market still suggests a soft landing scenario. Unemployment is sufficiently contained that fear of unemployment is low—encouraging consumption. Wage growth has been trending slower, but the slowdown of inflation is more aggressive (giving rising real wages). Household income has been further helped by increased female participation in the workforce.
Wells Fargo - Time to Rethink Excess Savings (NOT a question but a statement … noted)
Summary A defining characteristic of the current economic expansion is the uncanny staying power of the consumer. In this report we explain why we are moving away from the “excess savings” measure we previously used and why we will no longer make estimates of how long excess savings will last.
… In the first 12 months that followed the pandemic, robust fiscal policy under two different presidential administrations boosted personal income in an impactful way. The three largest of these programs—the CARES Act, the December 2020 COVID-19 Relief bill and the American Rescue Plan in 2021—played the biggest role in boosting pay and are clearly visible in the data for real disposable personal income (Figure 1). There were other measures as well, from student debt relief to provisions that allowed people to stay in homes or apartments rent-free without fear of eviction also played a more marginal, but not inconsequential role in supporting the health of consumer balance sheets..
… And from Global Wall Street inbox TO the WWW,
AllStarCharts - A Potential Target For Yields (food for thought and as they say ALL opinions are created equally and SOME are often thought to be MORE equal than others and in this case, perhaps it’s all in simply naming your organization correctly and so, it shows up nearly first in the alphabetical list AND gives the impression you know more than everyone else? hey better than Santelli 13%, amIright?)
Rising rates have been a worldwide phenomenon for the last two and a half years as yields have climbed non-stop.
Not only are we seeing the curve in the US reach decade-long highs, but the benchmark yields in Germany, France, Spain, and even Japan are also trading at multi-year highs.
Below is the US 10-year Yield reaching its highest level since 2007 after breaking out of a multi-month base three weeks ago.
As you can see, TNX is already on its way to a fresh leg higher after consolidating for roughly a year.
Although we have yet to determine where it will end up, as technicians, we often measure the pattern’s height to obtain a potential target.
This gives us a level of 5.45 for the 10-year, giving some room to keep running higher.
AllStarCharts- Stocks Grapple with Bond Market Volatility (just when you thought they had ALL the answers …)
Borrowing costs are increasing, and US treasuries are tanking – again.
Everyone knows it. Even my therapist commented on interest rates and the “terrible” economy.
The 30-year T-bond has hit our initial target. And the 10-year is within striking distance.
So much for limited downside risk for the bond market. Perhaps the call for a 5.25 print on the 10-year yield by Christmas wasn’t aggressive at all.
But elevated yields aren’t the problem…
And I don’t care about the economy when it comes to market speculation.
Remember, we don’t trade the economy. We trade the markets or – more precisely – price.
Interest rates hung around decade highs earlier this year while the Nasdaq 100 enjoyed its best first half since its inception.
Stocks like it when interest rates loiter. But they don’t fare well as yields accelerate.
That’s why I’m more concerned with increased bond market volatility – not elevated rates.
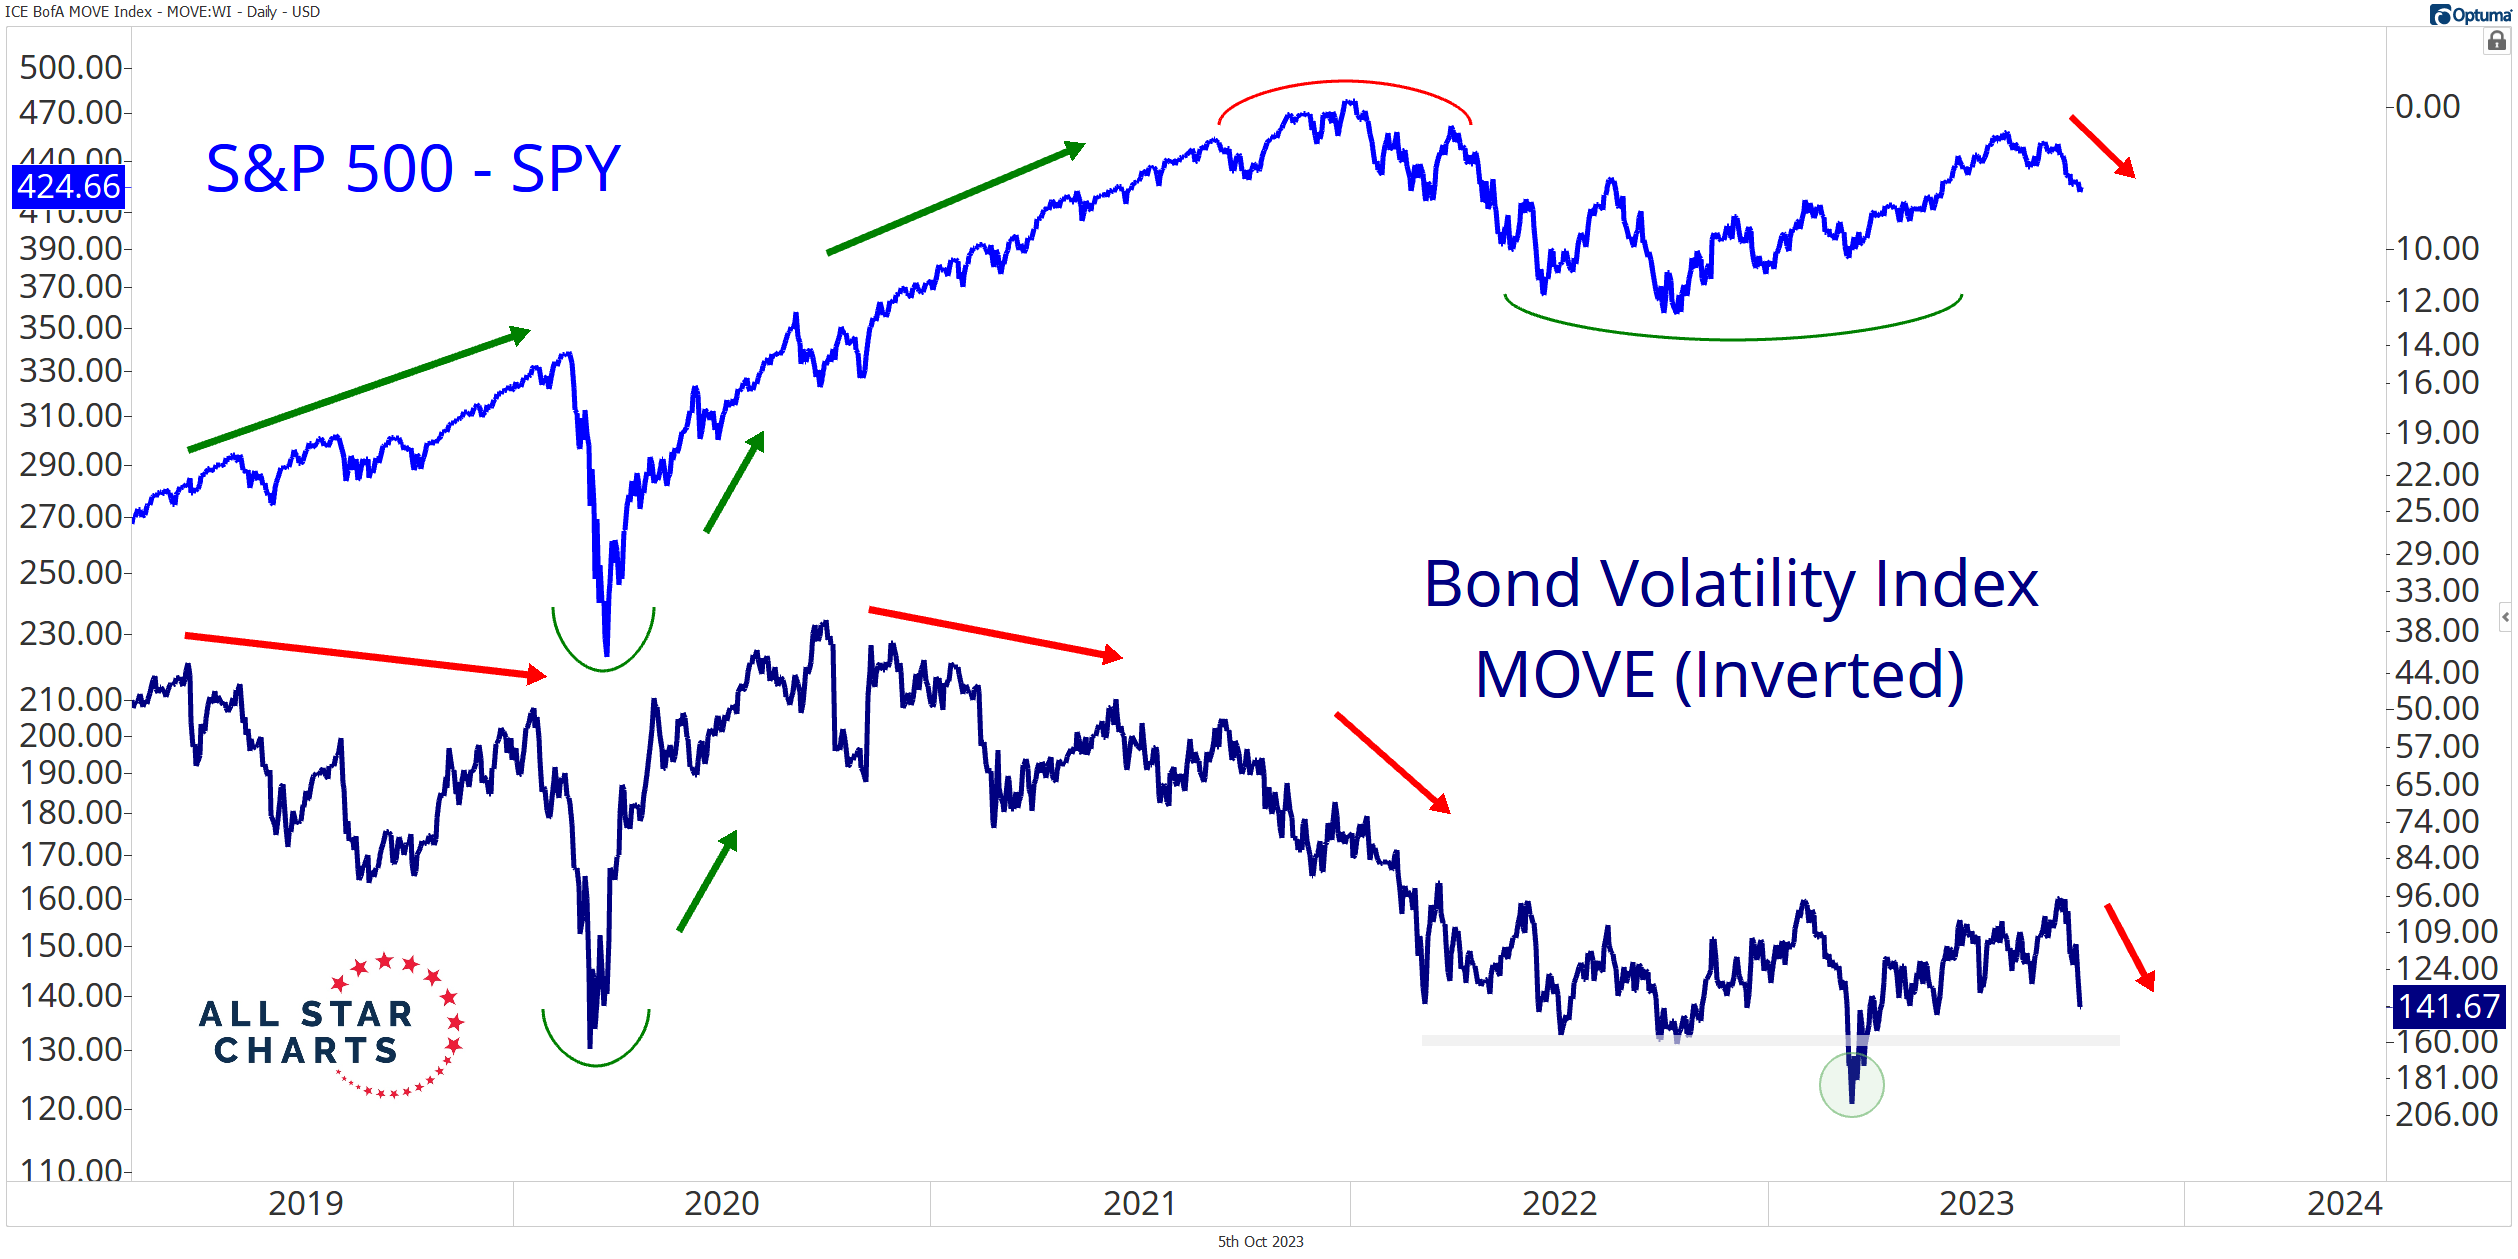
Check out the S&P 500 ETF $SPY overlaid with the Bond Market Volatility index $MOVE (inverted):
Risk assets need to be the hot ticket on the street. If bonds are receiving all the attention, ripping in either direction, it likely implies systemic risks for the overall market.
All markets will feel the effects if bonds – the largest asset class in the world – experience turbulence.
The key difference between then and now: Bonds are falling at an accelerated rate as yields rip.


BAC, 5000 yr low in IRs.........and I guess Adam, was a Bond Trader. LOL !!!!
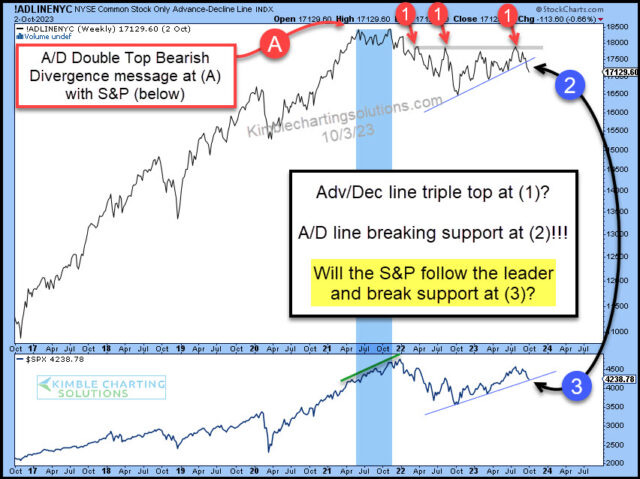
Triple Top in the A/D Line....... Ouch......Living through the Biden years.....more pain to come....
I'm beginning to think 2024, will also be bad......maybe 2025 will be a good year ???
Thanks for your fine work.....
https://youtu.be/SpRJeWKbE5Q?si=5zY0A9VQRiBL0Y-L
Economic Disconnects | ITK with Cathie Wood