(USTs higher, steeper, strong vol)while WE slept; "Neither a Lender Nor a Stockholder Be" -BG; "10-Year Yield Spike Doesn't Mean Stock Market Will Plummet"(StockCharts.com...?); UST supply +23% in '24
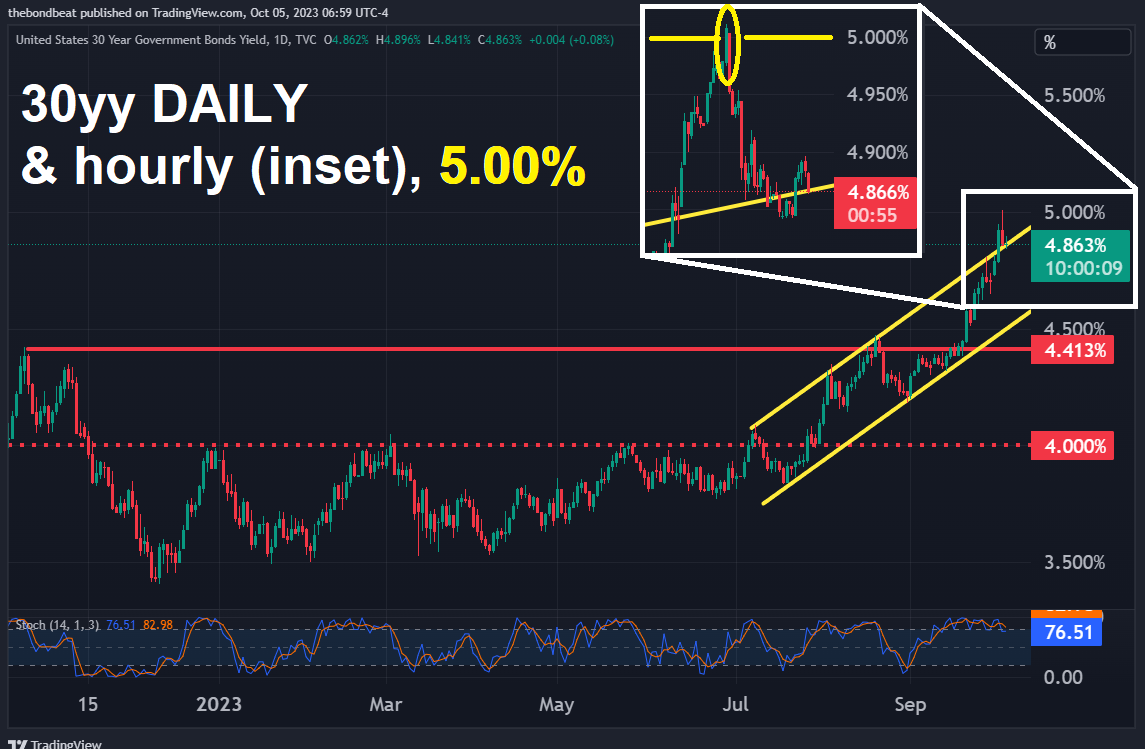
Good morning … First UP a look at the move many are talkin’ about round the water cooler this morning …
Momentum (stochastics, bottom panel) IS bullish and we’re only just now breaking back down into the UPTREND … read that however you’d like and as far as the data goes yesterday well … the ADP “unjolted” (Harkster) the markets yesterday … due to the fact that ADP hasn’t really ever been the precursor TO NFP it and its creators had hoped for, I’ll not spend too much time on IT (or the market’s reflex to it…). That said, there was an interesting factoid which may be of some worth,
ZH: ADP Employment Report Signals Weakest Labor Market Since Jan 2021
… Finally, as we noted recently, the ADP Research Institute, the research arm of the payroll processing firm, released a new report about a 'real-time way' to measure worker motivation. What they found is that a majority of workers aren't motivated, and this might impact long-term productivity.
Sliding motivation at work is yet another ominous sign 'Bidenomics' is a failure.
HERE is the actual report from the provider, ADP … for all the gory details in whatever context YOU might like. I’ll only offer that this report has rarely been of any use and this even AFTER the remake.
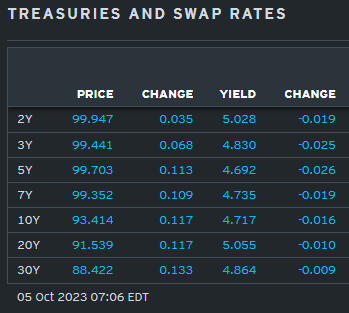
… here is a snapshot OF USTs as of 706a:
… HEREis what this shop says be behind the price action overnight…
… WHILE YOU SLEPT Treasuries are higher with the curve extending steeper off a little-changed long-end amid improving technical conditions (see below) in the front-end. DXY is lower (-0.12%) while front WTI futures continue their stair-dive (-2%, see attachment). Asian stocks were higher with China still out, EU and UK share markets are mostly higher while ES futures are showing -0.15% here at 7am. Our overnight US rates flows saw a continued firm tone to Treasuries during Asian hours amid good buying flows across the curve from real$ and fast$. In London's AM hours our desk reported a flip to better selling in the long-end (real$) with 5's outperforming on curve (2s5s10s cash 'fly -2.4bp). Overnight Treasury volume was about 90% of ave overall though Asian session volume was pretty solid (130% of ave), hinting that London's AM session was pretty quiet turnover-wise.
… Today's few attachments get to the heart of the matter. Our first shows SFRZ4 futures as it has been our thought that it will be the front-end that breaks their bear trend first, given the close proximity to incumbent bear trends
(NOT what I was expecting and so … moving right along …)
Who cares about any / ALL of this when EARL “PLUNGES” (FTs words not mine — see first link in IGM this morning) for biggest 1d drop in MORE than a year!! … and for some MORE of the news you can use » The Morning Hark - 5 Oct 2023 and IGMs Press Picks (who CONTINUES to be sportin’ that new, fresh look) in effort to to help weed thru the noise (some of which can be found over here at Finviz).
Before jumping in TO the Global Wall Street inbox, something I missed in the news yesterday and while it was asked 'Why Is a Soft Landing Unlikely?', Nick Timiraos offered his very own explanation,
WSJ: Bond Selloff Threatens Hopes for Economy’s Soft Landing Growth prospects and concern over government debt are driving long-term interest rates higher
… If the recent climb in borrowing costs—along with the accompanying slump in stock prices and the stronger dollar—is sustained, that could meaningfully slow the U.S. and global economies over the next year. The swiftness of the recent rise also increases the risk of financial-market breakdowns.
The likeliest causes appear to be a combination of expectations of better U.S. growth and concern that huge federal deficits are pressuring investors’ capacity to absorb so much debt …
AND we now return TO our regularly scheduled programming … moving from some of the news to some of THE VIEWS you might be able to use… here’s SOME of what Global Wall St is sayin’ (in a similar sorta way you’ll find content if you pay for ZH PREMIUM? askin’ for a friend as I never understood how they do it…)
ABNAmro - What is going on in bond markets? (inquiring minds wanna know)
A sharp jump in market interest rate expectations has led to a surge in US and EU rates
In this note, in Q&A format, we look at the drivers of the move so far and make an assessment of whether the rise in yields can be sustained
Recent macro data do not justify the move, and inflation expectations have been stable, suggesting the rise in yields is being driven by hawkish central bank guidance
Longer tenors have seen the biggest rises in yields, with the 10y US and German bond yield rising by about 40bp in just two weeks
Indeed, the market has been repricing higher policy rate not only for next year but also well beyond
Based on the Futures curves, the Fed fund and ECB rate are now expected to hold above 4% and 3% respectively
As such, volatility has moved along the yield curve to the longer-end due to the elevated uncertainty regarding the path of monetary policy and the economic outlook
However, we continue to expect rates to start to come down by year-end and throughout 2024, on the back of the economic slowdown and continued disinflation
Underpinning this view is our expectation for a significant rate cut cycle in 2024, with cuts continuing until rates return to more neutral levels
Furthermore, if the jump in yields continues at this pace, we would expect central bank officials begin to verbally push back against the tightening of financial conditions
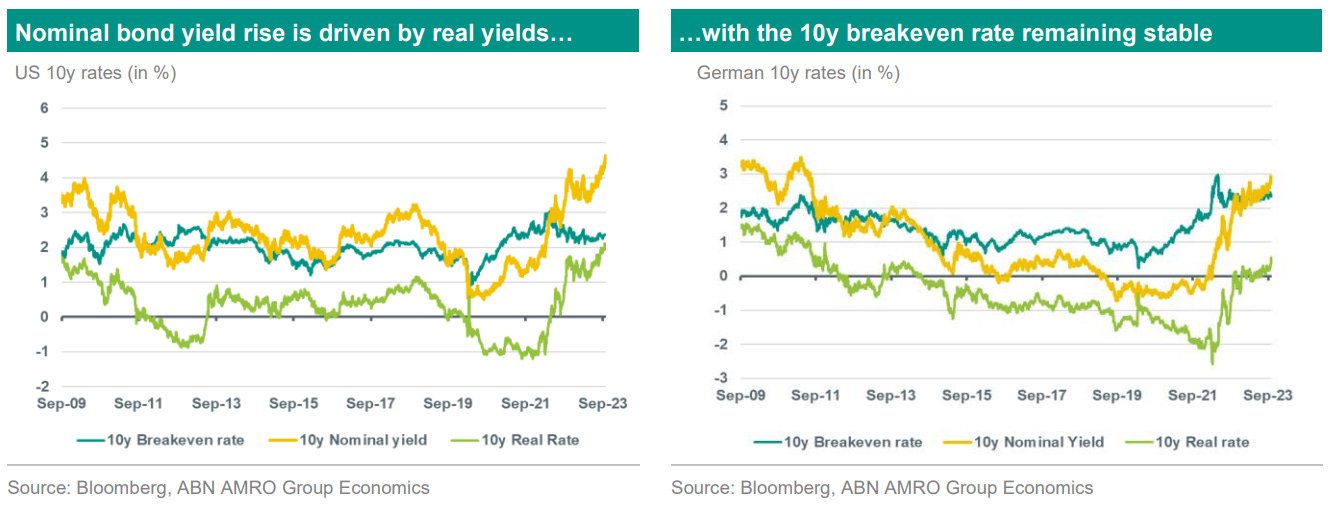
… We see three key reasons behind this surge in real yields. First, the rise could imply that the market’s neutral rate expectation has been rising, implying higher economic growth expectations as well. Thus, some argue that it would explain the economic resilience of the US economy despite the aggressive monetary policy tightening of the Fed. This first point clearly contrasts with our macroeconomic outlook discussed in the next section. In addition, the most recent Fed’s estimate of the neutral rate also contradicts that view. The second reasoning reflects more the scenario of structurally higher inflation which means central banks would have to keep (real) rates higher for longer to contain inflation in the long run
We tend to lean more on a third reason which is that the rise in real yields is being driven by the persistent hawkish tone of central bankers rather than by a significant change in the macroeconomic outlook…
ABNAmro - Global manufacturing: Still bottoming out
Global manufacturing PMI picks up slightly, but remains in contraction mode. Global components for input and output prices are rising, but stay well below peak levels.
Apollo - 23% Increase in Treasury Auction Sizes in 2024 (so the moves in rates completely justified then …?)
Treasury auction sizes will increase on average 23% in 2024 across the yield curve, see chart below. This forecast comes from the Treasury Borrowing Advisory Committee’s neutral issuance scenario.
The 37% increase in issuance of 3-year notes and the 28% increase in issuance of 5-year notes will in 2024 stress-test demand for Treasuries in the belly of the curve. In particular, if the Fed next year will start cutting rates and wants to soften financial conditions.
This dramatic growth in the supply of the risk-free asset is “pulling dollars away” from other fixed-income assets, including investment grade credit, as investors substitute away from spread products toward Treasuries.
With the ongoing significant increase in the supply of Treasuries, investors in credit markets need to spend some time on signs of demand and supply imbalances in the Treasury market.
The bottom line is that the world only saves a limited amount of dollars every year, and the significant growth in the size of the Treasury market is at risk in 2024 of crowding out demand for other types of fixed income.
Barclays - Thinking Macro: The beatings shall continue until... (they say ALL opinions are created equally and we KNOW some opinions are simply MORE equal than others … this may be one of ‘those’)
Despite the breathtaking sell-off in longer rates, we do not see a clear catalyst to stem the bleeding. Data are unlikely to weaken quickly or enough to help bonds, which suggests that risk assets have to keep falling for longer rates eventually find a bid.
Hitting a certain level of yields is not enough … The Fed cannot help the bond market … And then there's the demand side … So what could turn the tide? A continued risk-off
In the short term, we can think of one scenario where bonds rally materially. If risk assets fall sharply in the coming weeks, bonds will likely benefit from the portfolio effect. US equities have fallen about 5% over the past three months, as higher yields have finally started to result in multiple compression. But stocks are still up very comfortably for the year. And the magnitude of the bond sell-off has been so stunning that stocks are arguably more expensive than a month ago, from a valuation standpoint.
In our opinion, equities are still far from levels where bonds benefit from a lasting rally. Our equity analysts believe fair value on the S&P is still below spot, and those forecasts were made when bond yields were much lower. Admittedly, the fourth quarter is often strong for the stock market, especially with earnings due to start in a few weeks. But despite favorable seasonals, we believe that the eventual path to bonds' stabilizing lies through a further re-pricing lower of risk assets. Absent that, there is no sustained bond stabilization and, given how risk assets are finally responding to bonds, no stabilization in risk assets, either. We believe stocks have substantial room to re-price lower before bonds stabilize.
Bloomberg BNP US: Excess savings – a bit more runway but winding down (about that Q3 strength, again)
KEY MESSAGES
We now expect consumers will deplete excess savings in Q1 2024 rather than Q4 2023, on account of comprehensive revisions to the national accounts released 28 September.
For most lower and middle-income households, the era of excess savings has already come to an end, the Fed’s latest distributional data suggest.
Without excess savings, consumers face the prospect of running down ‘normal’ savings, increasing borrowing, or slowing spending growth.
We think consumers will ultimately be pressured to slow their spending growth as labor market conditions soften.
Our updated savings profile also impacts our forecast for GDP growth. We now see 3.5% q/q saar in Q3 (from 2.8% prior), but expect the economy to downshift to a 0.5% pace in Q4.
While a confluence of factors have contributed to the sharp rise in US yields in recent months, there is increased focus on the impact of the cheapest-to-deliver (CTD) switch risk in the US and TY futures contracts.
We believe that in a parallel shift of the US yield curve 25-30bp higher from current levels, both the US and TY futures could see another CTD switch, effectively leaving the market even longer duration.
The upshot is that in a further selloff, there may be fewer market participants able to buy the dip. And in more extreme scenarios, market participants may find themselves sufficiently overweight duration, resulting in even more selling of US Treasuries. As a result, we like expressing long rates views via the 3Y part of the curve, continuing to avoid the back-end for now.
CitiFX Techs - UST reversal indicators are not convincing (oh well, was nice while it lasted … 1d in a row …)
USTs: We don’t think reversal indicators overnight are convincing as recent reversal indicators have not fared well. And with NFP looming, we prefer to look to weekly developments and closes.
US 2y yields
Bearish outside days have not preceded meaningful down moves
Weekly reversal patterns do not dare much better
We prefer to watch 55-day MA which has held in Aug and Sep for support.
A weekly close below would initiate a 55-200 MA setup
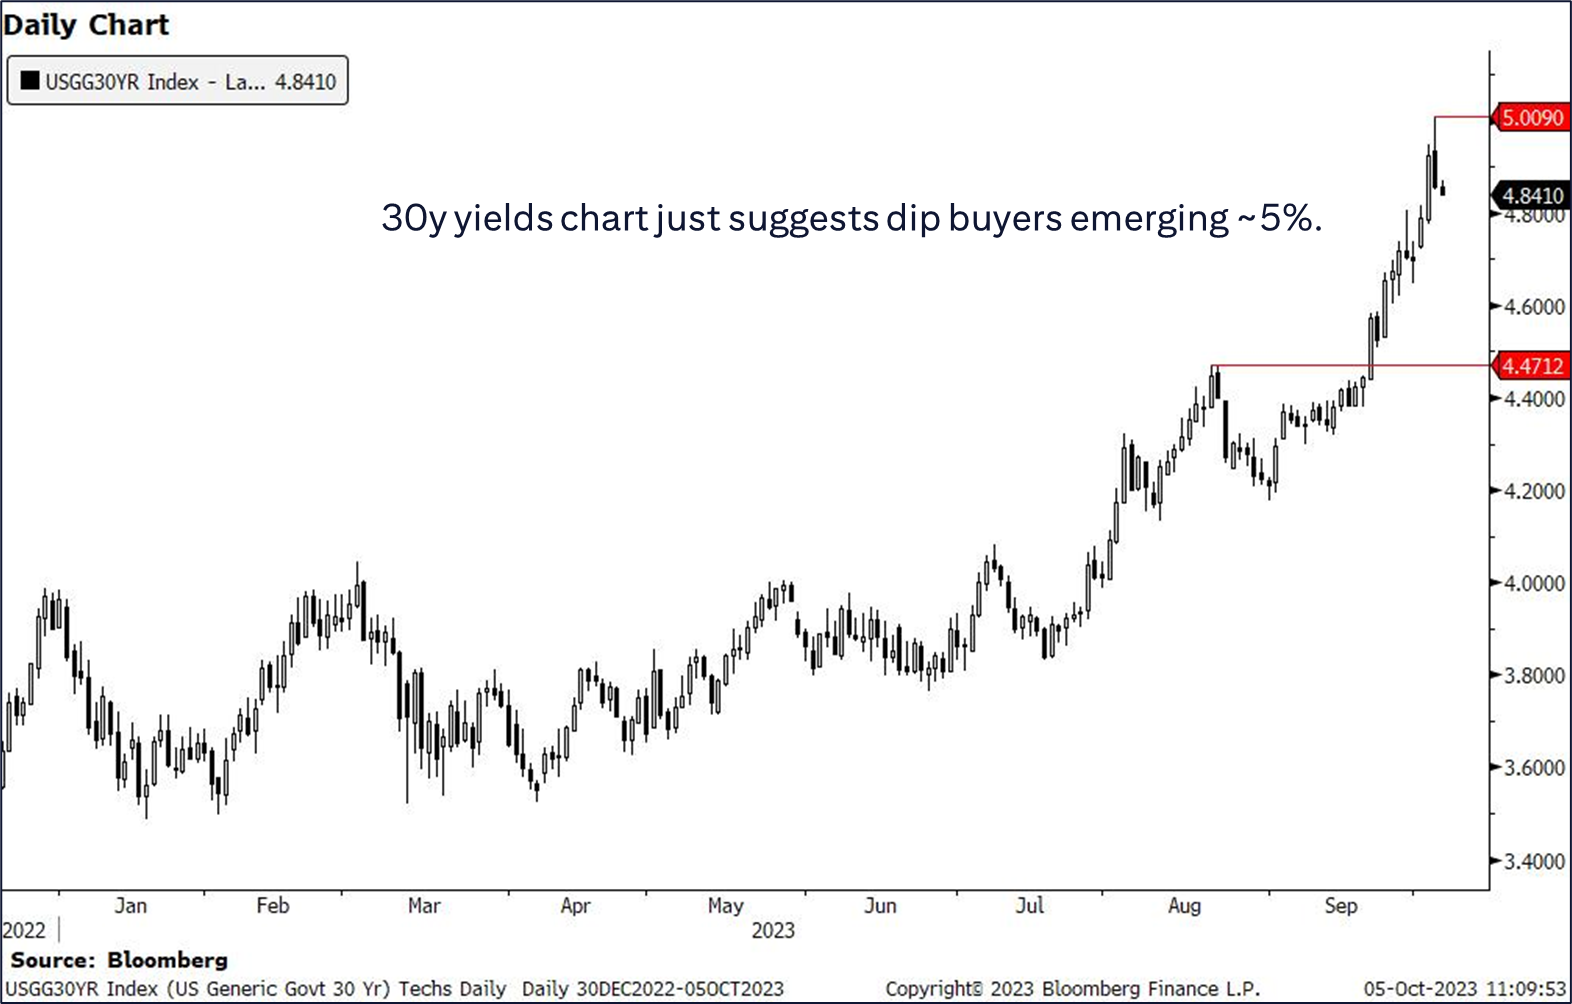
… US 30y yields
Again, the chart only suggests resistance at the psychologically significant 5% level
CitiFX Techs - Oil is on shaky footing (thank g-d…)
While there is room for near-term stabilization, weekly closes below key support levels could open >4% moves lower in Brent and WTI…
… Big picture. Our house view is still bearish. Citi Research’s Ed Morse continues to forecast Brent at ~$82 in Q4
DB - Early Morning Reid (just one excerpt here caught MY eye)
… Things looked very different an hour after we went to print yesterday. The bond rout had intensified at an alarming rate, which given recent moves is an impressive thing to say, especially given the time of the day. At this point, the 30yr Treasury yield surpassed 5%, whilst the 10yr Treasury yield hit an intraday high of 4.88%, which we haven’t seen since 8 August 2007, the day before BNP Paribas froze €1.6bn worth of funds due to issues among US subprime mortgages. That’s often taken to be one of the first tremors of the global financial crisis, so in some ways you could say the 10yr yield was finally back to levels seen prior to the GFC. But after reaching those highs in the European morning, we then had a sharp reversal of more than -10bps intraday, with the 10yr yield ending the session -6.3bps lower at 4.73%, which has been followed by a further -2.3bps fall overnight to 4.71% this morning. Meanwhile, 2yr yields (-9.8bps) saw their largest decline since late August. And 30yr yields closed at 4.86% after poking their head above 5% for the first time since 2007 for just a few minutes.
DB - CoTD: $70 trillion of losses?
… As the extreme end, the Institute of International Finance suggests that there was $307tn of global debt outstanding (face value) as of end H1 2023. We know that much of this debt isn’t publicly tradable as the Bloomberg Global Agg ‘only’ had a peak market value of nearly $70tn nearly two years ago. We know from the total return of the same index that we’re down around -23% from the peaks, also a couple of years ago…
… Nevertheless the scale of losses in debt markets are the largest in history in dollar terms and relative to GDP. Can the system absorb this without any further accidents?
BOTTOM LINE: According to the ADP report, private sector employment rose by 89k in September, 61k below consensus expectations. We left our nonfarm payroll forecast unchanged at +200k ahead of Friday’s release.
In the last few days, we have seen bonds sell off, then rally, and the oil price has suddenly plunged USD 5 per barrel. Equities have swung back and forth. What is going on? This, in short, is what happens when economists are not in charge.
Neither the Federal Reserve nor the European Central Bank has leaders who have set out a vision for policy. There is no sense of a long-term framework like Volcker’s monetarism, Yellen’s labor market focus, or Draghi’s “whatever it takes.” Today’s central bank leaders just react to the latest data point. Thus, rogue numbers can and do push expectations of policy back and forth—because investors fear weak leadership in central banks will respond to the latest shiny new number placed before them.
Professional stock investors know little about bonds and vice versa I suppose. Yours truly has to be included in that mix but that doesn’t stop me from trying. Here’s the topic for today’s Investment Outlook: How has the significant rise in U.S. (and global) interest rates affected the value of the stock market?
… As the updated Goldman Sachs chart shown below might suggest, S&P 500 forward P/E multiples have for the last 5 years been correlated to real 10 year Treasury yields with the exception of the last 12 months or so. There is a long-term logic for this. A P/E ratio turned upside down to E/P is really an earnings yield. One might commonsensically assume that if bond yields go up by 350 basis points that (everything else being equal) earnings yields (E/P) should follow somewhat. They did until the Fall of 2022 as the chart will show but not since. A plethora of explanations abound. The aforementioned strong economy, the bond market’s assumption that the Fed will lower yields quickly in 2024, and hopes for positive influences on productivity and earnings growth from AI are decent explanations. Everything else has not been equal during the 350 basis point rise in real 10 year Treasuries. Once the Fed stops and then lowers short-term rates, we’ve got a bull market optimists claim. Well not so fast.
Although models such as the Gordon dividend discount and my own Goldman Sacks chart from 2016-2021 would infer, if all else was equal, a rise of 350 basis points in 10 year real rates accompanied by a 350 basis point in E/P earnings yields would lower the market’s P/E ratio to 12X instead of the current 18X. That’s a huge difference!
Most analysts and hopefully you readers would agree with this mathematical logic but not its conclusion for now. I am with them and you. But still, a new bull market? Can AI and $2 trillion fiscal deficits going forward validate that “it’s different this time”? I’m suspicious. Unless Chair Powell and company can significantly lower real 10 year Treasury rates from 2.25%, investors may eventually realize that bonds are a better deal than clearly overvalued stocks headed into an economic slowdown/recession. Personally, I don’t believe Powell will be willing or able to lower short rates significantly in the face of a 3% inflation future. I’d pass on stocks and bonds in terms of future total returns. Best bets are arbitrage situations such as …
In any case, keep your eye on real (and nominal) 10 year Treasury rates. They need to come down a lot to validate existing forward P/E ratios. They may not.
Bloomberg (via ZH): Bond Heretics, Not Bond Vigilantes, Are Biggest Risk For Yields
Authored by Simon White, Bloomberg macro strategist,
The biggest medium-term risk for bonds is not from buyers demanding a lower price, but from multi-asset managers who see little need for holding much government debt at all, at any price.
Bond vigilantes are back in the spotlight.
The surge in US and global yields to the highest in more than a decade has prompted speculation that investors are seeking greater compensation to hold government debt as the inflation rate remains elevated and fiscal deficits swell.
Treasury yields are decoupling from usually reliable underlying drivers, such as the strength of manufacturing or the price ratio of copper to gold.
It’s the same thing with a fair value model that factors in oil, central-bank rates and the shape of the yield curve.
US 10-year yields at around 4.7% are now almost 50 basis points above the model’s value.
Term premium — essentially the difference between the yield and the expected short-term rate — has begun to accelerate higher, and is back to being positive in the US, pushing the yield curve steeper.
On longer-term bonds, term premium has been in secular decline over most of the last four decades, initially as inflation expectations were re-anchored after the stagflation of the 1970s.
It continued to fall as contained inflation flipped the stock-bond correlation to negative, making Treasuries an attractive hedge for stocks – through dampening portfolio volatility and increasing risk-adjusted returns – while also acting as a recession hedge.
Term premium was further depressed by quantitative easing.
But in today’s elevated inflation regime, the stock-bond correlation is positive again.
Treasuries are losing their efficacy as a portfolio hedge.
And their usefulness as a recession hedge is on shakier ground, as the next growth shock could quite conceivably be accompanied by an inflation shock, with stocks and bonds falling together.
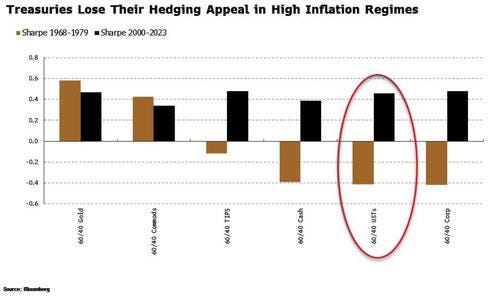
Over the last 20 years or so, the traditional 60/40-like portfolio — one that allocates 60% of money to stocks and 40% to bonds — has delivered positive risk-adjusted returns on a par with similar approaches using assets like commodities or gold instead of bonds.
But in the 1970s’ inflation regime, a 60/40 strategy with Treasuries did very poorly, both outright and versus other 60/40 portfolios.
Portfolios using the 60/40 approach, vol-targeting and risk-parity strategies own hundreds of billions if not trillions of dollars in Treasuries.
But if the very reasons for owning them – their portfolio-smoothing properties and recession protection – can no longer be taken for granted, managers may question owning many of them at all, no matter what the price.
In a world of high cash rates, owning more equities may end up looking more attractive – the return of TINA (There Is No Alternative), but with a vengeance (however ill-advised that may be).
There will always be demand for government debt, from households, banks and liability-matchers. But for a large constituency, owning USTs is a choice.
With non-believers, there’s no need for vigilantism, just a swift exit past the pews and out of the church of bonds – and even higher yields as a consequence.
HEDGOPIA - As S&P 500 Sits On Confluence Of Support, Pessimism Building In Options Market
After being under pressure for a couple of months, the S&P 500 has approached an area of potentially crucial support. This takes place even as pessimism is heavy in the options market.
From its July 27th high of 4607 through Tuesday’s low of 4216, the S&P 500 gave back 8.5 percent. Particularly since September 14th when it made a lower high (4512), coming on the heels of September 1st’s 4541, selling has been persistent – first losing the 50-day moving average and then horizontal support at 4320s.
Since the July high, the large cap index has been trading within a descending channel, and it is currently at the lower bound. This lines up with support at an ascending channel from last October when the S&P 500, along with other equity indices, bottomed. Plus, Tuesday’s low was not too far away from the 200-day (4204), which has not been breached since March 17th this year.
Equity bulls are clearly looking at a confluence of support, and this is happening at a time when fear is seeping into the market.
In the options market, the CBOE equity-only put-to-call ratio on Wednesday produced a reading of 1.11. A ratio of one tends to be rare. That said, the metric has remained elevated in recent weeks, as stocks came under pressure and as equity bears got more and more emboldened.
Since August 16th, there have been three plus-one readings in the put-to-call ratio – the other showing up on September 13th. In the 14 sessions between Wednesday and September 13th, there was one session of a low-0.60s reading; the rest were all in the 0.70s, 0.80s and 0.90s. And between August 16th and September 13th, there were 18 sessions, with only one session of a mid-0.50s reading; the rest were in the 0.60s, 0.70s, 0.80s and 0.90s, with three in the high-0.90s.
The point is, bears have amassed tons of puts. In the event the above-mentioned support does not give way on the S&P 500 – which is looking probable – these traders will be forced to unwind their trades, in turn acting as a tailwind for the S&P 500.
As things stand, the 10-day average of the ratio finished Wednesday at 0.846, which is the highest since January 11th this year. This is elevated territory. If past is prelude, unwinding is just a matter of time.
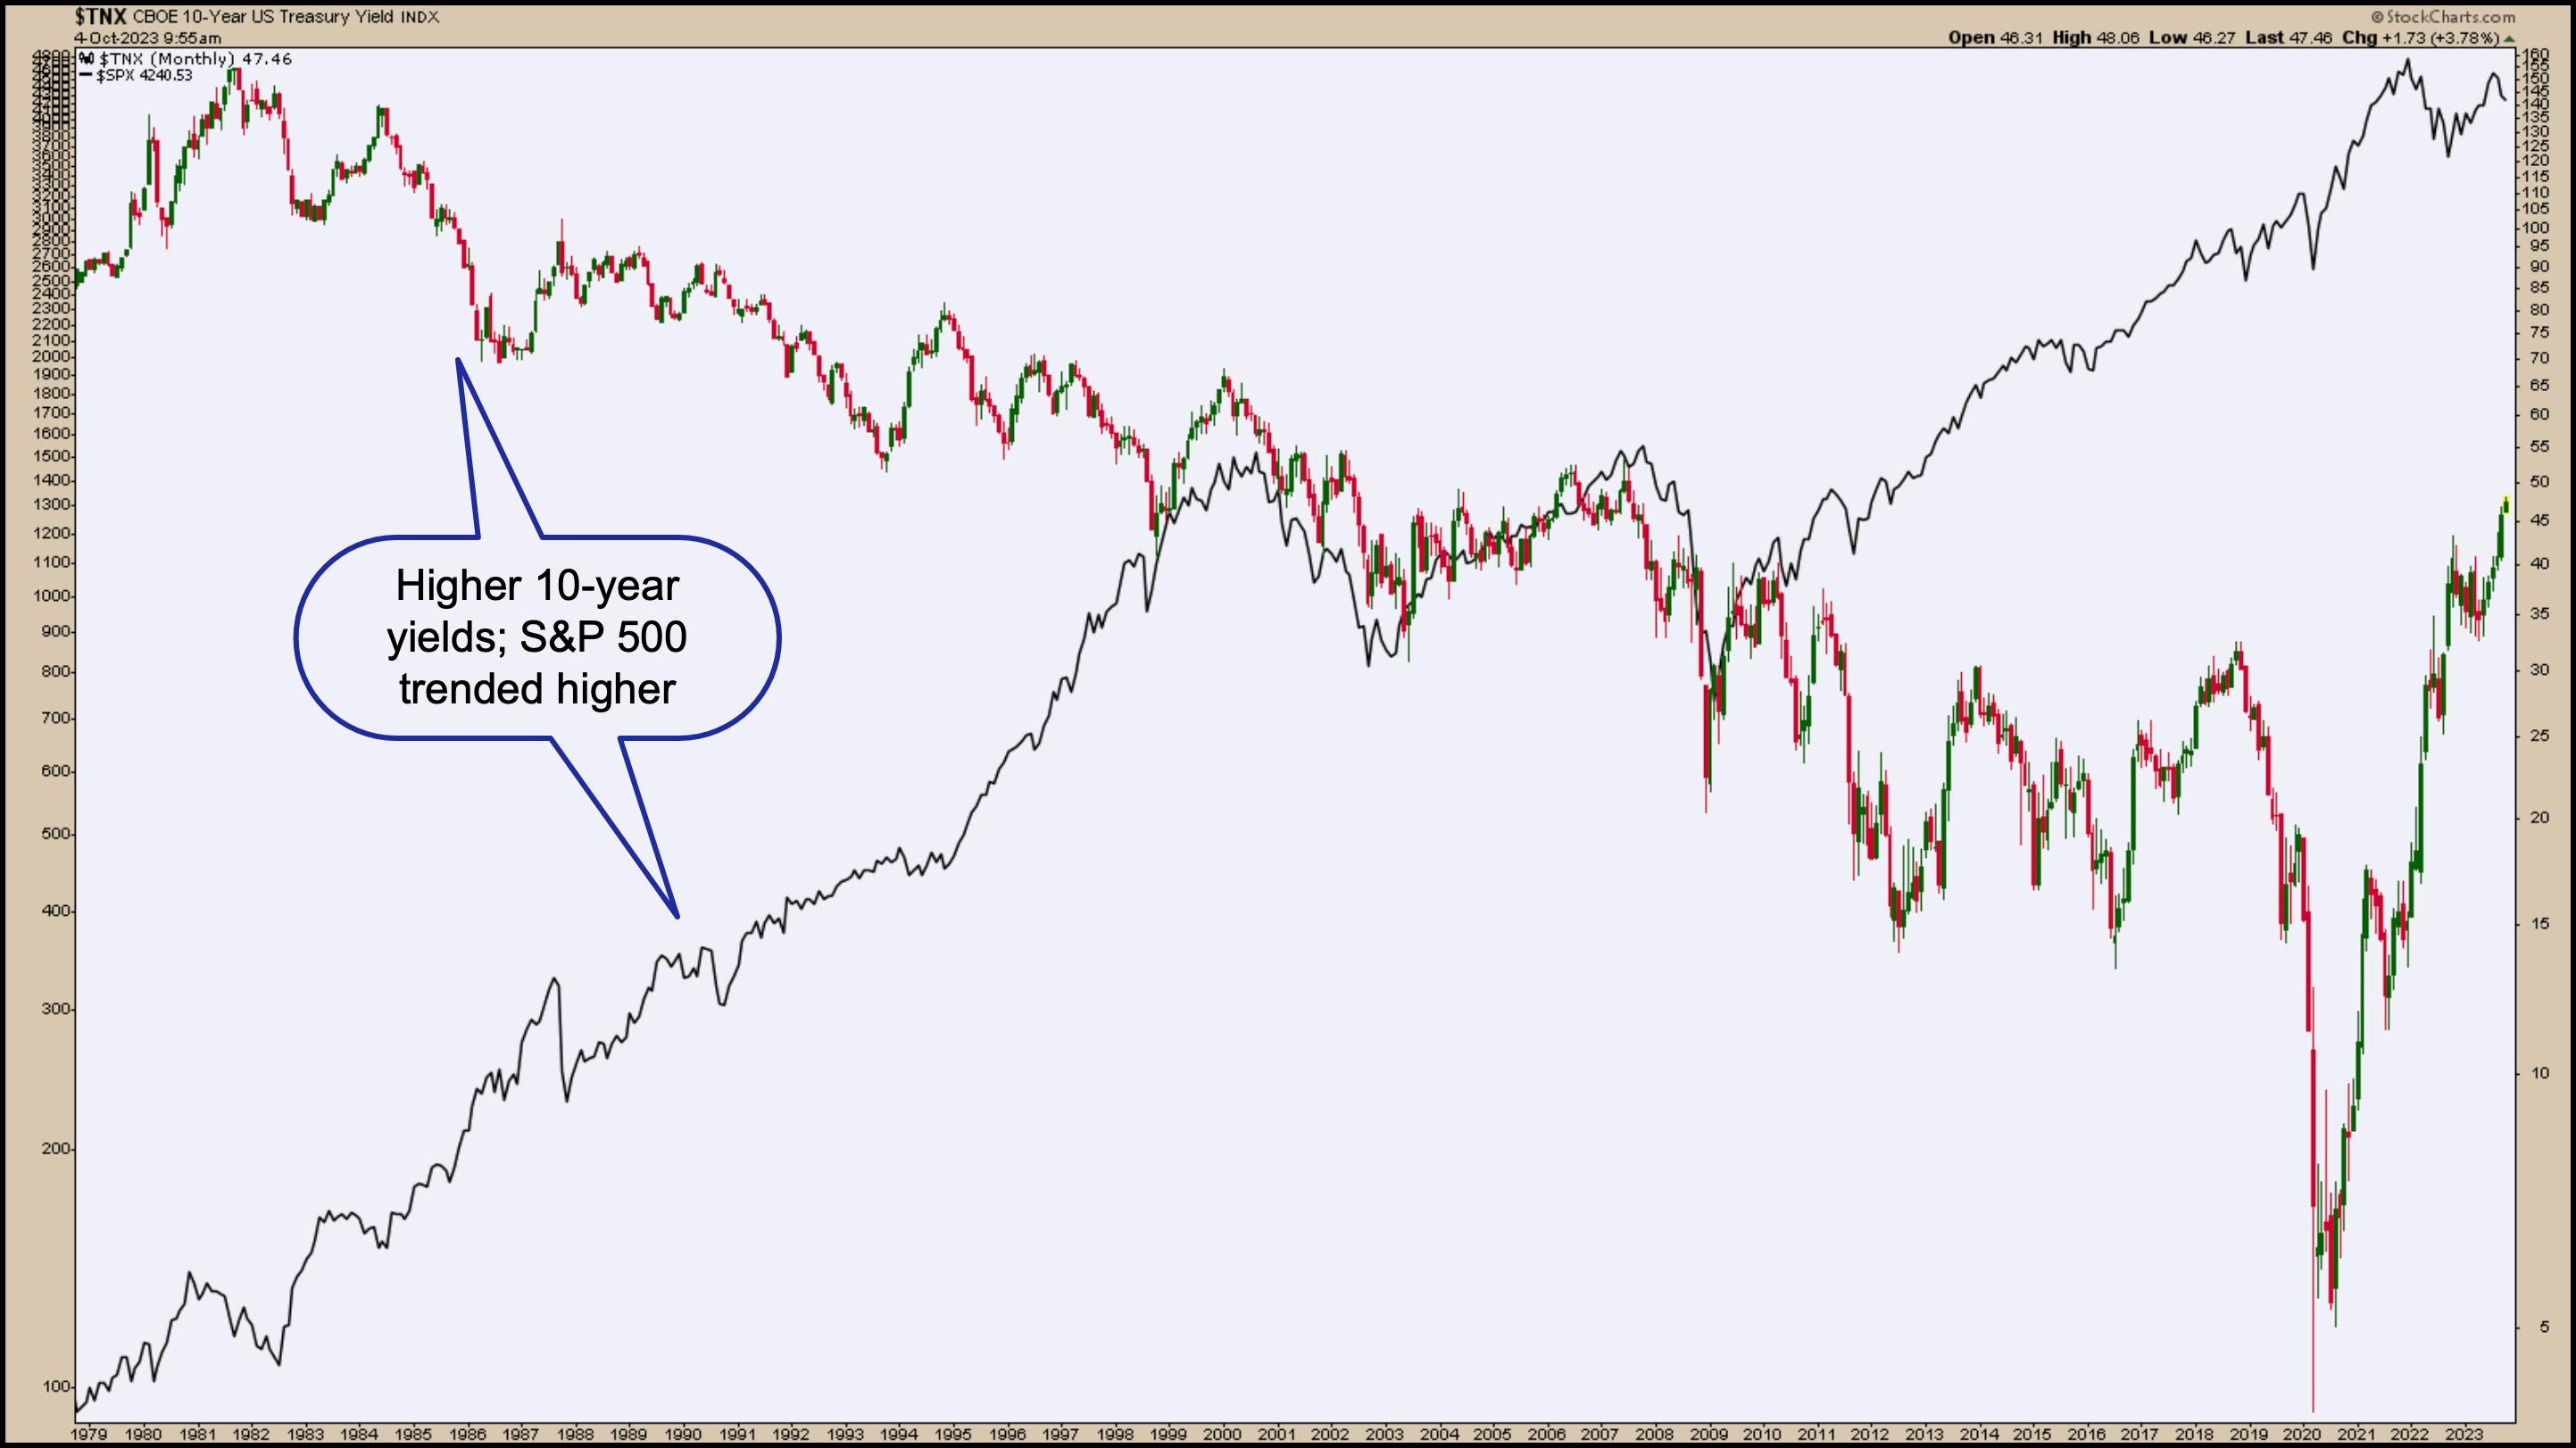
StockCharts.com - 10-Year Yield Spike Doesn't Mean Stock Market Will Plummet; You Need to See This Powerful Chart
Key Takeaways
Rising yields have wreaked havoc on equities but it's not necessarily a cause for worry
Growth stocks have performed well during high interest rate environments and are likely to do so again
The Bullish Percent Index can signal when a turnaround will occur
Chart 1: 10-YEAR US TREASURY YIELD INDEX VS. THE S&P 500. Higher interest rates don't necessarily mean that equities will fall. Between 1979 and 2000, interest rates were higher than now, yet equities rose.
… The Bottom Line
You don't want to miss out on the opportunity to pick up stocks at a value. Thus, when the stock market reverses and gains momentum, you want to get in the trend earlier rather than later. Be prepared with the stocks you'd like to add to your portfolio.
I don't at all understand the mechanics of it, but it simply CANNOT be a coincidence that on the same day Oil-EARL (can't help but use your cool oil moniker!) is down 5%, the US Debt grows by over 300B IN A SINGLE DAY. On pace to add another trillion within a month. My man in London Mario Ineco (YT Maneco64) said today Exchange Stabaliztion Fund....
"Sliding motivation at work is yet another ominous sign 'Bidenomics'", has a simple solution, just turn the dial up to "Ramming Speed!": https://www.youtube.com/watch?v=wX4SDd4Ym4I