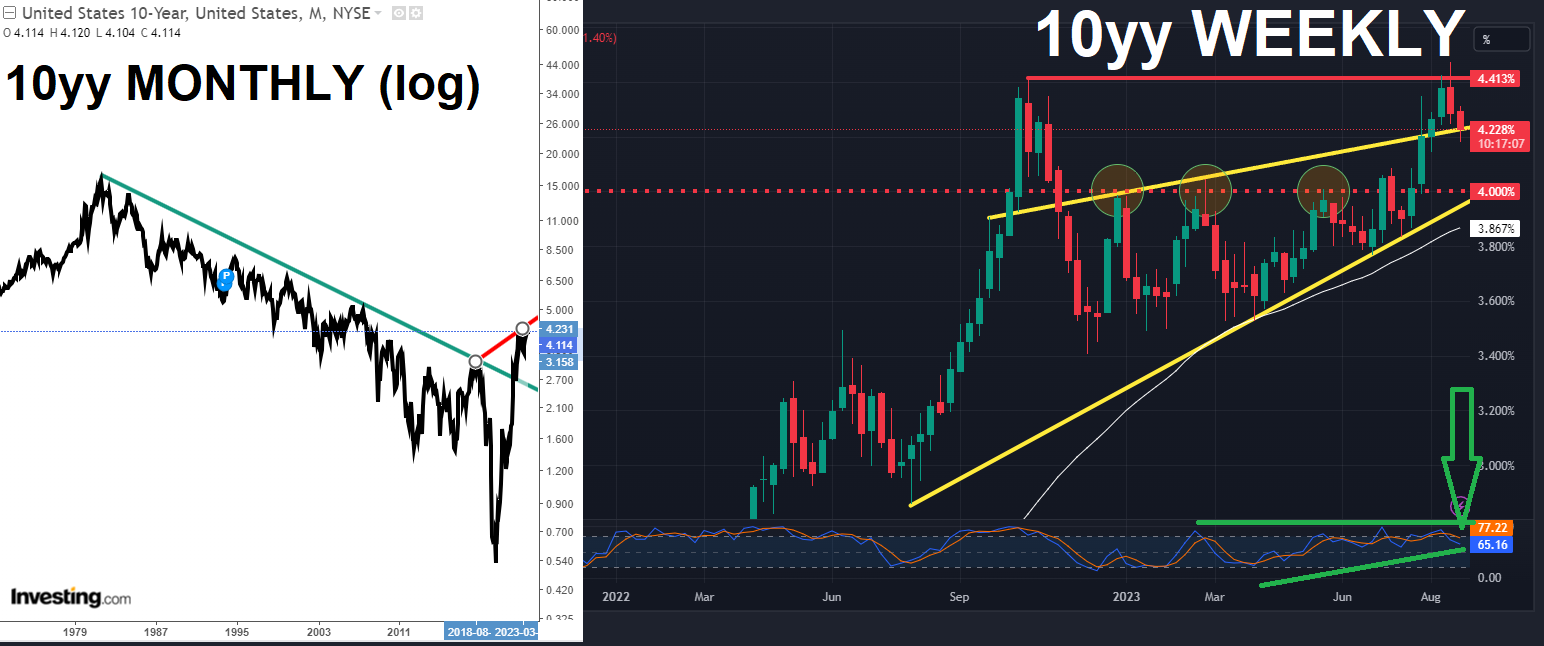
Good morning … in these last couple hours ahead of NFP we’re left to our own devices and to contemplate yields, stocks (scary seasonals upon us) and whatever is on tap for the holiday weekend just ahead … which typically begins about 845a … soon as data digested, “A team” will call in from The Hamptons or ‘down the shore’ to yell at the “B team” — don’t buy ANYTHING or BUY EVERYTHING you can … or INCREASE / decrease desk hedge, etc … the next few hours of boredom interrupted by just a few moments of shear panic, aside, a WEEKLY (and MONTHLY, log - inset)look at ‘screaming buy’ — aka the 10yy
MONTHLY LOG chart somewhat less compelling than weekly (more just below from some who are fare more capable than I) while the weekly chart DOES have the look of a POTENTIAL double top in / around the 4.40% level … Meanwhile, back at the ranch,
ZH: Fed's Favorite Inflation Indicator Jumps Higher In July, Wage Growth Slowed (this headline and set of data allowing one yesterday to see whatever they wanted / needed, i suppose making the aforementioned ‘conversations’ noted above all that much more funTERtaining to over-hear)
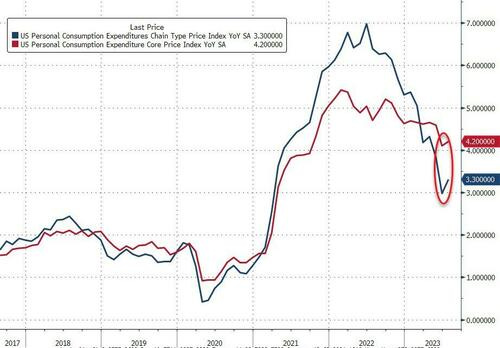
… One of The Fed's favorite inflation indicators - Core PCE Deflator - rose 4.2% YoY in July (as expected but higher than June's +4.1%). Headline PCE jumped up to +3.3% YoY (also as expected) - the biggest jump in YoY prints since June 2022...
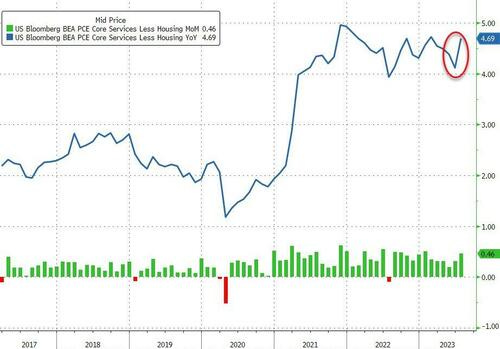
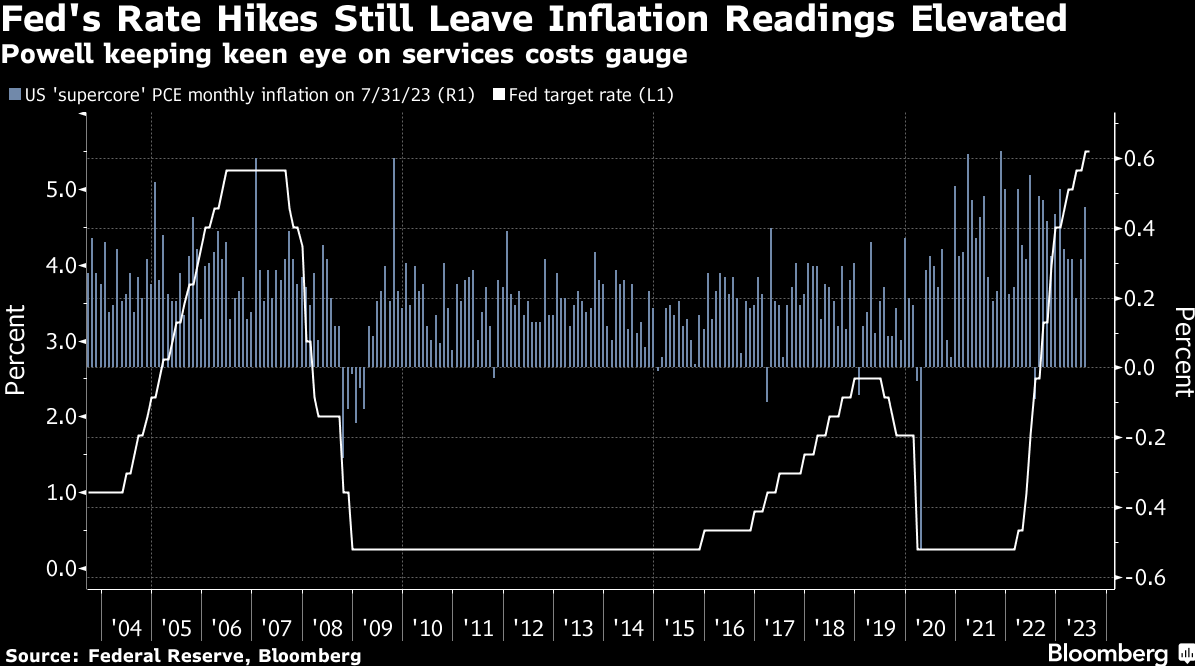
Even more focused, is the Fed's view on Services inflation ex-Shelter, and the PCE-equivalent shows that is very much stuck at high levels...
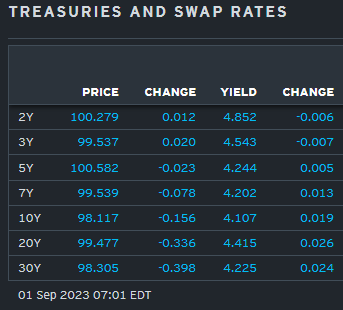
… here is a snapshot OF USTs as of 701a:
… HERE is what this shop says be behind the price action overnight…
… WHILE YOU SLEPT Treasuries are mixed with the curve pivoting steeper ahead of this morning's US data slate. DXY is little changed while front WTI futures are higher again (+1.25%- see attachment this morning). Asian stocks were mostly higher after China's easing measures (see above), EU and UK share markets are mixed-higher while ES futures are showing +0.3% here at 6:30am. Our overnight US rates flows saw 2-way action in the long-end from real$ amid a holding pattern during their hours. We published too early to get color on London's AM flows but overnight Treasury volume was roughly 85% of average overall.
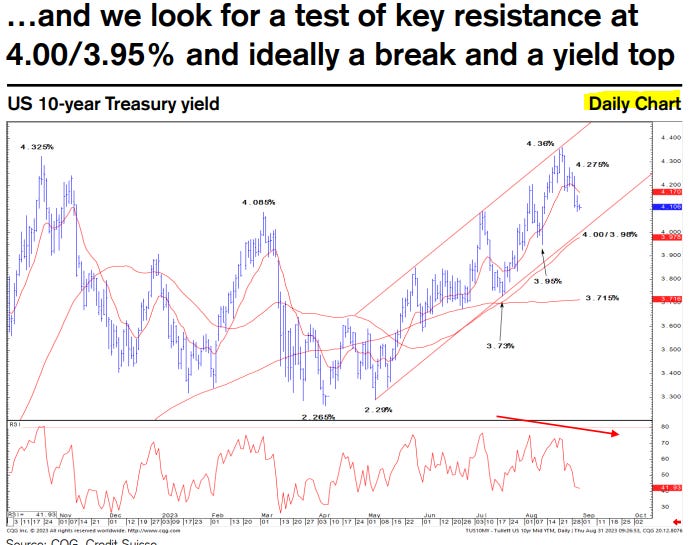
… Yesterday we illustrated and discussed how tactical conditions remain bond favorable and how we were still missing the kind of longer-term momentum signals that might indicate sustainability for the very recent bull trend. Well, we could see such signals confirmed as soon as today's close-- barring any surprisingly strong readings in this morning's US data. Our first attachment illustrates this potential well as we show the weekly chart of Treasury 10yrs and its associated momentum (14,3,3 Slow Stochastics for those keeping score) in the lower panel. If you squint you can see in the lower panel that weekly momentum has flipped bullishly from an 'oversold' (>80) reading after the momentum study guided consistently toward higher rates since mid-May. Such a flip, if confirmed at today's weekly close, would be another hint of a sustainable bullish trend reversal and further back-up the idea that the Double Top seen near 4.335% may be THE move peak for this year at least. A close today near spot (4.10%), or certainly lower, will do the trick here.
THEIR visuals far better than MINE and so, we’ll watch 10s vs 4.10 on CLOSE … and for some MORE of the news you can use » The Morning Hark - 1 Sept 2023 — check it out as it is an excellent effort to to help weed thru the noise (some of which can be found over here at Finviz).
From some of the news to some of THE VIEWS you might be able to use… here’s SOME of what Global Wall St is sayin’ …
Barcap - July PCE provides stronger tailwinds for consumer spending in Q3 (hard to refute but cannot help think ‘bout Core PCE in relation TO target and a sticky ‘flation means what to Fed and expectations? an offset TO spending? OR about savings rate … can spending go on forever?)
Nominal personal income increased 0.2% m/m in July, alongside an 0.8% m/m increase in consumer spending. Today's data highlight the continued momentum of spending in Q3, setting it up for strong growth. In addition, the saving rate declined 0.8pp alongside further drawdowns of excess savings.
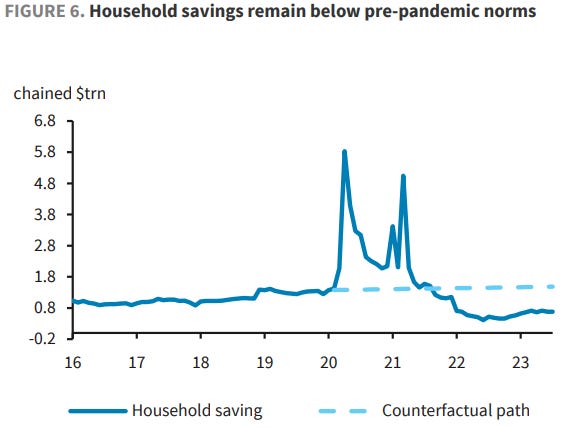
… The saving rate dropped in July and remains well below pre-pandemic levels, suggesting that households continue to save less to supplement spending needs. July's saving rate was down 0.8pp, to 3.5%, with spending greatly outpacing disposable income. This brings the saving rate back to where it stood in November 2022. This rate is well below the 7-9% range that prevailed prior to the pandemic, signaling that consumers continue to save less in order to supplement spending, likely drawing comfort from the stock of excess savings accumulated during the pandemic. We do not think this will be sustainable in the long run and expect some payback in the saving rate in future months.
… Our estimates of excess savings declined again after July's personal income and spending data
Core PCE price pressures in July were broadly apace with June. However, the underlying dynamics were vastly different, with core services ex housing inflation accelerating sharply, to 0.5% m/m. On balance, the data suggest that progress on lowering inflation has been slower than what the CPI data have recently indicated.
… We maintain our call for one more 25bp hike this year, at the November FOMC meeting.
Bespoke- September Seasonals (last 100yrs caught my eye … one year in a row NOT a pattern BUT …)
We do quite a bit of seasonality analysis as part of the "fusion" approach we take to covering markets. Here's a pretty basic seasonality stat: September has historically been a weak month.
In the graphic below, we show the Dow 30's (DJIA) average percentage change by month over the last 100, 50, and 20 years. As you can see, September is the only month that has seen the Dow average declines over all three time frames. Over the last 100 years, the Dow has only been positive in September 40% of the time. No other month has been negative more than it has been positive.
Once we get past September, though, seasonality turns much more positive. Over the last 20 years, the Dow has averaged a gain of 1% or more in each of October, November, and December.
August has been a rough month for financial markets, and just 12 of the 38 non-currency assets we track were in positive territory over the month. Several factors lie behind that, including the prospect of interest rates remaining higher for longer, and the 10yr US Treasury yield reached its highest level of this cycle so far. Alongside that, there’s been a further softening in the economic data, particularly in Europe and China, which has led to growing concern about the near-term outlook. To be fair though, we did see a recovery over the last week of the month, meaning that August just managed to beat February's performance, when only 11 of the assets we track were positive.
FirstTrust- Data Watch - Personal Income Rose 0.2% in July
Income and spending started the back half of 2023 on a healthy note, but consumer strength will also keep the Fed on guard. The best news in today’s report was that incomes rose 0.2% in July and are up 4.6% in the last year, led by gains in private-sector wages & salaries (+0.4% for the month and up 4.8% year-to-year). Growth in consumer spending outpaced incomes in July, with a pickup in spending across all major categories…On the inflation front, PCE prices – the Federal Reserve’s preferred measure of inflation – rose 0.2% in July, pushing the twelve-month comparison up to 3.3%. Look for another upward move for August given the recent spike in oil prices. “Core” inflation, which excludes food and energy, is up 4.2% versus a year ago.Note that the Fed is now closely watching a subset of inflation dubbed the “Super Core,” which is services only (no goods), excluding food, energy, and housing. That measure rose 0.5% in July and is up 4.7% versus a year ago (down a mere 0.2% from the 4.9% peak in November 2021).Inflation continues to take a toll on the economy, which is also feeling more of the effects of the decline in the money supply over the past year. The Fed’s fight is not over, and there is plenty of room to stumble before crossing the finish line…
Goldilocks - August Payrolls Preview (ink will not even be dry before one has to redraw the goalposts, rewrite the narratives …)
We estimate nonfarm payrolls rose by 149k in August (mom sa), below consensus of +170k. Big Data indicators indicate solid but generally slowing job growth, and August payrolls have exhibited a consistent negative bias in the initial prints (we assume a 40k headwind). Additionally, our forecast embeds a 26k one-time drag from the combination of Hollywood worker strikes (-18k) and Yellow trucking layoffs (-8k).
We estimate that the unemployment rate was unchanged at 3.5%—in line with consensus—reflecting a modest rise in household employment and unchanged labor force participation (at 62.6%). We estimate a 0.20% increase in average hourly earnings (mom sa) that lowers the year-on-year rate to 4.25%—below consensus of 0.3% and 4.3%, respectively—reflecting waning wage pressures and negative calendar effects (the latter worth -5bps, on our estimates).
BOTTOM LINE: Personal income increased by less than expected and personal spending increased by more than expected in July. The saving rate declined by 0.8pp to 3.5%. The July core PCE price index rose by 0.22% month over month and the year-over-year rate increased to 4.24%, in line with consensus expectations. Initial jobless claims declined by 4k to 228k, against consensus expectations for a slight increase. We boosted our Q3 GDP tracking estimate by one tenth to +2.8% (qoq ar). Our Q3 domestic final sales growth forecast stands at 2.7%.
ING - US spending surges, but it’s not sustainable (been thinking about ‘something’ breaking for awhile … seems like that is very common place thought process but to this day, ‘flation … the Fed fav look … well, seems to be quite sticky, making ME question the idea of 10s a ‘screaming buy’)
US consumer spending is on track to drive third quarter GDP growth of perhaps 3-3.5%. However, this is not sustainable. American consumers are running down savings and using their credit cards to finance a large proportion of this. With financial stresses becoming more apparent and student loan repayments restarting, a correction is coming
LPL: Slightly Scary September Seasonals for Stocks (worry but not too much, be happy, and always, ALWAYS buy stocks)
… August finishing in the red will break a five-month winning streak for the S&P 500, the longest such run since we saw seven up months in a row from February to August 2021 that was broken itself by a scary September 4.8% pullback. These strong spring to summer upticks have gone some way to dispelling the “Sell in May and go away” stock market cliché (as we explored earlier this year here), but September has been doing its best to restore credibility to this adage with the last three Septembers all down, with an average decline of 6% during the month. Dragged down by the poor September showing for stocks, the August-September timeframe has also been the weakest two-month period for stocks over all time periods since 1950 and the last five, 10, and 20 year periods.
The good news is that historically stocks have rebounded from a weak September with a fairly strong October. In fact, the October-November two-month period is the strongest of all the monthly pairings over the past five and 10 years and is second strongest over 20 years and all periods back to 1950.
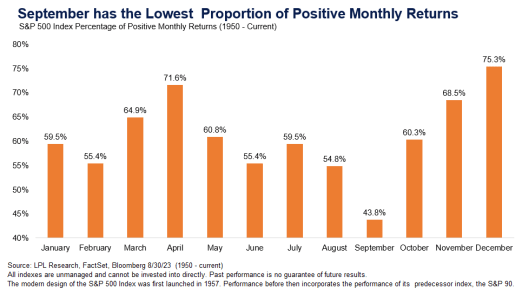
Taking a look at this from a slightly different angle, based on the proportion of positive S&P 500 monthly gains (going back to 1950), September doesn’t fare any better – it has been by far the weakest month of the year. Only 44% of the 73 Septembers since 1950 have ended in the green, with February having the next fewest at just over 55%. October’s value at 61% positive is much closer to the long-term average of all months, before the strong seasonals of November and December come into play.
…In summary, the immediate seasonal setup for September is weak, but longer-term data around the stage of the presidential cycle is more positive, as are the stronger returns that the final quarter of the year often bring. This mixed short-term outlook maintains support for our slight preference for fixed income over equities in our recommended tactical asset allocation (TAA) as fixed income valuations remain relatively favorable to equities (as exhibited by the negative equity risk premium that we wrote about here yesterday). We continue to see this as a reason to temper enthusiasm for equities, but not to be bearish, remaining neutral equities. We source the slight fixed income overweight from cash, relative to appropriate benchmarks.
It is US employment report Friday. This is your monthly reminder that average hourly earnings are not wages, and certainly not wage costs. The averaging process makes this data sensitive to changes in the composition of the workforce. The central story of the US labor market today is of a society getting over a collective mid-life crisis.
The pandemic meant that a lot of people were sitting at home, rethinking their life choices. When life resumed lots of people decided to change jobs (especially the “temporarily unemployed”). This increased churn in the labor force (showing up as increased vacancies), and caused employers to complain about the increased hassles of having to hire people. Now things are settling down, and people are staying with their employers. Job stability and job security help stabilize middle-income consumer spending, supporting the softer landing scenario.
China has been drip-feeding support to the economy. There is both support and stimulus—for instance, lowering mortgage rates for existing borrowers (supporting spending power) and cutting deposits for homebuyers (more a stimulus). Overnight, the People’s Bank of China changed foreign exchange reserve requirements to try and support the currency.
There are European and US businesses sentiment polls. The relationship of sentiment to reality has become more strained.
Real personal spending rose at a robust clip in July, and we hit pause on the downward trajectory of inflation—a recipe that keeps the heat turned up on the Fed. But we don't expect this pace of consumption to be sustainable, and volatile factors and base effects explain some of the rise in inflation.
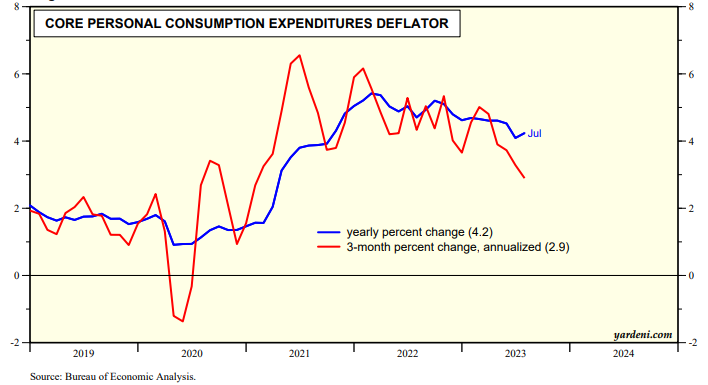
Yardeni - PCED Inflation Rate Still On Moderating Course (apparently you don’t need a Terminal to economically workbench data … with all due respect TO Ed bond VIGILANTE Yardeni … YoY almost as valid a proxy for ‘flation as is 3mo annualized? better yet, lets go with EXPERIENCED inflation — fill up tank(s) this weekend as well as the fridge and report back AFTER a true accounting of Labor Day cookout?)
Both the headline and core PCED inflation rates rose 0.2% m/m in July. Fed Chair Jerome Powell anticipated that they would be moderate as they were in June in his Jackson Hole speech on Friday of last week. However, he said that two consecutive months of such moderation aren't enough. He wants to see inflation drop closer to the Fed's 2.0% target on a y/y basis. The headline and core PCED inflation rates were 3.3% and 4.2% on a y/y basis during July. He is focusing on the core rate, which by the way rose at just an annualized 2.9% rate over the past three months (chart).
STOP THE PRESSES: July's PCED was boosted by an odd 7.4% m/m jump in portfolio management fees. While it only accounted for 1.62% of consumer spending last month, it added 0.12 to the monthly increase. That's more than half! This item is not shown as a separate category in the CPI, but it did also show up in the PPI as a 7.6% m/m increase.
AND a couple / few links from the intertubes which hold some funTERtainment value at least in MY humble opinion (which I realize you didn’t ask for — but then again, hey, you signed up for this… :))
Bloomberg’s 5 things to know (Asiaversion details “SUPER CORE” … NOT to the rescue but rather something likely on Feds radar screen … a brick in the wall of worry, perhaps)
… Bond investors remain braced for the possibility of more short-term pain even after key US data out Thursday showed cooler inflation. For one thing, the PCE measures also revealed a revival in consumer spending. That raises hopes for a soft landing, something that would hurt those who have piled in to longer-dated Treasuries on expectations of a recession. It is also likely to make the Federal Reserve more willing to lean toward further increases in interest rates to ensure that inflation comes down in a sustainable fashion.
Underscoring the potential for fresh Fed hawkishness was the way that the so-called “supercore” services inflation measure — a gauge excluding housing and energy that’s closely watched by Chairman Jerome Powell and other policymakers — jumped by the most on a monthly basis since the start of this year. Treasuries are heading for their best week since mid-July, but that may just make traders all the more edgy going into Friday’s payrolls report.
Bloomberg via ZH: 'Bad News Is Good News' Juice For Stocks Might Soon Run Out (topical given so much ink spilled as we ‘meet the new narrative, same as the old narrative’ where BAD = GOOD … Simon raisin’ point might just be ‘bout done…)
Authored by Simon White, Bloomberg macro strategist,
Stocks’ rally in response to bad economic news might be short lived as there is plenty of room to catch down to burgeoning recession risks, while option-market dynamics create upside resistance and more instability.
Tuesday’s weaker-than-expected JOLTS and consumer confidence data sent bond yields lower across the curve by 8-10 bps. Stocks, in time-honored fashion, took them as a reason for celebration and promptly rallied.
Two volatile data-points are not reason alone to believe a recession is a shoo-in or imminent.
However, they do fit a narrative of an economy that has several recessionary signs and is slowing. More importantly, they highlight that the gap between the likelihood the market ascribes to a recession and the probability implied by the data has become quite large, meaning a downturn would be that more impactful on asset prices.
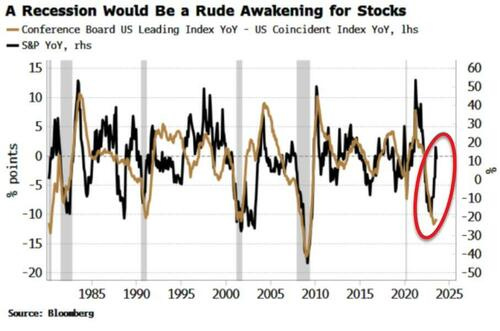
Stocks have been defying the very negative message from leading economic data for some time now.
The chart below shows the large divergence between the S&P and the ratio of the Conference Board’s Leading and Coincident Indexes. This also demonstrates that stocks have not insignificant potential downside if a recession suddenly looks more likely. (And when they happen, they tend to happen quickly.)
Stocks are also likely to run up against resistance from volatility trading.
The S&P rallied Tuesday but hit resistance at 4,500.
This is not uncoincidentally where there is a “call wall,” i.e. the strike where there is there is the most amount of calls outstanding. Option dealers have to sell at the strike to dynamically hedge.
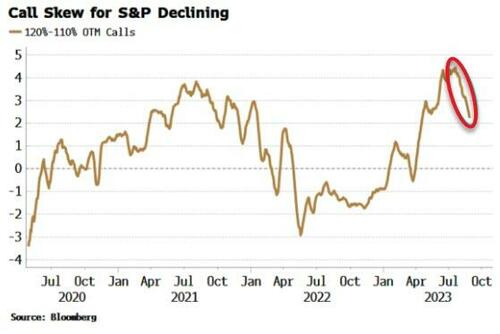
We could break through the wall, but the more fevered option trading we have seen in recent months – fueling the market’s rally – is dying down. Call skew became elevated, but is now clearly rolling over.
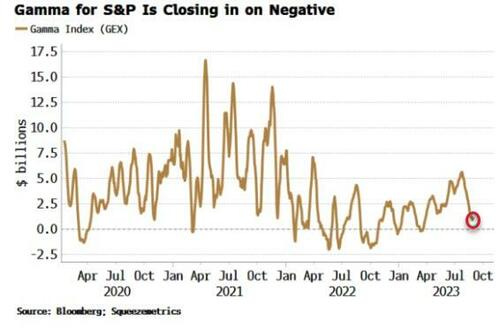
As a result gamma has been falling fast. On some banks’ estimates it is already negative, while Squeezemetrics’ Gamma Index has fallen quite rapidly and is now close to negative territory.
Negative gamma results in a more unstable market, with downside bias as option dealers’ short put-inventory becomes closer to the money.
With low volatility, more instability, and pricing that is not expectant of a near-term recession, risks are mounting for equities.
WolfST: “Core Services” Inflation Jumps to 2nd Worst since 1985, “Non-Housing Services” Are Red Hot. Fed’s Job Far from Done (food for thought)
AND for those of us visual learners and desiring a chart of the front-end (rather than yesterday’s infographics on 5s and 10s)
CitiFX - Chart of the Day: 2yr yield at pivotal level (noting 55dMA as level to watch)
US 2yr Yields: Following the much weaker than expected JOLTS and Conference Board prints, it is now hovering above its 55-day MA (4.86%). This is due to investors thinking the FED is at or very near peak rate policy given the loosening signs in the labor market, cpi, and economy.
Given that (1) 2yr yields have been above the 55-day MA for over 3 months and (2) that there exists a significant gap between the 55-day MA and the 200-day MA, there is a danger of a potential 55-200 day MA set-up.
Therefore, IF 2s close below their 55-day MA (preferably on a weekly close) then this set-up would materialize. This suggests a target at the 200-day MA (currently at ~4.45%).
With the US Payrolls report fast approaching our focus remains very much centred on Bond Yields, both in the US and globally. Indeed, the 10yr US Bond managed to hold long-term support at 4.24/4.405% post Jackson Hole as looked for and our bias remains to look for an attempt to establish a yield top. Key remains resistance from the 55-day average, uptrend from May and August low at 4.00/3.95%, a close below which is needed to see a yield top confirmed to reinforce our view for a test of resistance next at the 200-day average, currently at 3.715%.
10yr US Inflation Breakevens are also falling again, and we maintain the view the lengthy sideways ranging is still more likely a large topping process. As previously and regularly stated we need to see a break below key support at 212/208bps to confirm a major top but if this can be achieved, we believe this should clear the way for a potentially significant fall in US inflation expectations.
10yr US Real Yields still worryingly though hold a large bearish continuation pattern and need to see a break of resistance at 1.68/1.57% to see this negated.
10yr German Bond Yields below 1.45/1.44% would be seen to mark the completion of a near-term top…
…and 10yr UK Bond Yields are seen on course to test their key resistance at 4.19/4.145%, a break of which would similarly see a yield top established.
CS Global Risk Appetite maintains a top to suggest we should see further outperformance by “safe” assets, ideally lower bond yields.
Please note the House View has Global Government Bonds as most preferred on a 12-month horizon.
US CDX HY & IG Credit Spreads have held key trend and price supports and have tightened sharply again, turning the spotlight back on major resistance at 400bps and 62/59bps respectively.
Hope to have a fresh sellside update post OP of the NFP situation (but with holiday upon us this might have to wait til NEXT WEEK?) but before I go, as it IS September, which we all know is,
Investing DOT COM: Historically Weak Month of September May Test U.S. Stock Rally As Powell Hints At Higher Rates!