… Rare anti-government unrest across China's cities over the weekend has unnerved world markets, weakening crude oil prices and adding fresh political risks to a fragile year-end.
… HEREis what this shop says be behind the price action overnight…
… WHILE YOU SLEPT Treasuries are mixed and off of earlier highs with the curve pivoting flatter this morning as German bunds and peripheral yields add pressure to Treasury prices amid concerns about civil unrest in China. DXY is lower (-0.5%) while front WTI futures have extended their recent losses (-3.25%). Asian stocks were mostly lower, EU and UK share markets are all in the red (SX5E - 0.8%) while ES futures are showing -0.8% here at 6:55am. Our overnight US rates flows saw better buying in intermediates during the Asian session that pushed 10's to a new move low of 3.62%. But during London's AM hours, the flow reversed to HF's selling Treasuries as they outperformed EGB's this morning. Overnight Treasury volume was ~125% of average overall with 2's (64%) seeing relatively little turnover while 5's (148%) saw the highest relative average turnover.
… For the short-term, the daily chart of 5yrs highlights how they're going into Powell and the rest of this week's data looking locally overbought (lower panel) while still respecting range resistance derived by the early October rate low near 3.77% (equiv resistance in 1y1y rate near 3.90%). Simply, this morning's rate level and set-up suggests that it's an inopportune time to add to tactical longs near presumed resistance and amid the near-term 'overbought' condition.
That said, the weekly chart of Tsy 5yrs still looks notably bullish (note the bullish divergence confirmed and drawn in; medium-term momentum still aims clearly lower). Moreover, the textbooks say that when faced with signal conflict across timeframes... the observer should always put most weight on the longer-term signals. So summing the first two attachments leads to thoughts that A) the move peak in 5y yields may be in, B) 5's may now be in a sustainable bull phase with a growing risk of a return to 3.00% or thereabouts and C) short-term positioning appears long near resistance where a multi-session sell-off that corrects the positioning imbalance may be needed to blow the froth off.
Zooming out further to the monthly chart of Tsy 5yrs and what stands out here is the recent rejection of 2006-2007 range support near 4.37% and the deep 'oversold' condition that has lingered nearly all year. The monthly momentum set-up still looks late 2018-like to us but a sharp rally on Wednesday may be needed to confirm a flip in the momentum oscillator into favoring a new, macro bull phase at month-end. For now, all one can say is that 5's remain deeply 'oversold' on a long-term basis, as they've been for much of this year.
… and for some MORE of the news you can use » IGMs Press Picks for today (28 NOV) to help weed thru the noise (some of which can be found over here at Finviz).
In addition TO what I’ve noted Global Wall Street’s sellin (HERE), a few items which may be of interest …
Markets have rallied on hopes of changes in the pace of monetary policy tightening. But that could make central banks more reluctant to deliver those changes
Said another way, be careful what you wish and TRADE for, cuz you just might get it?
Asian equities fell after a weekend of protests in China against zero-COVID policies. Markets do not like the uncertainty the protests present. There are also now questions about the future direction of zero-COVID policies, and whether additional damage will be done to domestic demand.
The data calendar is relatively quiet. The US Dallas Fed manufacturing sentiment survey is of limited interest, but the comments section is a reminder of the presence of political polarization in economic survey evidence. The UK CBI releases retail survey evidence—the UK consumer is experiencing demand destruction and very negative real wage growth.
ECB President Lagarde speaks after an uncharacteristically long silence. However, a blog from ECB Chief Economist Lane last Friday is likely to be more interesting. This detailed Lane’s inflation thinking. Lane mentioned the role of margin expansion in current inflation, and issues in returning real wages to positive growth.
Federal Reserve President Williams speaks at the New York Economics Club. Economists have clubs because they are sorta social—demented and sad, but social. Fed Chair Powell’s comments on Wednesday may get more attention, but Williams’ comments (and those of Brainard two weeks ago) are more likely to set out medium-term thinking.
Moving along to another economist — this one coined the phrase, Bond Vigilantes
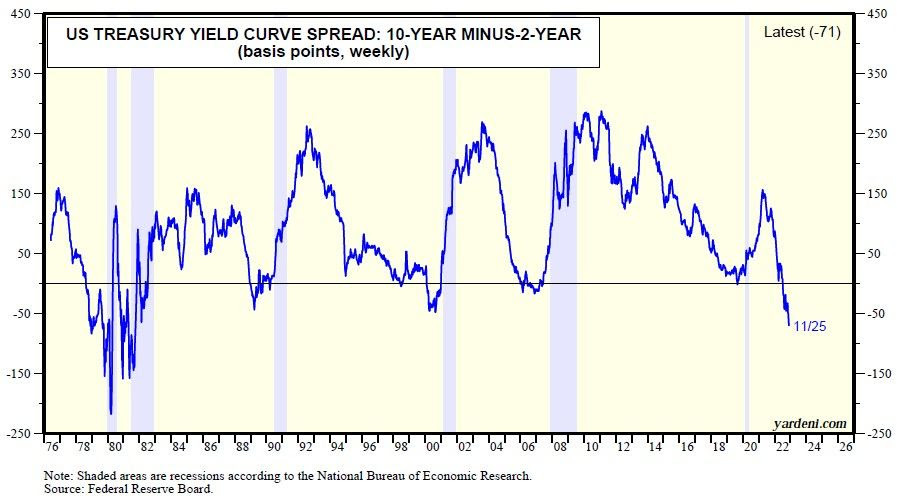
The yield curve spread between the 2-year US Treasury note and the 10-year US Treasury bond is a leading indictor of several cyclical financial and economic developments. It tends to invert (i.e., to turn negative) before economic downturns (chart). So it tends to predict recessions. We think that yield curve inversions actually predict that the Fed's monetary policy is getting too tight, which could trigger a financial crisis that could quickly morph into a credit crunch, causing a recession.
The Fed should be done tightening early next year, as anticipated by the inversion of the yield curve since this past summer, which also implies that the 10-year Treasury bond yield might have peaked at 4.25% on October 24. When the yield on the 2-year Treasury note equals or exceeds the 10-year Treasury bond yield, both tend to be close to their cyclical peaks (chart). Also anticipating the nearing of the end of the Fed’s monetary policy tightening cycle is the trade-weighted dollar, which peaked on October 19…
… Our analysis suggests that the bear markets in stock and bonds might have bottomed on October 12 and October 24, respectively.
MORE ecONObabble — and a timely reminder — from Goldilocks
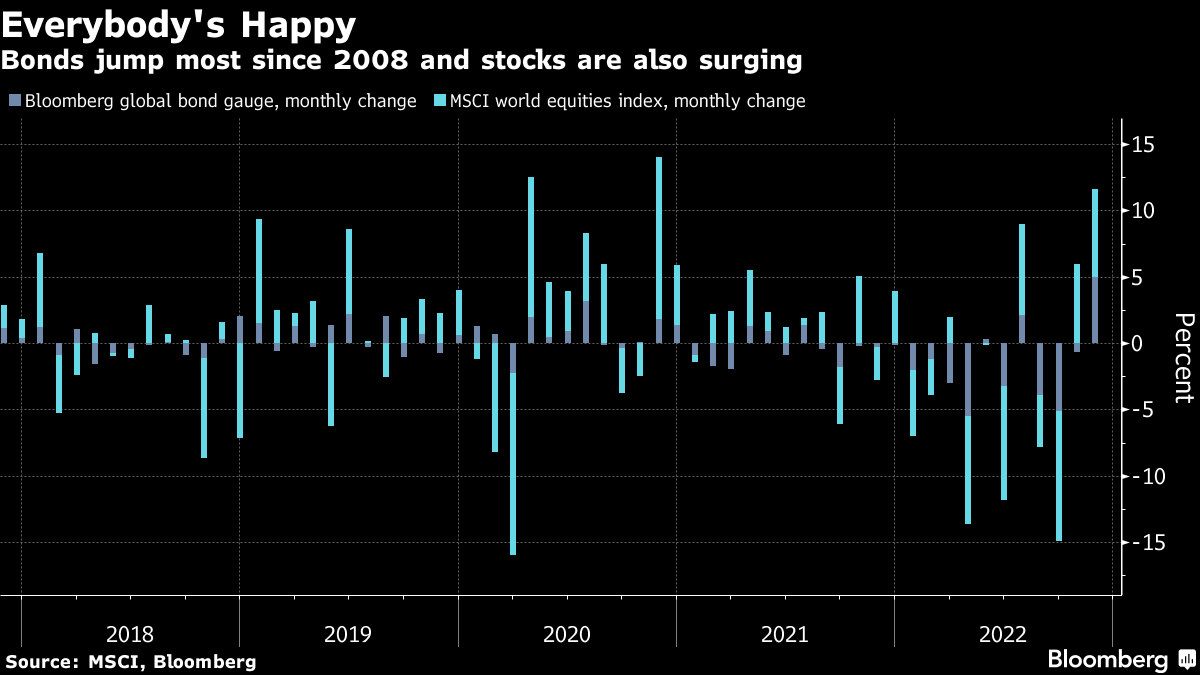
November has been a very buoyant month for assets of all stripes, with bonds and equities rallying into the teeth of a barrage of continued global central bank tightening. Bloomberg’s Global Aggregate gauge of fixed-income securities has gained 5%, heading for its best month since December of 2008, while MSCI’s world stocks index is up even more. The key dynamic looks to be the strong potential that the Federal Reserve will slow its pace and “only” raise its benchmark by half a point to complete a record year of rate hikes at 4.25 points, though equities also got a fillip from China reopening optimism.
This week is already looking like we may get a wild finish to the month, with the Covid protests in China giving stock investors ample reason to take money off the table. We also have Wednesday’s month-end offering a spur for position squaring, along with PCE inflation readings and Friday payrolls that could set off fresh policy whiplash concerns. That sweet November rally could yet turn sour.
One last thing … from a rather large French bank comes a warning / reminder,
The likely significant general decline in headline inflation rates in 2023 will not, in our view, herald a renewed disinflationary trend.
Reviving the ‘transitory’ inflation narrative might seem tempting, but underlying inflation is likely to remain elevated by past standards.
There remain upside risks to headline inflation next year, including a recovery in China.
Big swings in inflation highlight one of the key features of the global regime shift that we believe is underway: greater volatility of inflation.
… Even on our own forecasts, the fall in headline inflation rates next year is set to be historically large (Figures 2 and 3), with almost all regions we forecast seeing lower inflation in 2023 than in 2022.
Can’t WAIT to hear whatever it is on JPOWS mind … calendar HERE and THAT is all for now. Off to the day job…