Good morning … A short note on heels of yestereda’s short note … A relative calm over the weekend representing what may be calm before the SUPPLY, CPI, and FOPMPC storm in the days just ahead and SO … into the days ‘liquidity events’ (3yr auction early and 10yy) bit later on, I’ll begin with a couple charts.
First up, 3yy
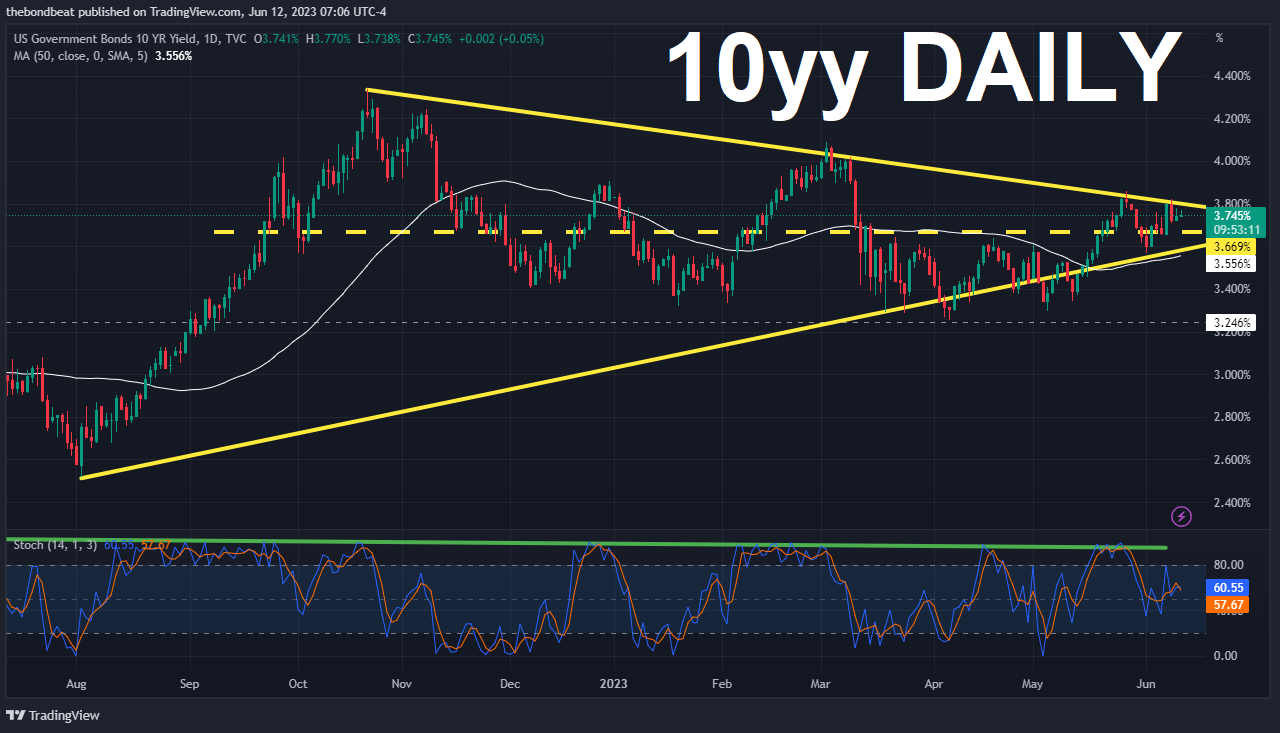
MOMENTUM (stochastics, bottom panel) remain BEARISH (same on WEEKLY) and with CPI and FOMC just ahead, likely to need more of a setup (ie concession). In as far as 10yy,
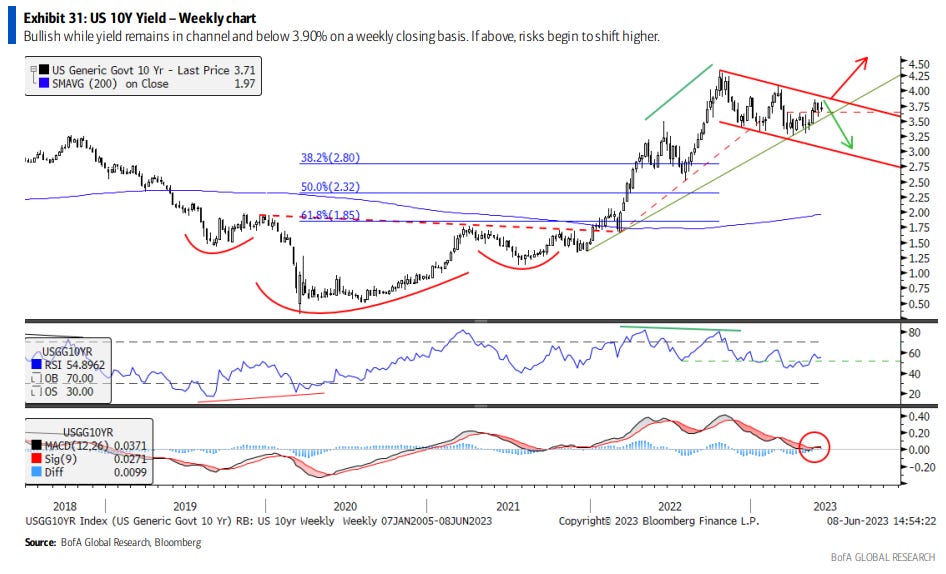
Different look here with ‘support’ holding for now and momentum ‘middling’ and I’ll add one more look from this past weekends sellside observations as some are eyeing the downtrend channel,
These visuals in mind … here is a snapshot OF USTs as of 706a:
… HEREis what this shop says be behind the price action overnight…
… WHILE YOU SLEPT Treasuries are mixed with the curve a hair flatter ahead of a big week of Treasury supply, the Fed, a probably key reading on jobless claims (was last week's pop Memorial Day noise or...?) and retail sales. DXY is lower (-0.25%) while front WTI futures (see attachments) are -2.5%. Asian stocks were mostly higher, EU and UK share markets are mostly higher (SX5E +0.5%) while ES futures are showing +0.15% here at 6:30am. Treasuries bear-flattened during Asian hours with our desk noting long-end selling from real$ names amid the push. But during the Asian afternoon hours, real$ bought the dip in intermediates-stabilizing prices. The London AM session was very quiet with no reported flow of note. Overnight Treasury volume was weak at ~65% of average overall with some relatively elevated turnover seen in 30yrs (116%).
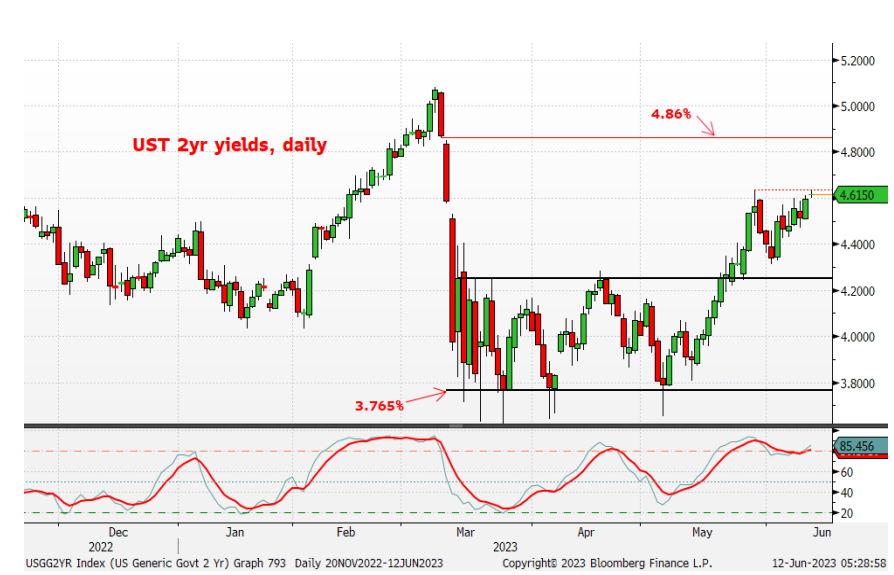
… On duration, we'll start with an updated look at Treasury 2yrs which finally filled their open gap (from March 10th-13th) back on May 26th. 2yr Tsy yields tested their May 26th move high again overnight where, if the support is taken out, we'd spot a next support level up at 4.86%- another/last open gap from March. The string of higher daily lows in recent sessions certainly indicates on-balance selling pressures coming into this week.
… and for some MORE of the news you can use » IGMs Press Picks for today (12 JUNE) to help weed thru the noise (some of which can be found over here at Finviz).
From some of the news to some of THE VIEWS you might be able to use… here’s what Global Wall St is sayin’ … First up, and in as far as Global Wall Street inbox and link-A-palooza, a couple items stood out to ME and were noted HEREyesterday.
I highlighted only a couple notes and one of them was MSs new rates forecast. This morning, the firms stock jockey weighing in and reminding us,
With the S&P 500 rally now crossing the 20% threshold, more are declaring the bear market officially over. We respectfully disagree due to our 2023 earnings forecast. Ironically, a Fed pause may awaken the bear tactically just as liquidity headwinds ramp up.
Sentiment and Positioning Are Now Bullish… The Historical Precedent for Our 2023 and 2024 V-Shaped Earnings Forecasts… Watching Earnings Quality...
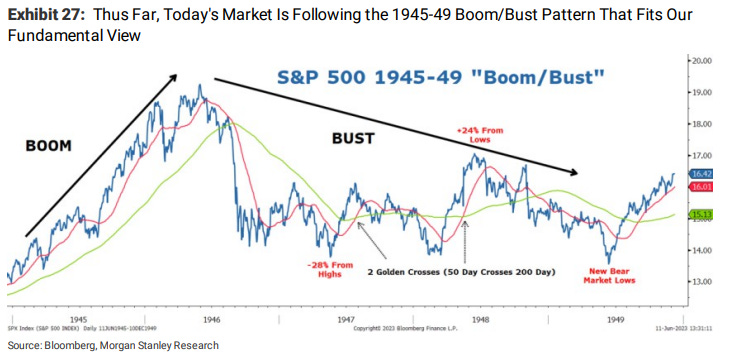
… Second, we don't find much value in the 20% threshold for declaring new bull markets. Instead, our conclusion is driven more by the fundamental set-up,valuations and expectations relative to our outlook. In short, our earnings view is much more pessimistic than the current consensus expectation, which is now assuming a 2H reacceleration story (which also appears to be priced). We can also find several instances of bear market rallies that exceeded the 20% threshold only to eventually give way to new lows. One example is particularly relevant given our 1940s-50s boom/bust framework. After the boom in 1946 following the end of the war, the S&P 500 corrected by 28% followed by a 24% choppy bear market rally that lasted almost 18 months before succumbing to new lows a year later (Exhibit 27). Thus far, this appears similar to the current bear market, which corrected 27.5% last year and has now rallied 24% from the intra-day lows, but is still 10% below the highs.
Since this rates guy has led with a note / update on stocks, here’s another more sanguine view
Based on the spread of returns between the overall SPX and the top 10 stocks driving the rally, there have only been two instances over the last three decades when leadership was as narrow as it is today: 2000 and 2020. Implications for the top 10 leaders are negative over the near-to- medium term.
… Since the mid-1990s, there have been only two instances of the Leadership Gap rising to levels comparable to today: the 2000 dot-com bubble and the 2020 COVID rebound. The current concentration of returns ranks above the 99th percentile over this multi-decade period.
I know this concept gets loads of push back and i’m NOT an equity analyst and never played one on TV so I’ll just leave it be and attempt to move on … From equities TO a weekly economic view of the world,
We forecast 2023 global growth at 2.9%Y, and 2.8%Y in 2024. We remain bullish on Asia, see a soft landing in the US, and at the margin, are a bit more optimistic on the euro area and the UK…
From a view of the world TO a view of … the USs Jobless Claims data,
Goldilocks: Distortions in Jobless Claims: One Step Forward, Two Steps Back
■ The seasonal distortions that plagued initial jobless claims over the last year were mostly fixed with the annual revisions to the seasonal factors in April. However, the same revisions that fixed the distortions in initial claims appear to have intensified seasonal distortions in continuing claims.
■ We estimate that the new seasonal factors overstated the level of continuing claims by 200k in March and now understate the current level by 10k, thereby flattering the recent trajectory of continuing claims. Put another way, while officially reported seasonally adjusted continuing claims have declined by 60k since mid-March, we estimate that the “true” level has increased by 150k. We estimate that reported continuing claims will eventually be understated by as much as 175k in September.
■ Elsewhere in the jobless claims report, a few modestly-sized, temporary distortions likely contributed to the outsized increase in initial claims this past week. We suspect that a combination of potentially fraudulent filings in Ohio (+3k), a policy change in Minnesota (+4k), and a difficult seasonal comparison (+10k) can explain roughly two-thirds of the 28k week-over-week increase in nationwide initial claims.
All else fails, ALWAYS and forever blame / use seasonals to ‘splain it away
And finally, getting a bit ahead of the game, a note to consider for this weekend’s upcoming and most glorious of made-for-Hallmark holidays,
Wells Fargo The U.S. Open Highlights the Key Role Tourism Plays in Los Angeles Economy
The U.S. Open, which is widely considered to be the national championship of golf in the United States, will be contested from June 15-18 in Los Angeles for the first time since 1948. Spending associated with the tournament should provide a boost to the local economy, which is still recovering from the pandemic.
AND as it is far to early to do math, this feels like one of ‘those moments’ where if you GAVE me the CPI and the Fed’s decision as well as the median DOT, I may still NOT get the TRADE right and so,
SUPPLY + CPI + FOMC = X, please solve for X
OR … as Yogi Berra once said, when you get to the fork in the road, TAKE IT,