(USTs lower, steeper on LIGHT volumes) while WE slept; “It’s the worst start of a year in more than two decades” … go!
Good morning.
Another day, another stagflationary dollar and set of data (all in the translation?) …
ZH: US Manufacturing Sector Slump Accelerates In December: Orders Down, Prices Up
…. and as doomy / gloomy as THAT may sound, they (ZH) then offered …
ZH: Treasuries Priced For Imminent Fed Cuts Face Correction
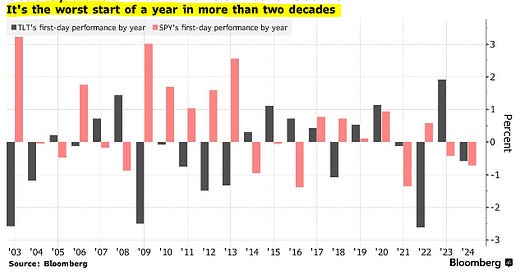
… it is with this in mind I cannot WAIT for this afternoons FOMC minutes. I ALSO cannot help myself but annualize what happened yesterday and jump TO conclusions, because, you know … “It’s the worst start of a year in more than two decades” …
Bloomberg: Bonds Extend New Year Retreat Before US Data: Markets Wrap
Traders look to Fed minutes, ISM and JOLTS data Wednesday
Chinese tech stocks in focus after removal of a top official
… Tuesday’s combined slump for bonds and stocks globally was the biggest for a first full trading day since at least 1999 as traders tempered their enthusiasm on Federal Reserve easing. The question now is whether that was a one-off rout, and the latest Fed minutes, manufacturing and job openings data due Wednesday may offer clues.
“2024 has kicked off with risk retrenchment,” Vishnu Varathan, chief economist for Asia ex-Japan at Mizuho Bank Ltd., said in a note. “Whether this is a durable purge from excessive exuberance or merely pre-NFP profit-taking is unclear,” he said, referring to the US nonfarm payrolls data at the end of the week…
… and I do believe it’s one of the very first lessons of the CFA (level 2 I think, correct me if I’m wrong) which states clearly to make investment and trading decisions based on a single day, ESPECIALLY when that day IS the first trading day of the year.
For MORE CFA level analysis of the 1st day of the year investment and trading conclusions, see Bespoke just below … but for now (with the FACT in mind that 10yy began and ENDED 2023 at approx 3.88% with about a 175bps RANGE from low to high) … here is a snapshot OF USTs as of 705a:
… HERE is what this shop says be behind the price action overnight…
… WHILE YOU SLEPT
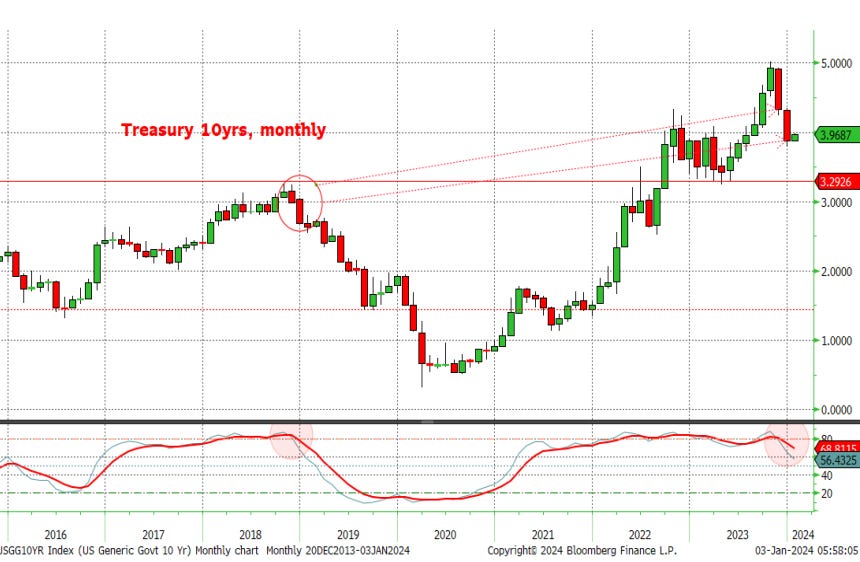
Treasuries are lower with curves steeper this morning as Q4's now over-loved sectors face a positioning reckoning/adjustment (discussed and illustrated below). DXY is higher (+0.25%) while front WTI futures are UNCHD. Asian stocks were mostly lower, EU and UK share markets are all in the red (SX5E -1.1%) while ES futures are showing -0.35% here at 7:15am. Our overnight US rates flows saw activity similar to yesterday's overnight flow with futures prices leading cash prices lower. Cash was again closed during the Tokyo session and when London opened, early fast$ selling in 10's gave way to better buying in 5's as prices stabilized. Overnight Treasury volume was ~75% of average overall with 5yrs (155% of ave) seeing some standout turnover- matching our flows this morning…… Our first attachment this morning shows the monthly chart of Treasury 10-year yields. 10-year Tsy rates peaked in October of 2018 and then rallied sharply during November and December with 10yr rates closing out 2018 almost at the lows of that ~2-month rally. As we've marked-up in the chart, that kind of year-end price action is certainly a mirror to what we've just experienced into year-end 2023. But after the sharp rally into the end of 2018, rates got predictably overbought (read: tactical positioning probably got too one-way long)
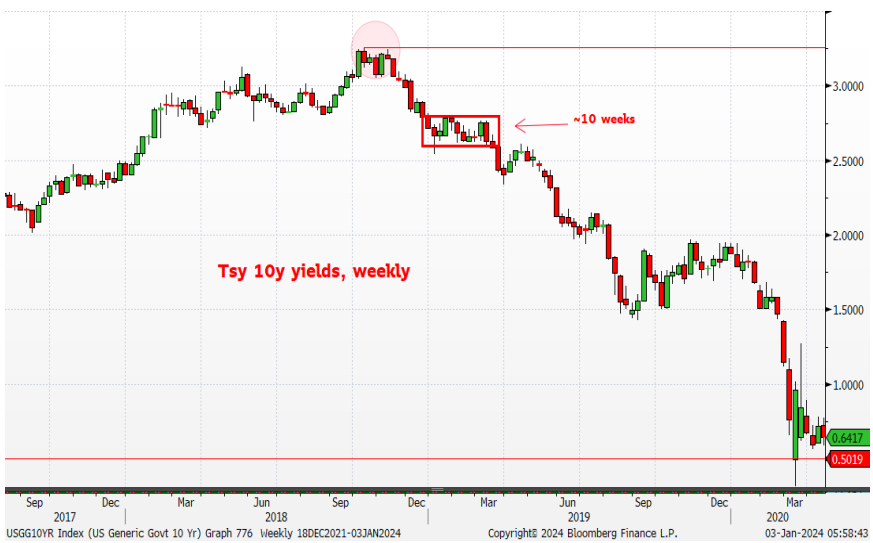
and as we show in the next weekly chart of Tsy 10yrs... Treasury 10yr yields spent nearly the entire first quarter of 2019 in a pretty well-defined range before rallying out of it and never looking back during Q2 2019. This ~10-week range was how the market re-balanced positioning and sentiment-- through time and a relatively protracted trading range. Indeed, we should note that within that ~10-week range in early 2019, there were a few weeks when bond prices sold-off from ~the open of the week all the way to the close; price action that the solid-body green candles represent. So there must have been at least some weeks where investors must have questioned the veracity and staying power of the bond rally.... Anyway, what we're acutely interested in right now is how rates investors are going to 'rationalize' the likely one-way tactical [long] positioning that accumulated during the rally into last year's close. Our best guess is that rates will work their way into some kind of Q1 2019-like range or up-sloping yield channel over the coming weeks as newly emboldened bears and the entrenched bulls battle it out.
Our last four attachments highlight the early 2019-like, 'overbought' conditions evident in rates benchmarks right now…
… and for some MORE of the news you can use » The Morning Hark - 3 Jan 2024 and IGMs Press Picks (who CONTINUES to be sportin’ that new, fresh look) in effort to to help weed thru the noise (some of which can be found over here at Finviz).
Moving from some of the news to some of THE VIEWS you might be able to use… here’s SOME of what Global Wall St is sayin’ …
Argus Daily Spotlight: Argus' S&P 500 Forecast for 2024 (pres cycle and RATES caught my eyes…)
… Our research shows that since 1980, the fourth year of a presidential cycle has been the most challenging for the S&P 500, though we note much of the weakness can be attributed to one year (2008, when the subprime mortgage crisis slammed the financial sector in the middle of the Great Recession). At this time, the U.S. financial industry is much healthier and we estimate that an expanding economy, growing earnings, and declining inflation and interest rates might offset political uncertainty, resulting in the S&P 500 ending the year in the black. Our formal price target for the S&P 500 in 2024 is 5200, about 9% above current levels, for a more-normal year.
Barcap: November construction spending shows continued growth alongside strong revisions (construction spend matters as far as message FOR GDP goes)
Construction spending rose 0.4% m/m in November, driven by an increase in the private sector, primarily in private residential spending. Alongside the November numbers, the October data were revised up substantially, providing a boost to our GDP tracker for Q4.
Barcap: December employment preview: Gradual moderation continues (gradual = X rate CUTS? the new math …?)
We expect a 175k rise in nonfarm payroll employment in December, slower than November's 199k gain, with average hourly earnings climbing 0.3% m/m (3.9% y/y). On the household side, we look for the unemployment rate to tick up to 3.8%…
… This week also features updates on job openings, the quits rate, and the hiring rate from the November JOLTS survey. Working from available estimates of job openings from Indeed.com, we think that job openings rose from 8.73mn in October to 9.0mn in November.
Bespoke: Bad Starts to a Year
First, the Bad: After soaring more than 50% in 2023, today was not a day to write home about for the Nasdaq Composite. On this first trading day of 2024, the Nasdaq fell 1.63%. This was actually the 4th worst start to a new year for the index in its history dating back to 1972 and only the 5th time that it has started a year with a one-day drop of more than 1.5%. The three years that started off even worse than today are listed below:
2001: -7.23%
2016: -2.08%
1980: -1.97%
2024: -1.63%
To read more about how the major indices performed for the rest of January and over the next few months following bad starts to years like we saw today, become a Bespoke member with our 2024 Special and check out tonight's post-market macro note -- The Closer -- where we'll be covering it in detail.
Now, the Ugly: While most stocks rallied in 2023, below is a list of the worst performing stocks in the Russell 1,000 last year. These names all fell more than 30% on the year, which is extra bad given that large-cap indices were all up more than 20% …CitiFX Techs - 3 charts to start the year (usd, YIELD CURVE, naz)
… US yield steepening still on the agenda
US 2s10s: Another 60+ bps of steepening is on the cards in the medium term. While we have extensively discussed medium term bullish indicators, we are now also seeing shorter term indications of a move higher.Why it matters: Taken in combination with our medium term bearish view on US yields (see more in subsequent sections), we continue to see bull steepening in the medium term.
In the numbers:
We are close to the neckline of a double bottom formation on the daily chart (at -31.89bps). IF we close above this level, the formation suggests a move towards the -10bps area, near the 2023 highs
Weekly slow stochastics has crossed over as well, suggesting bullish momentum
A 55-200w MA set up is still in play, with a formation indicated target of +23.96bps.
Longer term double bottom suggests an extended move towards +57bps
DB: How soon and how far? Alternative '24 cutting paths
The dovish pivot at the December FOMC meeting demonstrated that the Fed could be quite responsive to lower inflation over the coming year. Late last year, we detailed our baseline expectation for more aggressive rate cuts starting in June (see “2024 Outlook: Fed WINs in '24, but at what cost?") as well as soft landing scenarios that could see the Fed cut rates earlier but also move more cautiously (see “How soon is too soon for soft-landing rate cuts?”). In this piece, we provide greater detail about how alternative cutting scenarios could play out over the year ahead.
Our baseline view remains that the Fed cuts rates by 175bps in 2024 starting in June. We outline two alternatives to this view. First, in a mild recession with quicker retreat in inflation the Fed cuts even more aggressively – in this scenario we see the potential for ~225bps of cuts next year. Second, in a soft landing with a quicker retreat in inflation, the Fed could begin cutting in March but only reduce rates by 100-125bps in 2024. We discuss the tactics around soft-landing rate cuts …
… Our baseline: Slowing inflation + mild recession = aggressive cuts …
Goldilocks: Construction Spending Increases Slightly Below Consensus
BOTTOM LINE: Construction spending increased in November, below consensus expectations for a slightly larger increase, while growth was revised up in October and September. We left our Q4 GDP tracking estimate unchanged at +1.4% (qoq ar) and our Q4 domestic final sales growth forecast also unchanged at +2.2% (qoq ar).
Goldilocks: The impact of supply/demand balance on Treasury spreads
In this note, we study the price impact of supply and demand shifts in UST markets. Inspired by the academic literature on ‘convenience yields,’ we estimate the sensitivity of OIS-UST spreads to shifts in the supply of Treasuries, both in aggregate terms and for individual categories of UST buyers.
Our estimated aggregate demand curves for USTs are downward sloping—more supply translates to tighter spreads across the maturity spectrum. These curves “shift” as a result of changes in financing spreads (proxied by GC-OIS); higher relative funding costs translate roughly 1:1 to UST cheapening relative to OIS, for any given level of UST supply…
… Larger UST yield concessions should draw in more price sensitive buyers. We find that at current (and narrower) spread levels, households are likely to be the marginal buyer of USTs. Barring significant widening of funding spreads, we expect intermediate OIS-UST spreads will be floored between -40 to -50bp. Because price inelastic buyers tend to drive convenience yield pricing, exogenous demand shifts from this set of investors tends to have a greater impact on equilibrium spread levels.
UBS: Minutes matter
The Federal Reserve will publish the minutes of its December meeting—which is when Fed Chair Powell had a Damascene conversion to dovishness, and fueled a rally across asset classes. The Fed minutes were written and agreed after that, and the nuance may reflect other Fed members’ concerns with the dovish flip-flop.
The minutes matter because it is policy perceptions rather than economic trends that are changing at the moment. Recent data flow remains consistent with a softish landing and slowing inflation. Even the surprises are generally not that surprising. Re-evaluating the speed and timing of monetary easing has market rather than economic consequences.
The US is also offering a business sentiment poll, which does not really say much that is useful, and the JOLTS data on job vacancies. This number is based on so few responses that its accuracy can be questioned. It also reflects churn in the labor market rather than the degree of labor market tightness…
UBS: US Equity Strategy Roadmap - January 2024 (Golub says …)
TECH+ and Growth Stocks Lead in Stellar Return Year
2-Year Returns More Modest
Economic Backdrop Surprisingly Strong in 2023
EPS Growth Expected to Reaccelerate in 2024Rates Lower on Falling Inflation and Fed Pivot
Since February 2022, Core PCE—the Fed’s preferred inflation measure—has declined from 5.6% to 3.2%. UBS economists expect this measure to fall below 2% by year-end 2024. On December 13, Fed Chair Powell signaled a pivot in monetary policy. As a result, expectations have shifted from 3 rate cuts to 6 in 2024. While 10-year Treasury yields remain virtually unchanged from a year ago, spreads have declined precipitously.Wells Fargo: Construction Spending Advances in November
Sturdy Residential Construction Counteracts a Slip in Nonresidential Outlays
Single-Family and Manufacturing Spending Propel November's Rise
Construction spending posted another solid gain in November, rising 0.4% over the month. Amid high financing costs and shaky demand for real estate, overall momentum in the construction sector continues to be fueled by a few key segments. First, private single-family outlays have now picked up for seven consecutive months, reflecting the relative attractiveness of new construction amid scarce supply and tough affordability conditions in the existing home market. Second, the manufacturing construction rally appears to be counteracting the broader interest rate headwinds facing nonresidential construction. On the downside, multifamily outlays continue to moderate off of the postpandemic construction boom alongside normalizing apartment demand and declining multifamily starts. Commercial construction also remains acutely challenged by elevated financing costs and restrictive lending conditions.Yardeni: Fairy Godmother Of The Bond Market (HERE is a Citi SURPRISE LINK)
When Janet Yellen was Fed chair from 2014 to 2018, we often referred to her as the “Fairy Godmother of the Stock Market.” We noticed that stock prices tended to rally following her speeches and testimonies on monetary policy and the economy. She has been Treasury secretary since 2021. We may start calling her the “Fairy Godmother of the Bond Market.”
That’s because the rally in the bond market at the end of last year was sparked by the November 1 Treasury announcement that less would be raised in the note and bond markets and more in the bill market to finance the government’s deficits. Indeed, over the past 12 months through November, the net increase in Treasury bills versus notes plus bonds was $1.9 trillion versus $0.4 trillion (chart). Let’s hope Yellen’s magic wand continues to work.
Also helping to push yields down during the last two months of 2023 was a drop in the Citigroup Economic Surprise Index from 63.4 at the end of October to 1.1 today (chart). We don't expect much more downside in the CESI in coming weeks..
… And from Global Wall Street inbox TO the WWW,
Investopedia Chart Advisor: Constructing Intermarket Analysis (these are decent, some ripped from someone with a BBG and so, they are worth slowing down for a moment, at least IMO)
1/ Yield curve
2/ Correlation (spx, CPI YoY and 10yy)
3/ Stocks vs. Bonds
Sticking with the stocks vs. bonds relative performance, I create an indicator from the ratio of the total return of the SPX Index and the US Treasury bond index. I compare this relative performance to economic indicators that get tracked and discussed in the market. After all, the economy leads earnings and earnings lead stocks. If the economy is doing well, all else equal, stocks should do well. If it is not doing well, stocks may struggle.
We saw in the first chart that both the yield curve and the consensus economists suggest there could be struggles in the economy sometime in the next 6 months. What about other indicators that may be more timely than these?
The first two you should consider in this chart are the US ISM Index (NAPM PMI) and the Leading Economic Indicators (LEI). Both of these are coincident with the stock market, which itself is a leading indicator. You can see that both of these headed lower for much of 2023 but have flat-lined a bit of late. As these stopped going lower, the relative performance of stocks vs. bonds has shot higher, perhaps much more than the economic indicators may suggest if history is a guide.
Two other economic data points I add on this chart are GDP (green) and the US unemployment rate (inverted in purple). I add these on the chart in order to show you that both of these data points lag the relative performance of stocks and bonds quite badly. While many in the news like to discuss these data points extensively, both are lagging as to the point of being almost useless for most market practitioners.
4/ FOMC Rate Cuts (rate cuts for stock jockeys — FDTR and SPX)
… We can also see that if in fact we get a soft landing, the SPX yearly returns are positive. If we get a recession, the SPX returns are always negative. This would suggest the market returns right now are suggesting a soft landing with FOMC rate cuts forecast to occur. One finer point, however, the keen eye may see that the SPX yearly returns were negative in the period leading up to the rate cuts ahead of a soft landing. Thus, the market seems to have been responding more to no recession than actual rate cuts.
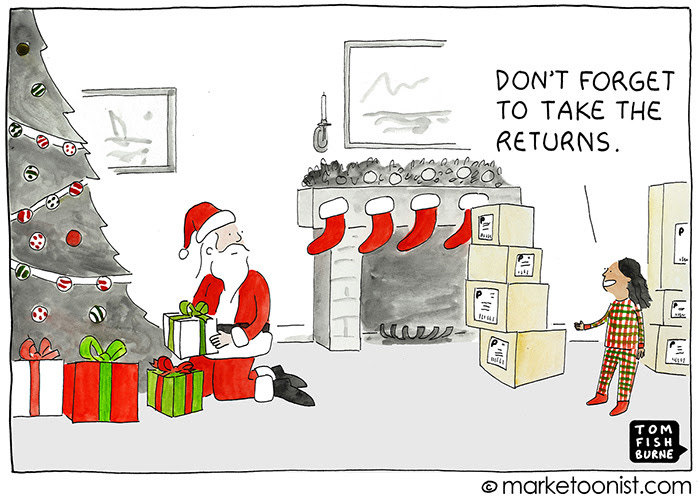
… AND ‘tis the season to NOT forget THE RETURNS …
… THAT is all for now. Off to the day job…


WOW, so after being down 1st trading day of 2024 and it's already TIME TO THROW THE BABY OUT WITH THE BATH WATER??? This only confirms the biases of Speculation is required LIQUIDITY for markets to function today I subscribe to currently. Damn it!
PS: RIP Tommy Cutlets? It was an awesome 15 minutes!