(USTs lower on STRONG VOLUME)while WE slept; Apple downgrade + China Data + Xi + Earl = another funTERtaining year underway ...
Good morning and happy new year!!
Long day of travels home yesterday and so not too much time for this stuff so I’ll do best I can and skip the part of the programming where I’d attempt to offer any sort of view (complimentary TO the one(s) espoused below OR contradictory) and begin with a few words of a couple developments overnight via NatWEST (via Bloomberg, apparently, so I’ve added couple links best I could) …
… Overnight headlines
Chinese shares dragged down Asian equities on the first trading day of the year following weaker-than-expected factory data and a speech from President Xi Jinping that flagged the headwinds facing the economy. (Bloomberg)Oil rose after Iran sent a warship to the Red Sea in response to the US Navy’s sinking of three Houthi boats over the weekend, adding to regional tensions as ships continue to avoid the key waterway. (Bloomberg)
… I’ll throw in something media has been talking about … specifically, AAPL
CNBC: Dow futures fall nearly 200 points to start the new year as rates rise, Apple shares decline: Live updates
… Apple shares led the pullback after Barclays downgraded the member of the Magnificent 7 market leaders basket to an underweight rating.
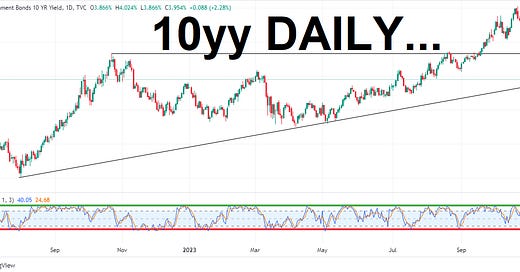
… AND from China, Earl and AAPL — mag7 or NOT — TO a simple / updated look at the HERE AND NOW through the lens of the global benchmark yield …
… here is a snapshot OF USTs as of 705a:
… HERE is what this shop says be behind the price action overnight…
… WHILE YOU SLEPT
Treasuries are lower with curves little changed, following UK and EGB rates higher ahead of an expectedly heavy seasonal slate of IG and SSA supply. DXY is higher (+0.60%) while front WTI futures are higher as well (+2.2%) after this weekend's news from the Red Sea. Asian stocks were mixed (China shares generally lower again), EU and UK share markets are also mixed while ES futures are showing -0.6% here at 7am. Our overnight US rates flows saw a futures-led sell-off early in London's hours (Japan out on holiday). But despite the sell-off, our cash desk flows saw better buying in the belly from real$ as the belly led the drop in prices. We also saw fast$ interest in 5s30s steepeners this morning. Overnight Treasury volume was very solid at around 200% of average after the turnover figures plunged into year-end…
… and for some MORE of the news you can use » The Morning Hark - 2 Jan 2024 and IGMs Press Picks (who CONTINUES to be sportin’ that new, fresh look) in effort to to help weed thru the noise (some of which can be found over here at Finviz).
Moving from some of the news to some of THE VIEWS you might be able to use… here’s SOME of what Global Wall St is sayin’ …
Apollo 2024: Lagged Effects of Fed Hikes Versus the Fed Pivot (happy new year!)
The Fed pivot in December parallels what happened a decade ago.
In 2013, the taper tantrum triggered a quick tightening in financial conditions due to a modest change in Fed communication.
Today, we are seeing a similar significant change in financial conditions on the back of a modest shift in Fed communication, but with the opposite sign.
The Fed pivot in December was a modest change in Fed communication, but the subsequent easing in financial conditions has been dramatic.
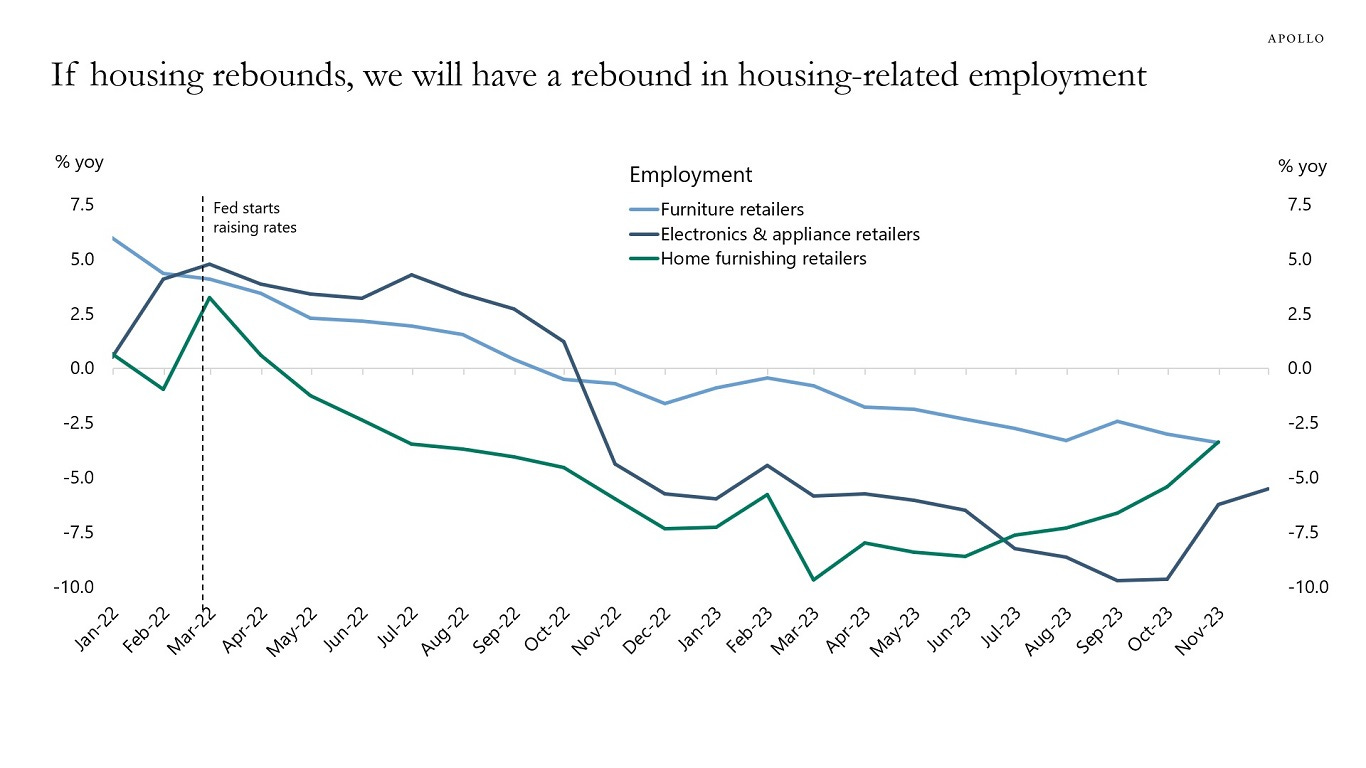
As a result, 2024 will be the year of the lagged effects of Fed hikes versus the Fed pivot. If the Fed pivot continues to push mortgage rates lower, stock prices higher, and credit spreads tighter, we could get a solid rebound in the economy over the coming months, particularly in housing, which will trigger a rebound in employment growth, see chart below.
Apollo: There Is No Substitute for the US Treasury Market (no, no sir, there is not)
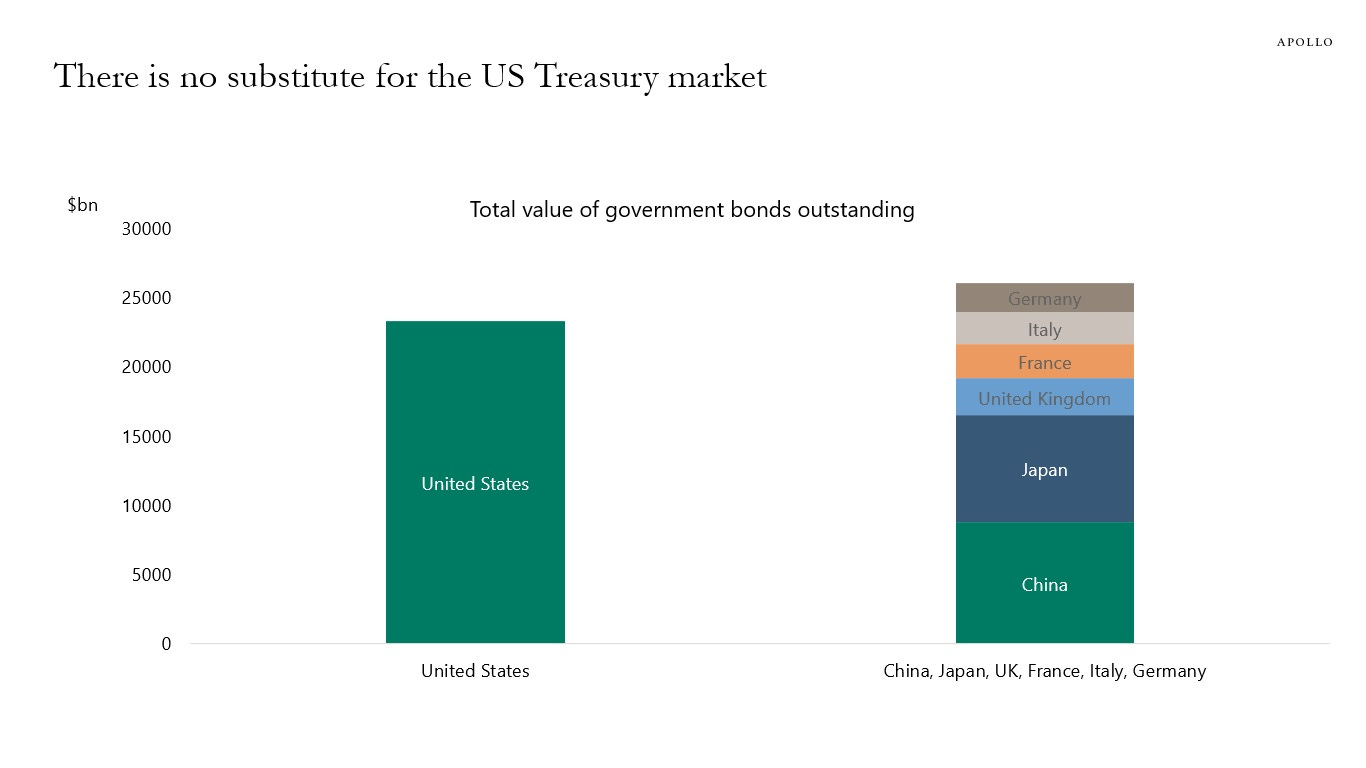
The US Treasury market is the same size as the combined government bond markets of China, Japan, UK, France, Italy, and Germany, see chart below.
The bottom line is that there is no substitute for the US Treasury market.
Looking into 2024, the list of upside risks to yields in the long end is long, with a big budget deficit, increasing Treasury issuance, the risk of a sovereign downgrade, the Fed doing QT, falling foreign demand for Treasuries, and a shift in issuance away from bills to coupons.
These forces are pushing long rates higher. But a dovish Fed pulls in the other direction.
Even if the Fed starts cutting rates, a steepener in the first half of 2024 seems most likely, with upside risks to long-term interest rates coming from factors unrelated to what the Fed will do.
In particular, if we get a soft landing in 2024, then both economic and non-economic forces could, by the end of 2024, push long-term interest rates higher than where they are today.
Barcap China: Disappointing PMIs to trigger monetary easing
Weaker-than-expected manufacturing PMI and contracting services PMI pointed to deterioration in growth fundamentals in December. We think the weaker growth momentum and deeper deflation environment could prompt more monetary policy easing, with a policy rate cut and/or RRR cut arriving as soon as January.
•December NBS manufacturing PMI: 49
•Bloomberg consensus forecast (Barclays): 49.6 (49.2)
•November NBS manufacturing PMI: 49.4DB: What you need to know for the week ahead
Commentary for Tuesday: Despite the Monday holiday, the week will be chock full of important data releases to start off the new year, most important of which will be Friday's employment report for December. Our headline (+150k forecast vs. 199k previously) and private (+130k vs. +150k) payroll forecasts mainly reflect an unwind from the returning auto workers boost in the November data. However, there is some upside risk as there seems to be some residual seasonality with hiring for couriers and messengers spiking in December, at least pre-pandemic. While such an increase was not evident in 2021 or 2022, we feel the risk is worth flagging…
DB: December, Q4 and 2023 Performance Review
2023 was an incredibly eventful year in markets, with plenty of forces for investors to navigate. In March, there was significant turmoil following the collapse of Silicon Valley Bank, leading to some of the biggest bond market moves in decades. In May, we saw growing excitement about the potential growth impact from AI, leading to a major outperformance from big tech stocks. Then from the summer, the prospect of interest rates remaining higher for longer led to a major bond selloff, which briefly pushed the 10yr Treasury yield above 5% for the first time since the GFC. Geopolitical events remained in focus too, particularly after Hamas’ attack on Israel in October. But from late-October onwards there was an astonishing rally across several asset classes, as declining inflation led investors to grow increasingly excited about a soft landing. That then got further momentum in December, particularly after the Federal Reserve signalled 75bps of rate cuts for 2024.
So despite several ups and downs along the way, most assets put in a strong overall performance in 2023. For instance, the S&P 500 posted a +26.3% gain in total return terms, supported by a +107% gain from the Magnificent 7. Bonds were also back in positive territory after their losses over the previous two years, thanks to the late recovery over the final two months of the year. And finally, with central banks staying hawkish for much of the year, risk-free rates in 2023 were the highest they’d been in a long time. For instance, US T-bills returned +5.1%, marking their strongest performance since 2000.
Year in Review – The high-level macro overview
… However, that all changed swiftly with the collapse of Silicon Valley Bank, which raised fears about broader contagion across the financial system. For instance on March 13, yields on 2yr Treasuries saw their largest daily decline since 1982, surpassing the daily moves during the GFC, after 9/11, and on Black Monday in 1987. Meanwhile in Europe, Credit Suisse then came under investor scrutiny and saw large deposit outflows, which culminated in a purchase by UBS that included guarantees from the Swiss government. That led to major bond moves in Europe too, and on March 15 as concern grew about Credit Suisse, the 2yr German yield saw its largest daily decline in data going back to reunification in 1990. US banks saw a massive underperformance as a result, and the KBW Bank index was down by -24.9% in March in total return terms. And more broadly, the MOVE index of Treasury volatility rose to levels last seen at the height of the GFC in 2008. This concern lingered for some weeks, and on May 1, First Republic Bank was closed and JPMorgan acquired most of its assets. But by June, markets had calmed for the most part, and the VIX index of volatility was at a post-pandemic low …… That prospect of rates remaining higher for longer led to a major bond selloff in Q3. Indeed, the Fed’s September dot plot saw the 2024 dot move up to its highest yet, at 5.1%, suggesting there was little rush to pivot towards rate cuts. Alongside that, inflationary pressures were still present, and oil prices were up by over $20/bbl over Q3 as a whole. And as that was going on, investors became increasingly focused on budget deficits, not least after Fitch Ratings downgraded the US credit rating from AAA to AA+.
By late-October, that backdrop meant the US 10yr yield surpassed 5% intraday for the first time since 2007. Equities also continued to struggle, and by October, the S&P 500 had seen 3 consecutive monthly declines for the first time since the pandemic turmoil of March 2020. The landscape looked pretty tough …
… Which assets saw the biggest gains of 2023?
… Sovereign Bonds: Thanks to the year-end recovery in November and December, sovereign bonds put in a decent performance over 2023, beginning to recover from their losses over 2021 and 2022. For instance, US Treasuries ended the year up +4.1%, whilst Euro sovereign bonds were up +7.2%.UBS: Economies on course for a softish landing
The last month of 2023 was marked by equity and bond rallies. The economic outlook did not really change, but the language of Federal Reserve Chair Powell did. Because Powell’s past policy errors comprehensively trashed forward guidance, investors can choose which guidance they wish to follow. Other Fed members trying to dilute the reaction to Powell have been ignored.
A continued inflation slowdown is the main economic story for 2024. Enhancing real wage growth helps create a softish economic landing. However, central banks can claim only a small part of the credit for bringing inflation down. Transitory durable goods inflation ended automatically. Energy inflation was more a supply issue. Profit-led inflation is fading in the face of consumer rebellion. Higher rates slow inflation by slowing credit and raising unemployment. These effects have been very muted so far.
The Red Sea will be a focus for investors, with more attacks on shipping in recent days. Reducing European demand for Asia’s durable goods lessens the economic impact of having to divert sailings.
The data calendar is quiet—there is background noise courtesy of business sentiment polls. The UK BRC December shop price index showed slowing food price inflation as profit-led inflation retreats; this may not fully translate into official price data.
… And from Global Wall Street inbox TO the WWW,
Bloomberg: Treasuries Post First Gain Since 2020 as Fed Pivot Gets Traction (this one to ADD to DBs ‘historical record’ of what 2023 was in UST terms)
… As measured by the Bloomberg US Treasury Index, the market’s gains in December and November were among its biggest in years. Short-maturity yields, more sensitive to changes in monetary policy, declined the most, leaving yield-curve spreads steeper or less inverted.
For 2024, many US interest-rate strategists expect that short-maturity yields will continue to decline as the Fed lowers its target for the fed funds rate from 5.25%-5%, with most expecting cumulative cuts of one to two percentage points.
The Bloomberg US Treasury Index returned 4.1%, its first full-year gain since 2020, when the Covid-19 pandemic caused a global recession; the best months for the index were November (3.5%), December (3.4%), March (2.9%) and January (2.5%); the worst were February (-2.3%) and September (-2.2%)
2023 changes for benchmark yields:
2Y -18bp
5Y -16bp
10Y +0.4bp
30Y +6.5bp
Yields charted a meandering course during the early part of the year as a regional bank crisis in March cast doubt on the economy’s prospects; they began a sustained rise in May as expectations for another Fed rate increase mounted amid strong economic data, stability in regional bank shares and an agreement to suspend the federal debt ceiling …
Bloomberg: The Fed Will Set the Pace for Markets More Than Ever This Year (OpED)
What the US central bank says and does will dictate how stocks and bonds fare in 2024…
… As the charts below argue, what the Federal Reserve does next will be more important than ever in determining how financial markets behave in the new year.
Don’t Fight the Fed
This truism should become the obligatory screensaver of every trader and portfolio manager. After 11 interest-rate hikes and 525 basis points of tightening, the market senses the tide is turning. Exactly when the US central bank decides to ease is perhaps less important than the speed and scale of the easing cycle — and futures traders are anticipating rapid and deep cuts.
… Treasuries Follow the Path of Most Resistance
Most years, forecasts for where the 10-year Treasury will be by the end of December have typically been over-optimistic — only a 100 basis-point rally in the final two months of last year, taking the yield to 3.9%, saved 2023’s prognosticators from being wildly off-target.
… Bonds Breach an Important Milestone
After flirting with zero at the start of this decade, government borrowing costs soared last year, with the 10-year average for countries in the Group of Seven breaching 3% for the first time in more than a decade. The 10-year Treasury, the world’s benchmark, peaked at 5% in October, marking a fivefold increase since the beginning of 2021.
Dogs of the Dow: YEARLY UPDATE
The official 2024 Dogs of the Dow & 2024 Dogs of the Dow X have been posted.
For 2023, Dogs of the Dow and Small Dogs of the Dow were up double digits.
Dogs of the Dow X and Small Dogs of the Dow X did even better (beat the Dow).
In fact, with their hefty dividends, Small Dogs of the Dow X gained well over 20%…
… Dogs of the Dow X
Dogs of the Dow X pages -- 2024 Dogs of the Dow X | Current Doggishness X | Daily | YTD | Dogs of the Dow X Today | Small Dogs of the Dow X TodayWhat is Dogs of the Dow X? Get all the details with Dogs of the Dow X Explained.
Having trouble logging into or having to login each time you want to access Dogs of the Dow X? There is a solution. Simply check our FAQ.
Hedgopia: Bond Shorts Betting On Higher Yields Probably Right Tactically But Not Strategically
…
In the futures market, non-commercials continue to bet that rates on the long end of the treasury yield curve are headed higher. Given where yields are currently, tactically, these traders probably have it right. But if this move is strategic and long-term in nature, then a lot needs to go right.
Last week, as of Tuesday, non-commercials’ net shorts in 10-year note futures, went up 17.1 percent week-over-week to 804,984 contracts, coming on the heels of the prior week’s 23.5-percent gain. Holdings are now within spitting distance of the record 850,421 contracts posted in the week to May 30th (Chart 2)…
Sam Ro from TKer: 9 big stories to watch in 2024
1. Labor market: How cool will it get?
2. Inflation: Is the worst behind us?3. Monetary policy: Tight for how long?
4. Sentiment: Finally a vibe-spansion?
5. Economic growth: Slowdown, recession, or something else?
6. Corporate profit margins: Will they hold up?
7. Interest expense: Will it become a problem?8. Corporate earnings: Better or worse than the growth expected?
9. Stock market: Will it do what it usually does?WolfST: This Was a Funny Two Years in the Stock & Treasury Markets (funny NOT funny? pretext … NOT context?)
S&P 500 still down from 2 years ago, Nasdaq back to Aug 2021, small caps back to 3 years ago, but the Mag 7 blew out…
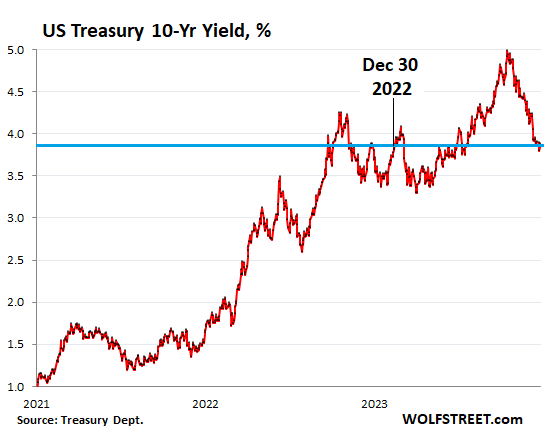
… Ok, the 10-year Treasury yield... That was funny too. It ended 2023 at 3.88%, to the basis-point where it had ended 2022 (3.88%), and so it went absolutely nowhere over those 12 months, but it sure climbed a big mountain for 10 months with a lot of blood (including banks that collapsed), sweat, and tears, and then, amid the mania about the Fed’s gazillion rate cuts in 2024, it hop-scotched all the way back down in two months.
In this cycle, the 10-year yield had first reached 3.88% on the way up in September 2022.
Barely visible on this chart: the 10-year yield actually rose for the past two days by a combined 9 basis points, as the mania about the Fed’s gazillion rate cuts began to fade.
AND as I resume regular spammation of your inboxes and the WWW, a look at the (holiday-shortened) economic week ahead via Econoday:
AND …
… THAT is all for now. Off to the day job…


IF Tahoe-area skiing is an accurate economic indicator, then I'd say things look pretty weak. However, the lack of snow out west, and the returning traffic from Tahoe-Reno on westbound I80 through the sierras would contradict the skiing indicator. Pretty much like all the current econ data these days!
Welcome back Happy New Yr!