(USTs lower on light volumes)while WE slept; mid-year checkin (MS bearish stks); UST short base grows; JPOW goes TO Dead & Co show in VA this weekend...
Good morning … I hope you had a nice weekend and enjoyed lower ‘ish gas prices while they existed as Saudi Arabia announced further voluntary oil production cut from July while OPEC+ retained 2023 targets and extended them into 2024.
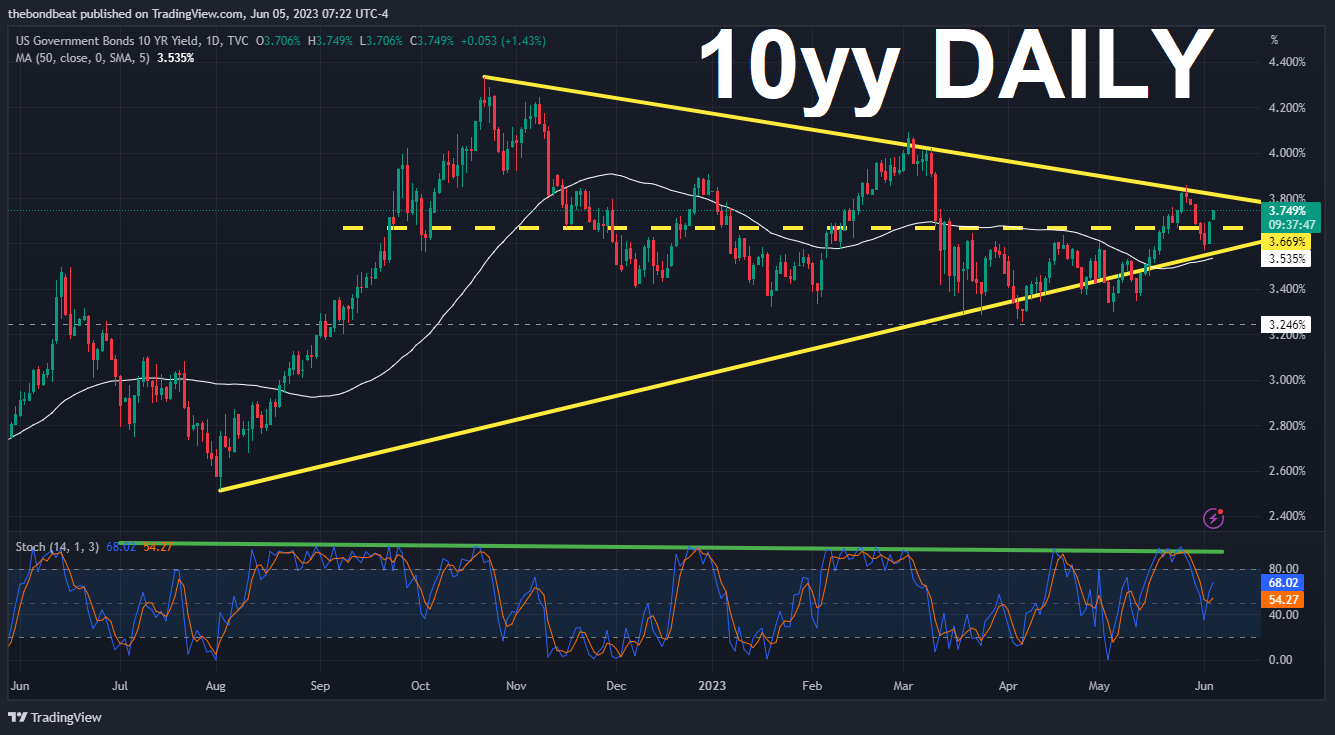
With ‘Earl back on the move higher, well, so to are yields but I’m sure they are completely unrelated … 10yy, DAILY:
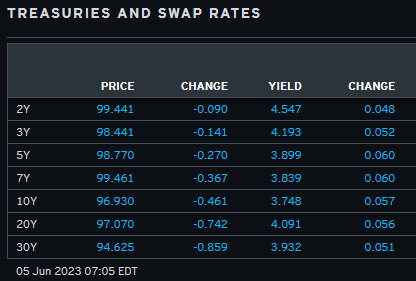
Triangulating TREND our friend until it ends (and we’ve got to break out the thick crayon and go back to the redrawing board) … For somewhat MORE and front-end related, see just below … here is a snapshot OF USTs as of 705a:
… HERE is what this shop says be behind the price action overnight…
… WHILE YOU SLEPT
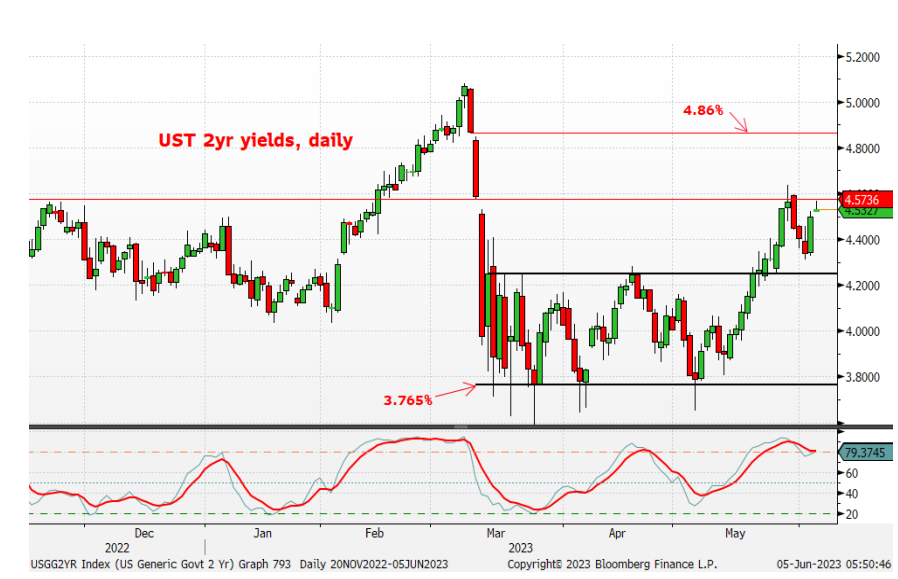
Treasuries are lower with the curve little changed after the Saudi's further cut Oil production and as the US rates markets gird for a surge of T-Bill supply (see above). DXY is higher (+0.27%) while front WTI futures are too (+1.9%). Asian stocks were mostly higher (NKY +2.2%), EU and UK share markets are mixed while ES futures are little changed here at 7am. Our overnight US rates flows saw Friday's sell-off extended into Asian hours with real$ a better seller in the long-end despite our volume stats showing the highest turnover in the front-end. Overnight Treasury volume was ~85% of average overall.Our first attachment this morning looks at the daily chart of Treasury 2yr notes. Last week 2's found support near their gap level (from mid-March) near 4.574%. We came close to re-testing the support level overnight and note in the lower panel that daily momentum remains pinned near 'oversold' levels. We take this as a hint of largely 1-way tactical short positioning where, if true, said shorts are likely in-profit and therefore little stressed at this point. Above 4.574% there is another open gap up at 4.86% that could offer some support while resistance remains near 4.25%, the old rate range highs. We have no idea whether it's 4.25% or 4.86% first, with 2's sitting close to the middle of those bands at present.
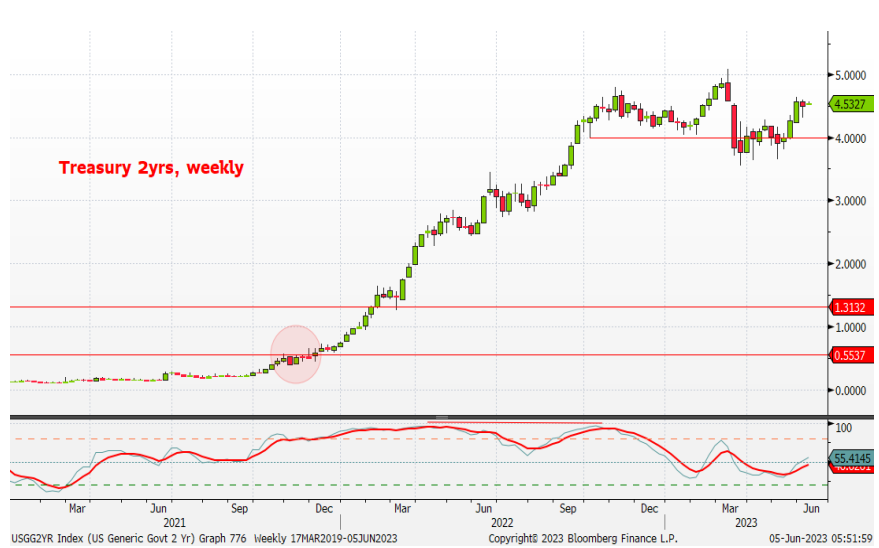
Zooming out to the weekly chart of Tsy 2yrs, medium-term momentum shows a mild bearish bias (lower panel) but the study sits at 'middling' levels. On that, it's turns from the overbought/oversold extremes (<20 or >80) that we look for as a higher confidence trend signal so we're not sure what to make of this one.
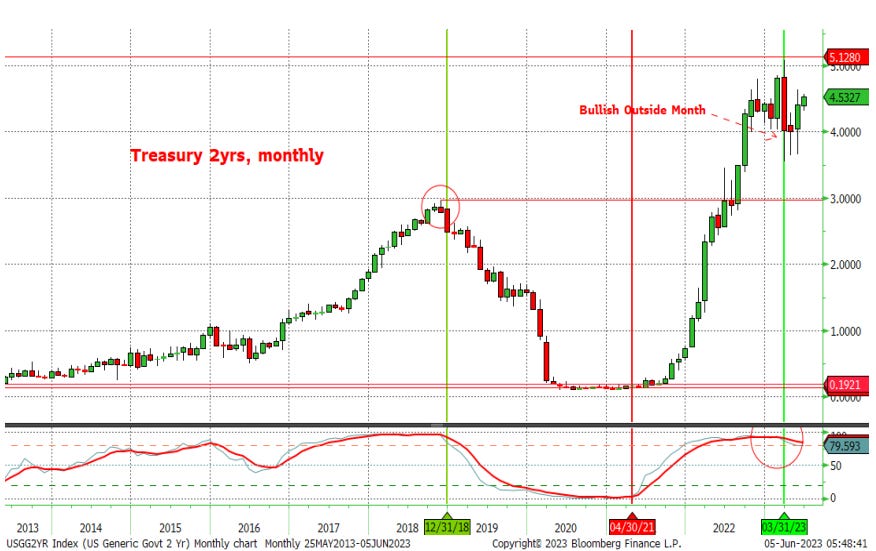
Finally, the long-term, monthly chart of 2yrs once again highlights the bull turn in momentum back in March with 2yrs remaining long-term 'oversold' (no surprise) while the momentum oscillator still flashes green, or mildly bullish for 2yrs. Messy charts like this = low conviction on our part. This is why our recent focus has been on clearer pictures like those in TIPS breakevens (look biased higher in 2y and 5y breaks) and commodities (BCOM looks ripe for a further rebound).
… and for some MORE of the news you can use » IGMs Press Picks for today (5 JUNE) to help weed thru the noise (some of which can be found over here at Finviz).
From some of the news to some of THE VIEWS you might be able to use… here’s what Global Wall St is sayin’ …
First UP, a link back to this weekend’s sellside observations where I highlighted more than a couple note jump in URATE as important
BMO: shift fwd entry buying of 10yy DIPS to fwd entry 5s30s steepner and NOTES jump in URATE, “…Using history as a guide, the increase in the UNR has reached an inflection point whereby (roughly speaking) a 0.3 percentage point increase in U3 off the trailing 12-month low portends a larger surge in joblessness"…”
Citi on URATE, “… As we share graphically, prior historical incidences of 3/10ths jumps in the U-3 UR have some often coincided cyclical turning points and sustained rises in the U3…”
MS cutting ALL it’s trades (incl LONG 5s), NEUTRAL, more UST VOL coming
That was THEN and a couple / few more items hit inbox since …
First up on the 1milllion barrel CUT in nOPEC+ production being cut,
UBS: One million barrels
Saudi Arabia pledged to cut oil production by one million barrels per day. Oil prices subsequently soared to levels not seen since last Tuesday. Any price increase transfers money from buyers to sellers, so the global growth impact is more redistributive than negative. The impact on developed economy consumers depends on changes in oil demand, and whether other factors influence prices. UK auto fuel prices fell recently, after the competition authority became interested in retailers’ profits.
The US employment report showed jobs being created, or jobs being lost (depending on which part you read). Average earnings (not wages) slowed and were revised down, and hours worked were weaker. The report is a reminder of the problems of data—fewer than half the firms asked contribute to non-farm payrolls.
US April factory orders and final durable goods orders are due. Media reports have suggested that China will account for less than half of US imports of low-cost products from Asia by the end of 2023—some of this is switching to other locations, but some of this is onshoring.
AND for the upcoming FOMC BLACKOUT PERIOD (noted HERE),
Wells: June Flashlight for the FOMC Blackout Period
We expect the FOMC to refrain from raising rates at its June 14 meeting, but we believe the Committee will signal that more tightening remains a distinct possibility in coming meetings.
Moving along to a couple MID YEAR outlooks/upates.
MS US Equity Strategy: US Equities Mid-Year Outlook: Cyclical Bear within a Secular Bull
Hotter but shorter cycles persist — we continue to forecast an earnings recession this year that we don't think is priced, followed by a sharp EPS rebound in 2024/2025. We recommend investors focus on stocks with defensive characteristics, operational efficiency, and earnings stability.
… We Still Expect a Tactical Correction as the Cyclical Bear Market Concludes… While our call for a more meaningful tactical correction at the index level has not played out thus far in 2023, a major repricing has occurred internally led by lower quality, cyclical, and small cap stocks. We think a couple of factors have held indices up: anticipation of a Fed pivot, a persistent improvement in liquidity, outperformance of a handful of mega-caps due to a flight to quality and AI, and belief that the worst of the earnings recession is behind us. We don't think the emergence of these factors negates our tactical downside call as we see 2023 earnings facing significant headwinds — we lower our base case 2023 earnings forecast from US$195 to US$185 (17% below consensus). Further, at current valuation levels, we believe that the equity market is optimistically discounting both Fed rate cuts in 2023 and durable growth. We view the likelihood of those outcomes playing out simultaneously as low. Finally, raising the debt ceiling could decrease market liquidity materially based on the substantial Treasury issuance our rate strategists expect over the next several months…
And from this same shop on global macro / RATES,
MS Global Strategy Mid-Year Outlook: Crunch Time
DM bonds, Asia equities, and USD outperform as policy stays tight to beat high inflation. Risks from growth, earnings, and policy are front-loaded. It's crunch time.
Crunch time: The next several months see the weakest DM growth, the most risk to US EPS, and the biggest uncertainties for liquidity through end-2024. Own the DXY and DM high grade bonds for defense. Play offense in Asia equities, where better macro dynamics support double-digit upside. Commodities lag.
Global equities – returns rise in the east: OW Japan and EM equities as better growth, lower inflation, easier policy, and reasonable valuations drive double-digit 12-month returns. US stocks lag as 2H23 earnings disappoint. Favor Japan, defensives in the US/EU, and healthcare globally. We see the S&P 500 at 4,200 by 2Q24.
G10 rates – the rally you've been looking for: OW government bonds as tighter DM policy slows growth and keeps yields in a downward channel. Convexity is attractive, with potential for lower yields in our economic bull and bear cases. We see 10-year UST at 3.30% and 10-year DBR at 1.60% by 2Q24….
AND from MS on the world outlook, economically speaking, at least THIS week
MS The Weekly Worldview: Of Pivots and Pauses
Central bank pauses are only as good as the data flow. Volatility of market pricing of the Fed makes that point in spades … as does the jobs report. The first pivot is only now arriving, the second one, toward cuts, is likely still months away.
In as far as POSITIONS go,
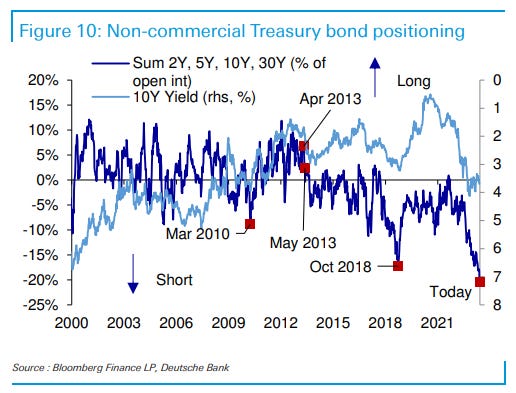
DB: CAD net shorts cut in half; JPY and Treasury net shorts advance
… Treasury net shorts increased in all maturities, taking aggregate net shorts to -20% of open interest, in excess of the 2018 peak of -17%.
In closing, a couple final notes / links offered yesterday morning. This first one summarizing mid-year outlooks which were dropping as the author hitting send
MS - Our Mid-Year Outlook: Soft Landing, Hard Choices
If all this feels unusual, it is. After the first year in 150 years where both US stocks and long-term bonds fell more than 10%, we near the mid-point of 2023 with a host of uncommon occurrences: US unemployment is the lowest since 1968. US core inflation is higher than in 1983 while US T-Bills yield the most since January 2001. The Fed and ECB have raised rates at the fastest pace in 40 years, the US yield curve is the most inverted in 40 years, the German curve is the most inverted in 30 years and G3 central banks are set to reduce their bond holdings at the fastest pace on record.
It’s into this mix that Morgan Stanley strategists and economists have spent the last several weeks debating the outlook over the next 12 months. We’ll publish a full discussion of these forecasts and what they mean for our investment recommendations in much more detail later today. Here’s a summary…
… Global markets
Better growth in Asia and avoiding recession in the US and Europe would be good developments. Yet despite this soft landing, DM growth is still soft and policy is still restrictive. Tight policy is tangible; any USD asset needs to return more than ~5.2% just to start beating risk-free cash over the next 12 months.
Moreover, many market risks appear front-loaded. The weakest growth, the highest inflation, the tightest policy and the largest shift in central bank balance sheets are all set to happen soon. It’s crunch time.
For investors, this also means making hard choices. A few that we’d highlight:
In government bonds, we think that duration in the US, UK and Germany perform well despite high inflation and poor carry, as slower growth and attractive real yields matter more.
In equities, we think that Asia can outperform despite the recent disappointment in China data. We see the highest global returns in Japan and EM equities. Both offer attractive valuations, further earnings growth and generally high FX-hedged carry.
For US stocks and leveraged credit, we see muted returns and defensive positioning despite a 'soft landing'. We think that this view is more consistent than appreciated; weak 2H23 growth can still drive earnings risk. High yields on USD cash simultaneously raise the hurdle for riskier assets, while also increasing pressure on more leveraged borrowers.
For agency MBS, we think that it means being bullish despite ongoing QT and FDIC sales. With valuations near GFC wides and expectations that yields decline, total returns are simply too attractive to pass up.
In sum, we think that our economic ‘soft landing’ will generally drive inflation-beating returns through 2Q24, but with defensive assets outperforming across the US and Europe, and high-beta working better in Asia. We think that USD does well as investors are drawn to its ability to offer both yield and defense. Commodities lag, given slow growth, a strong USD and poor carry. For much more, please keep an eye out for our Mid-Year Outlook.
AND then there’s this
Sunday Tea with BNPP: Extending the cycle
KEY MESSAGES
A string of stronger than expected labor market data suggest another Fed rate hike is likely coming.
A slower than expected deterioration of US economic data implies that the US yield curve can remain deeply inverted for longer.
The combination of even tighter monetary policy and a rapid withdrawal of liquidity this summer increases the risk that additional fragile parts of the economy crack. We like being short stocks with unsustainably high dividends.
Finally, from EPB
The BLS modeled that the economy added 339,000 jobs in May, much higher than consensus expectations. When the headline nonfarm payrolls number surprises strongly to the upside, it’s an uphill battle in the short run to fight the market momentum.
In this weekly update, we’ll look at all the same indicators and job baskets as we do after each monthly employment report to filter out the headline narratives and arrive at the true underlying business cycle trends.
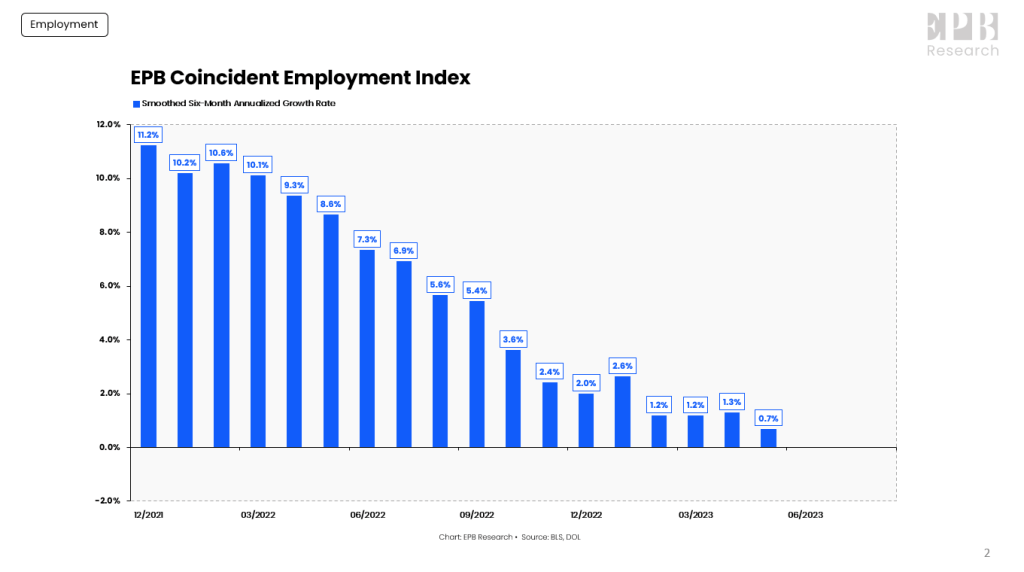
The Coincident Employment Index is a basket of five labor market metrics, including nonfarm payrolls, the employment level, and aggregate weekly hours. This composite index is preferable to only analyzing the nonfarm payrolls number because it incorporates both surveys of employment from the BLS and uses the insured unemployment rate from the Department of Labor.
On a smoothed six-month annualized growth basis, the Coincident Employment Index declined in May to 0.7%, the weakest growth rate of this cycle.
… So the main takeaway from the Coincident Employment basket is that the labor market is decelerating with a growth rate that is just on the cusp of turning negative, historically occurring only as the economy is in recession.
Despite this reality from a more reliable indicator of the labor market, the headline shock factor of +339,000 is a challenging narrative to dispute.
While the Coincident Employment Index has drifted to a 0.7% growth rate, the Leading Employment Index, a basket of six leading employment indicators, remains in contraction territory.
The Leading Employment Index has a more direct feedthrough to Cyclical Jobs such as construction and manufacturing.
Read all ‘bout it HERE…Sorry to leave on such a typical MONDAY MORNING tone but … well, into the blackout zone, we’ll all be searching for SOMETHING to do … evidence JPOW this past weekend
THAT is all for now. Off to the day job…



I'm in the Uber-HARD landing camp. For all the No-Landers I suggest giving David 'Rosie' Roseburg a listen on Wealthion from last wk. In 'Rosie's' own word's, "employment's a lagging indicator, first the hours get cut, which is already happening, and next to drop are the bodies'. As in 'unemployed bodies'. Always take 'Rosie' seriously IMHO!
Powell the Dead-Head? Wow I'd have never thunk. All about Pink Floyd myself, I think the song 'Pigs' applies to all of Powell's big-bank Boss HOGS in charge. Or better yet go Black Sabbath 'War Pigs'!