Good morning … putting aside NFP recaps and victory laps (see this past weekends notes / updates HEREand HERE),
China’s economy will quickly rebound and return to its normal path because of their optimised Covid 19 response and continuing financial support to households and companies, said party secretary of the People’s Bank of China, Guo Shuqing, to the People’s Daily published on Sunday.
… here is a snapshot OF USTs as of 705a:
… HEREis what another shop says be behind the price action overnight…
… WHILE YOU SLEPT Treasuries are modestly lower while outperforming their EGB/Gilt peers ahead of a decent week of sovereign supply (Citi's supply outlook). DXY is lower (-0.2%) while front WTI futures are notably higher (+3.6%) this morning. Asian stocks were all higher after Friday's rally here (Japan was closed for a banking holiday), EU and UK share markets are mixed (FTSE 100 UNCHD) to higher (SX5E +0.5%) while ES futures are showing +0.35% here at 6:45am. As for overnight flows, our London desk mentioned better buying out of Asia as prices slipped lower this morning. Treasury volumes were ~85% of average overall, despite Japan being out.
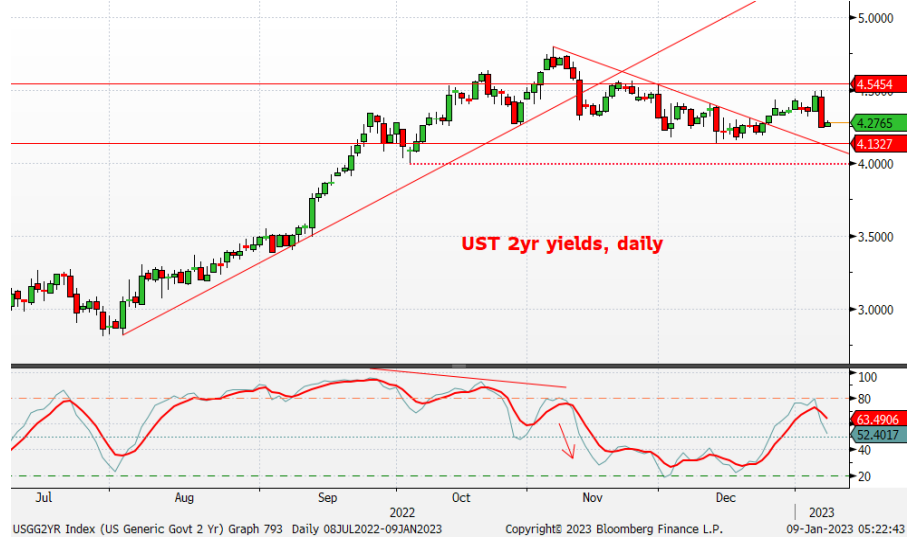
… Our fist attachment this morning looks at the daily chart of Treasury 2yrs to show how Friday's Key Reversal (new move high in yields Friday; close below the low yield prints of the prior 8 sessions) flipped momentum (lower panel) in favor of lower yields with 4.133% a next resistance and ~3.99% after that (dotted line).
… Out in the long-end, the daily chart of 30yr Treasury yields highlights the ~60bp range still present (roughly 3.40% below and 4.00% above; daily momentum still biased bullishly)
… Our last attachment this morning updates the mortgage refi chart (total refinancing, SWDA) to show how refi totals have fallen to levels last seen at the turn of the century- a presumed support, lol.
… and for some MORE of the news you can use » IGMs Press Picks for today (9 JAN) to help weed thru the noise (some of which can be found over here at Finviz).
In as far as Global Wall Street’s inbox goes (see this past weekends notes / updates HEREand HERE), here are a few additional things which have hit inboxes across the land which you might want to consider as you plan your trades and trade your plans…
First up a(nother) recap of NFP data from Paul Donovan of UBS offering up my least favorite angle. Specifically,
Friday’s US employment report will be revised, but the evidence could be a signal of some economic weakness ahead. The US has experienced very negative real wage growth—even when ignoring fictitious prices like owners’ equivalent rent. Consumers have supported living standards using credit and savings.
If the savings and credit resources disappear, in the absence of pay bargaining power the consumer may take on more work to stabilize their living standards. That breaking point may now have been reached. Employment participation rose, especially in lower income sectors (which is one reason average hourly earnings slowed). The share of people with multiple jobs leapt above pre-pandemic norms. Higher prices may be changing behavior…
From Donovan of UBS to Carpenter at MS with an updated,
The Weekly Worldview: Look East for Growth Relative strength of Asian growth is critical for the global economy to avoid a "technical recession". We do a quick survey of Saudi Arabia, India, Indonesia, Philippines, and China - the fastest growing economies in our coverage universe.
Same firm but on STONKS …
Weekly Warm-up: Can the Consensus be Right? With both sell and buy side consensus so aligned—i.e., weak first half, better second half—everyone is starting to wonder how this view could be wrong. We think it's in the magnitude of the move lower led by much weaker earnings and a Fed committed to fighting inflation, making 3,900 an easy sale.
… So we are left with the question: can the consensus be right about how 2023 will play out?
We think the answer is yes but that they will be wrong on the magnitude and rationale, which may inhibit their ability to monetize the swings we envision. More specifically, our biggest issue with the consensus view of a tough first half due to a mild recession, followed by a strong rebound, is how nonchalant people are about making this call. First, when we ask investors how low they think the S&P 500 will trade in a mild recession, most suggest 3,500-3,600 will suffice and the October lows will hold. This is in stark contrast to last October when most investors were in the low 3,000s camp— one of the primary reasons we decided to flip tactically bullish on October 16th. We find this change of heart peculiar since many investors are more bearish now on growth than they were in early/mid October going into 3Q earnings season. One rationale for these changing views amongst the consensus is that we are closer to a Fed pause, and that pivot will put a floor under stock valuations. The other reason we hear is that everyone is bearish and expects a recession so it won't be such a surprise when it arrives.
We would caution against those conclusions for several reasons.First, we recall similar views in August 2001 and 2008 immediately before the recession hit in earnest and the bottom dropped out on valuations. Second,valuations are not cheap at current prices, and a Fed pause will likely not lead to higher P/Es if growth is really rolling over. With the S&P 500 trading at 17x NTM EPS and a 10-Year UST yield of 3.55%, the Equity Risk Premium (ERP) remains way too low at just 233bps given the earnings risk we forecast. Third, recessions are usually accompanied by unforeseen shocks/events that cause valuations to overshoot to the downside. As noted in our work many times, the ERP rises significantly during recessions with 700bps not out of the question if there is true financial distress like in 2008-09. Since we are firmly not in the camp this is like 2008,a more "normal" rise of 400bps would be reasonable. However, we actually take a slightly more conservative approach, assuming a rise of only 200-250bps from current levels given the excess cash available and propensity of asset owners to want to own more equities in a higher inflation regime…
… It's also interesting to note that the ISM Services Price series, which has begun to decline meaningfully from peak levels, tends to lead CPI (Exhibit 5).
Hmmm … go on to read his compelling note / thoughts and, well, you might think there’s still some fundamental economic troubles just ahead … For a look at the other side of the coin, Goldilocks commods stratEgerist saying that perhaps it’s … just the weather?
The winter that wasn't. If there was ever a winter that macro markets were focused on it was this one as the tenuous gas balance in Europe and tight global oil markets left the entire commodity complex exposed to shifting weather. As this winter is shaping up to be one of the warmest on record for Europe, apparent in last week's 14-day ahead forecast showing the first three weeks of January as over 2 std warmer than normal. This unseasonable heat impacts not just Europe but also the US, where the January warmth is set to have twice the impact of the December cold (see Exhibit 2), driving down demand for all winter fuels significantly lower. In the past two weeks natural gas on both sides of the Atlantic collapsed by nearly 20%, with oil down 8.5%, and grains 3.8%. Oil demand is hit not only by the lost heating demand, but also by the lost gas-to-oil substitution in Europe with European gas price prices back to September 2021 levels at €70/MWh. Weaker energy prices then pulled down grains prices despite tightening Argentine supply. We estimate that the immediate spot demand hit to oil could be as much 1.5 million b/d and should European gas prices remain weak for the rest of this year, the extended loss of gas-to-oil substitution would lower our oil price forecast by $4/bbl for 2023. However, this doesn't take into consideration a faster reopening of China, a stronger underlying European economic outlook as a result of relaxed energy constraints and a more benign inflationary backdrop. We estimate a faster reopening of China is alone worth +$5/bbl on the 2023 oil price forecast. Accordingly, we maintain our 2023 bullish outlook on oil and commodities with this latest warm weather posing downside risks to our gas price targets.
And moving along FROM weather TO what others view as the core of the problem — this one from Barclays,
Macro House View Weekly: The core of the problem We see three clear trends at the start of the year: resilient demand, tight labour markets and stubborn core inflation
… In US rates, we maintain forward-starting steepeners to position for downside risks to the economy and turn neutral on paying 1y SOFR. In Europe, near-term risks are tilted to higher outright yields. In Japan, yields could remain elevated amid BoJ uncertainty (see below) but from mid-year we see them trending downward. The medium-term picture looks bleak for gilts, with heavy supply and inflation still high.
The big focus this week is US inflation (Thu). We expect headline CPI to have slipped 0.1% m/m SA (+6.4% y/y) while core inflation rose 0.3% m/m (+5.7% y/y), with core services (+0.5% m/m) and core goods (-0.1% m/m) continuing to move in opposite directions.
AND same shop on STOCKS,
Recession Risks Are Still Mispriced To assess investor positioning, we turn to our business cycle optimized equity baskets, finding that buyers remain convinced economic expansion can continue. This increases the risk of getting caught offside in the event of even a shallow downturn.
… Earnings estimates and valuations are still too high. Robust labor demand is a double-edged sword: while durable employment may provide an economic backstop, it can also exacerbate the sticky labor costs that are a key component of our negative operating leverage outlook for equities, making Street consensus 2023 EPS estimates ($228) look increasingly unrealistic. In this instance, earnings would turn out to be even worse than our base case estimates, but it may take several more months for this to be reflected in equity valuations. While equity multiples (17.0x) have come down and are closer to our fair value (15.0x), they are still disconnected from fundamentals, in our view, with the gap between ISM PMI and the equity risk premium at unprecedented levels.
From equity sellside stratEgery TO a more technical approach where some weekly candlesticks appear to be more helpful TO those who are bullish. Hedgopia
From stocks and earnings to the cost of HOUSING — A visual and short description from Francois Trahan (via LinkedIN)
Just updated this one and it is still the most bearish chart I can find on the equity market. I have posted it before and it sometimes triggers a few folks so be warned. It plots the annual cost of mortgaging the average house in the U.S. (a series that incorporates both interest rates and inflation) that is inverted and used as a leading indicator of the S&P 500's return. This is one that argues that 2022 was the appetizer and 2023 is the main course when it comes to equity prices. We shall see if it holds over the course of the year ... it's not always super precise but the trends are pretty good. March is when things start to fall apart according to this …
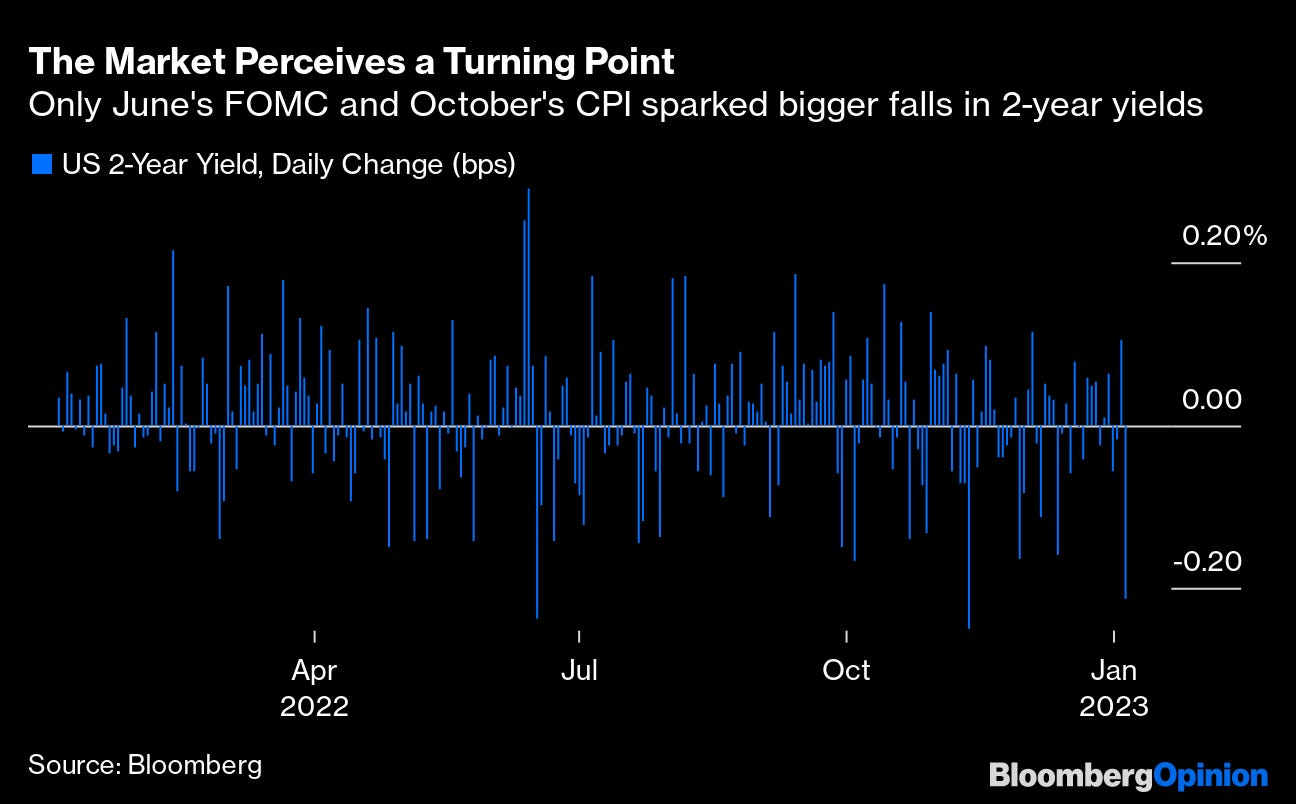
Finally, this morning’s view from John Authers / BBG on the Sharkonomy of particular interest (at least to me) as he details the yuge drop in 2yy,
There is relief in the cabin of the US economy as its pilots try to coax it in for a soft landing. Friday brought one of the biggest falls in two-year Treasury yields — a critically important measure and a barometer of where the market thinks rates are moving in the short term — since the Federal Reserve began its current aggressive tightening campaign a year ago. That’s because a soft landing looks more likely. But is that the right analogy?
One reader points out that pilots of the economy never get to come in to land. Their whole point is they have to keep it moving. That makes the economy more like the mythical Martlets, birdswithout legs who are doomed to fly forever. Or, more menacingly, the economy is like a shark, which — as everyone who’s seen Jaws will know — has evolved to eat, move and reproduce, even if it’s not as simple as an “eating machine.” Stopping, or landing, isn’t an option — and just as a bigger shark requires a bigger boat, bigger shocks to the economy require a bigger response to keep moving.
Only the June meeting of the Federal Open Market Committee, which came after the Fed had controversially leaked its intention to hike by 75 basis points in advance, and the announcement of the consumer price index data for October, which showed the first unambiguous reduction in inflationary pressure, provoked bigger downward shifts in yields:
What was such a big deal to move the market this much? The Non-Farm Payrolls data for December came in almost exactly in line with expectation, but the separately calculated unemployment rate unexpectedly fell back to equal a low not seen in more than half a century.
… The problem is that strength like this tends to imply that more aggressive intervention from the Fed will be needed to quell inflation. And indeed, if we look at the way the two-year yield moved during Friday's trading, the unemployment data only accounted for about 10 basis points of the 25-basis-point fall:
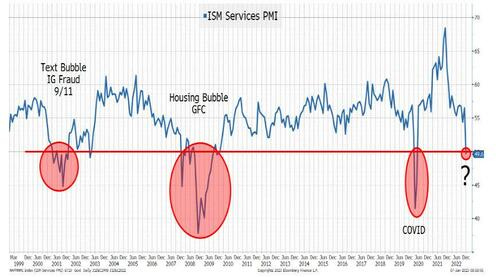
The 10 a.m. release of the latest non-manufacturing, or services, ISM survey of supply managers appears to have been more influential — and that was with good reason. Whatever the jobs numbers suggested about underlying strength, the ISM numbers suggested that the services sector was sharply and surprisingly dipping into recessionary territory. It fell below the 50 level that signals the division between recession and expansion for the first time since the Covid summer of 2020:
We entered the year with asset allocators largely braced for a rare year when bonds outperformed stocks. Since November 2020, when the impressive results from vaccine trials convinced investors that an end to Covid disruption was in sight, stocks have been in a persistent upward trend compared to bonds. During the horrors of 2022, bonds managed to fall enough to keep that trend intact. But if we take the most popular exchange-traded funds tracking the S&P 500 (ticker: SPY) and Bloomberg’s index of 20-year and longer treasuries (ticker: TLT), that upward trend appears to be in danger:
Is a situation in which the services sector appears to be lapsing into a recession really such a great environment for the stock market? It’s hard to argue that it is. Plainly, the prospect of lower rates helps, and it’s the companies with the highest “duration” (whose earnings are furthest into the future and therefore are most sensitive to interest rates) that fared best on Friday. The logic behind this isn’t as strong as it might seem as AQR’s Cliff Asness pointed out last year, but for the time being, it is an ingrained habit to buy big tech stocks when rates fall. It might be dangerous to bank on this continuing if the economy lapses into an outright recession…
For a somewhat more sobering ECONOMIC view of the USofA, Tchir via ZH
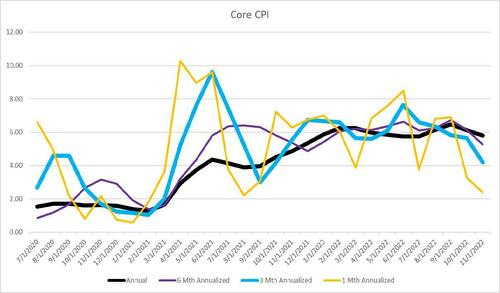
… I fully expect that after we get Thursday’s CPI data, we will realize that Q4 Core Inflation is running at an annual rate of right around 3%! That is darn close to mission accomplished. October was 0.2 and September was 0.3, so another 0.3 would put us at a 3.2% annualized rate (which is declining as more of the past policy and market responses filter their way into the data). We looked into this in more detail in 2+2=5, but I think that we are making a huge mistake by talking about annual inflation rather than annualizing recent inflation data.
Even I don’t suggest annualizing monthly data, but even that is probably more useful than thinking about annual data given what has occurred in policy making/markets over the past 12 months!
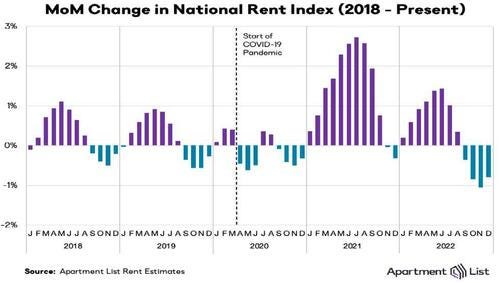
A Word on Housing (or at least a picture or two)
Thanks to Andrew Brenner for turning me onto ApartmentList.com. It meshes well with Zillow data and other contemporaneous measures of rent that I’ve been harping on.
…Last, but Certainly NOT Least!
Jobs data was solid across the board, but most of the other data was weak. One piece of data in particular struck me as jaw-droppingly weak and important!
… Bottom Line
I think that the economy is headed into a problematic recession.
I think that the Fed has already set this process in motion.
I’m trying to thread a needle by being tactically bullish for the head-fake “soft landing” trading ahead of the real risk-off move to follow shortly thereafter.
At least no one can say that the first week of 2023 was dull! This could be another long year.