On this day; 20yy; S&P (infl adj); TEMP services jobs; ISM new orders; financial curve; RoW > US
Good morning.
On this day,
… January 8, 1835, President Andrew Jackson achieves his goal of entirely paying off the United States’ national debt. It was the only time in U.S. history that the national debt stood at zero, and it precipitated one of the worst financial crises in American history.
The elimination of the national debt was both a personal issue for Jackson and the culmination of a political project as old as the nation itself. Since the time of the Revolution, American politicians had argued over the wisdom of the nation carrying debt …
This via History.com
So, 188yrs ago today, the USAs national debt reached ZERO POINT ZERO for the first time … I’d like to HOPE it will happen again sometime in the future BUT I’m not holding my breath …
Yesterday, I updated some thoughts from Global Wall Streets inbox and had a visual of 20yy DAILY …
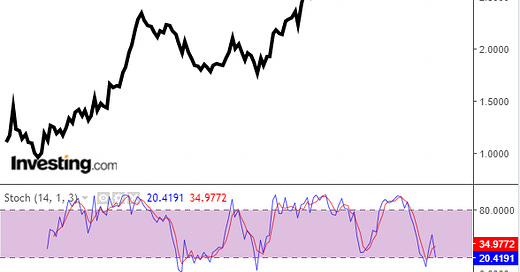
This morning I wanted to take a moment and offer a WEEKLY look at 20yy (again, I’m doing so because the 20yy is one of the Foxy Five from Citi) and I’d note some triangulation taking place so it would seem to ME that as yields are declining, they are doing so within a higher yield framework …
With the current WEEKLY look, I’d also note weekly momentum becoming stretched (ie overBOUGHT) so some sort of bond market PAUSE (that refreshes) might be in order…Especially if equities continue to perform.
On THAT (equity related) note, here’s a look at S&P500 (inflation-adj) via Chart Of The Day,
The long-term trend of the S&P 500 is being challenged.
The current long-term rally began in early 2009 following the financial crisis and has traded within the confines of an upward sloping trend channel ever since.
So where does this benchmark index stand now?
Today’s chart illustrates how the S&P 500 is currently testing support (green line) of its long-term trend channel.
It would seem to ME that IF (when) support breaks (we’ll redraw lines and find NEW support) and bonds will maintain (perhaps get MORE of a) bid — thanks in part to the large short base out the curve.
At risk of repeating the idea of an economic pound of flesh yet to be taken OUT of markets (think about market reflex at 10a Fri), here’s a look at SLOWING US TEMP help - SERVICES, also from Chart of the Day,
Two questions…
How is the job market?
How is the economy?
Today’s chart helps answer those questions by illustrating U.S. temporary help services (temp jobs) since 1990.
Notice how temp jobs peaked in July — early signs of a softening job market.
Also, notice how temp jobs have tended to decline prior to the beginning of recession.
A leading indicator of sorts.
It is worth noting that the current temp job decline is greater than what occurred immediately following previous pre-recession temp job peaks.
Something to watch going forward.
And since we’re on topic of economic funduhmentals, kindly direct some attention TO latest EPBMacros Chart of the Week
His weekend update offers slightly more detail,
The ISM Services Index was also reported for December and also dropped below 50, which means, according to the ISM data, both manufacturing and services are now contracting.
The ISM Services New Orders Index collapsed to 45.2, the same as the manufacturing index.
If we take the average of ISM manufacturing new orders and ISM services new orders, we see a reading that is only consistent with past recessionary periods, which starts to paint a convincing picture that recessionary conditions potentially starting in December 2022 is highly possible.
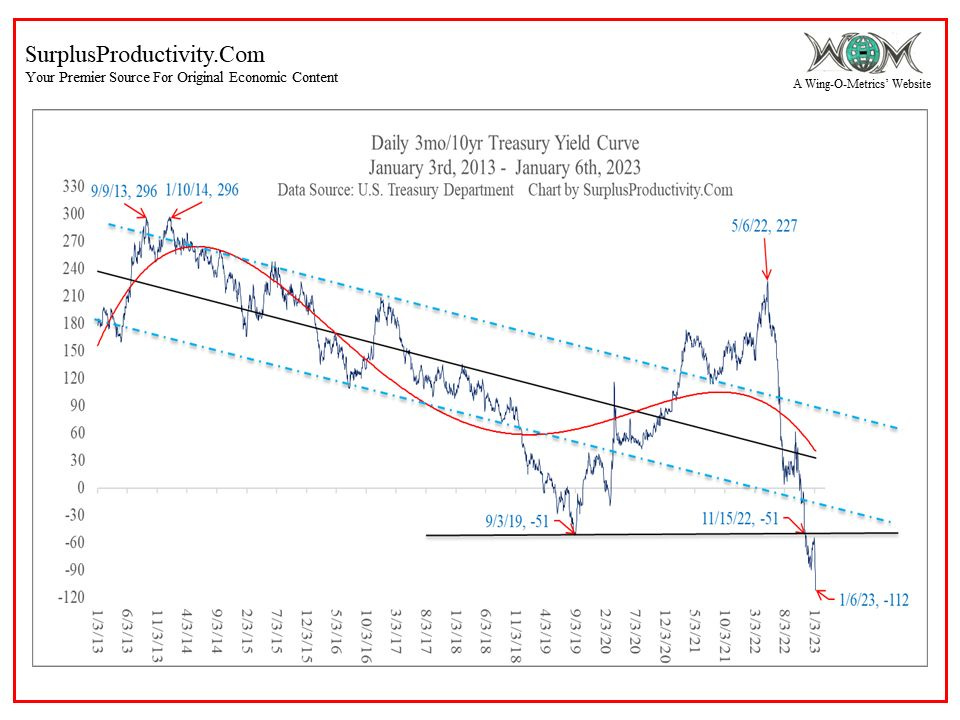
Coincidentally, one of the fan fav YIELD CURVE indicators — the financial (ie 3mo10yr) yield curve via Paul Winghart of SurplusProductivity.com fame / fortune and via LinkedIN
… It is pretty clear to tell that the odds of the Fed continuing to misread the employment situation-as an indication of future strength in demand rather than what it is, pressure on labor to be cheaper - and thus amplifying a serious risk to liquidity, just increased...by a lot. #employment #treasuries #yieldcurve
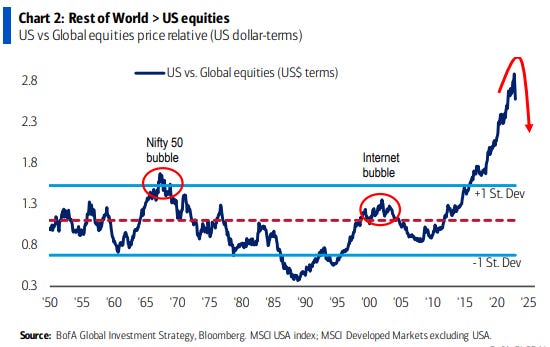
Finally, with economic FUNduhMENTALS, curve signals and positions in mind, before the clock strikes noon (here on the East coast), this weekends ‘Sunday Start' reiterates one of the themes noted Yesterday, ( thoughts from Global Wall Streets inbox ), specifically where BAMLs latest flow show “Buy the World” — noted / suggested that RoW equities set to OUTPERFORM USofA
Important distinction // difference between BAML and MS is that this mornings ‘Sunday Start’ suggests similar but ADDS,
… It's important to keep this in mind. In a still-tough US equity environment, we think that RoW equities will do better (despite historical ‘beta’), boosted by attractive relative valuation, carry and momentum. We also like Mexican assets and see the economy as a structural winner in a multipolar world (see Mexico's Nearshoring Opportunity & Challenges Amid a New Era of Geopolitics, October 21, 2022). And we think that high grade bonds will do well, helped in part by real yields that have risen back to their highest levels since 2009. We see high grade bonds outperforming equities in the US and Europe, and also returning to a much more diversifying role within cross-asset portfolios (see Cross-Asset Dispatches: What Will Markets Return? 2022 Edition, December 10, 2022).
Higher REALZ and decent QUALITY FIXED INCOMEwill once again resume delivering some portfolio insurance (perhaps the longer-end RETURNS mean revert (see tweet referenced HERE).
In other words, perhaps the reports of 60/40 demise has been greatly exaggerated?
Enjoy what is left of your weekend and asking, for a friend, if this is true
If NOT, Happy New Year and all best for 2023!!


