(USTs lower on above avg volumes)while WE slept; 'trader makes bet USTs get slammed'; BTFP-Fed Arb continues to offer 'free-money' (ZH) and somewhat more...
Good morning. Not very much ‘insight’ I could pretend to add here / now ahead of the first ‘all important’ jobs report of 2024. I’m NOT gonna try to fake that. I will hope to be back over the weekend with some sort of competent update and in the meanwhile, I’ll just say happy / healthy new year to all and welcome to any / all new folks who’ve happened to stumble upon this spot on the intertubes (and have so far, stuck around … clearly you have issues — and thats likely WHY we’ll get along :) ) …
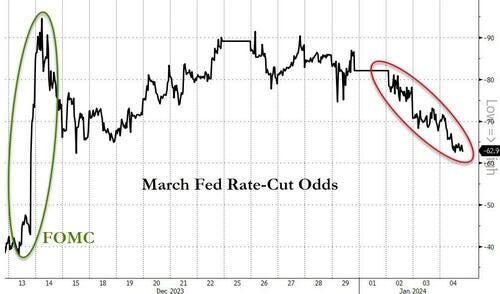
I’m NOT all of a sudden going to say I’m an ADP National Employment Report believer BUT I AM just saying what I’ve said in the past is that I continue to disagree WITH 150bp (or more?) of rate CUTS PRICED. CME Fedwatch tool … where you can see yesterday morning BEFORE the data …
… AND TODAY, as of about 5a …
… perhaps the difference is small but the point IS, well, I’m clearly NOT alone in MY disagreement. It continues,
Bloomberg: Trader Makes Massive Bet Treasuries Will Get Slammed After Jobs Report
Wager targets 10-year yield rise to 4.15% before Friday close
Decent ADP jobs data Thursday raises bar for December payrolls
The options market for US Treasuries was abuzz Thursday following the emergence of a large bearish wager that Friday’s jobs report will trigger the biggest backup in benchmark yields in more than nine months.
The trade targets a surge in US 10-year yields to as high as 4.15% by Friday’s close of business, or a jump of about 0.15 percentage points from Thursday’s closing level. That would mark the biggest one-day rise in 10-year yields since late March and a further retrenchment for Treasuries, which have had a rocky start to the year after ending 2023 on a winning note following a furious two-month rally.
The timing of the bearish bet comes just ahead of the December jobs report, due at 8:30 am New York time Friday, with expectations rising for a robust readout. Separate data released Thursday showed hiring by US companies ramped up in December, while first-time jobless claims fell in the latest week, the latest signs of a resilient labor market…
For (somewhat) more, see Bloomberg WEEKLY rates column,
Bloomberg TheWeeklyFix: Big wager on a bad US jobs report for bond bulls (remarking on the aforementioned visual OF what is being wagered on as well as money market mutual funds having ADDED $1tr … since MARCH)
… While a 15 basis point move would be dramatic — that would rank as the biggest backup in yields since March — history is on the trade’s side when it comes to the direction of travel. Bloomberg data shows that 10-year yields were higher in the six hours following the release of the US jobs report eight out of the last 12 months …
…The Sidelines Are Sticky
Death, taxes, money-market fund flows.
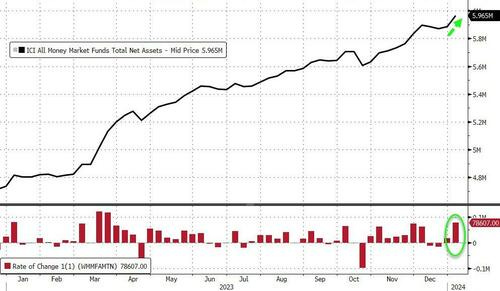
Even with all the hand-waving over reinvestment risk and interest rates coming down, cash continues to attract fresh capital. Assets in money-market funds rose to yet another all-time high in the week ended Jan. 3, clocking in just a hair below $6 trillion, according to Investment Company Institute data.
Many a bullish case for stocks has been built upon that cash pile — that the equity market will be supercharged by cash coming off the sidelines. That nearly $6 trillion hoard represents dry powder ripe to be redeployed once central banks begin cutting rates, Barclays strategist Emmanuel Cau wrote in a note last week. UBS Asset Management floated a similar thesis in the firm’s 2024 outlook, saying that investors exiting cash in favor of risk assets “could catalyze much stronger performance” than consensus expects once short-term yields decline.
But where the cash is coming from matters. For example, Deborah Cunningham of Federated Hermes estimates that at least 80% of the nearly $1 trillion that’s poured into money-market funds since March’s financial system woes represents depositors leaving banks, rather than people waiting for entry points in equities and credit.
Miller Tabak + Co’s Matt Maley shares that view.
“With a lot of that cash coming from banking accounts, it’s the money that people will use to meet their regular expenses. In other words, it’s not available to move into the stock market,” said Maley, the firm’s chief market strategist. “That doesn’t mean there won’t be some some money rotating into stocks next year, but we also have to remember that those money market account rates are still a lot more competitive than they were in 2020 and 2021.” …
Whatever. Moving right along and TO some recaps and victory laps of yesterday …
ZH: Manufacturing Jobs Decline In Latest ADP Report, Services Soar
ZH: Initial Jobless Claims End 2023 At Year Lows
CalculatedRISK: ADP: Private Employment Increased 164,000 in December
CalculatedRISK: Initial claims: the return of “almost nobody is getting laid off”
CalculatedRISK: Weekly Initial Unemployment Claims Decrease to 202,000
… shaking it all up what do you get? Well, to begin with a(nother)down trendline being laid to waste and this time on the 5yy (and so, getting closer TO the all important, front-end driven by rate CUT HOPES) …
I’ll follow up over weekend with NFP recaps and victory laps (1st of the new year!! woo hoo!) and have a look at some longer-term (ie weekly, MONTHLY) setups but how about that move in DAILY MOMENTUM (stochastics) … from overbought to OVERSOLD in a click …
Perhaps that ‘trader’ fading rate cuts via OPTIONS was on to something and perhaps … just maybe … he’ll have put some hay in HIS barn BEFORE DATA PRINT (?) and let it be festivus for the restofus, as those remaining IN markets fight it out trying to pick up pennies in front of the steamroller??
Rate CUTS they say … on that idea of rate cut HOPES …
ZH: 'Goldilocks' Gored By Growth Gains; Bitcoin Bounces As Rate-Cut Hopes Hammered
Strong jobs data (ADP jobs added more than expected, slowing wage growth, and initial jobless claims at 2023 lows) and strong Services economy survey data (PMI at 5 month highs) prompted higher Treasury yields today, and sent rate-hike expectations tumbling for March...
AND … here is a snapshot OF USTs as of 705a:
… HERE is what this shop says be behind the price action overnight…
… WHILE YOU SLEPT
Treasuries are lower, tracking similar downside moves in the UK and EU once again ahead of US employment and service sector activity numbers. DXY is higher (+0.3%) while front WTI futures are higher too (+0.8%). Asian stocks were mixed, EU and UK share markets are all lower (SX5E -1%) while ES futures are showing -0.3% here at 6:55am. Our overnight US rates flows saw a modest drop in Tsy prices during Asian hours with at least two block sales in FV futures weighing. In cash, real$ names bought 10yrs while the front-end out to intermediates saw better selling. During London hours we saw better fast$ selling in 3yrs alongside some position squaring. Overnight Treasury volume was ~115% of average.
… and for some MORE of the news you can use » The Morning Hark - 5 Jan 2024 and IGMs Press Picks (who CONTINUES to be sportin’ that new, fresh look) in effort to to help weed thru the noise (some of which can be found over here at Finviz).
Moving from some of the news to some of THE VIEWS you might be able to use… here’s SOME of what Global Wall St is sayin’ … and while TODAY is NFP day (tomorrow or at some point over the weekend I’ll create / send some sort of recap and victory lap), take this all, as always, with a large grain of salt …
Argus: Stocks Now the Undervalued Asset Class (hold the presses … rates drop enough and all a sudden, who’d a thunk it, no longer as competitive … also could be combo of rates AND stocks down so yield of stocks makes them … well, read ..)
Stocks Now the Undervalued Asset Class
Our stock/bond asset-allocation model, which we call the Stock-Bond Barometer, has reversed conclusions in the past month and now indicates that stocks are the asset class offering the most value at the current market juncture. In large part, the changed reading reflects the substantial move lower in interest rates. Our model takes into account current levels and forecasts of short-term and long-term government and corporate fixed-income yields, inflation, stock prices, GDP, and corporate earnings, among other factors. The model output is expressed in terms of standard deviations to the mean, or sigma. The mean reading from the model, going back to 1960, is a modest premium for stocks of 0.16 sigma, with a standard deviation of 0.98. The current valuation level is a 0.12 sigma discount for stocks, which is now below fair value and down sharply from a 0.85 sigma premium at the end of 3Q. Other valuation measures also show reasonable multiples for stocks. The current forward P/E ratio for the S&P 500 is approximately 18, which is within the normal range of 10-21 and down from 23 at the end of 2021. And the current S&P 500 dividend yield of 1.5%, while below the historical average of 2.9%, is up from an ultralow 1.2% (also in 2021). Looking ahead, we expect the results from our valuation model to continue to improve, as interest rates decline in 2024 and EPS growth picks up. Based in part on the output from our Stock-Bond Barometer, our current recommended asset-allocation model for moderate accounts is 70% growth assets, including 68% equities and 2% alternatives; and 30% fixed-income, with a focus on core and opportunistic segments of the bond market. On duration, we recommend focusing on the short end of the curve.Bespoke: A Whole Lot of Nothing (a big fat nuthin’ burger, eh…)
A Flat Two Years
The S&P 500 is still within 2% of its record closing high reached exactly two years ago yesterday, but beneath the surface, there have been some big moves. The chart below shows a distribution of two-year returns for every S&P 500 stock that is currently in the index, and while there have been some big winners and losers over this period, the average component’s move has been just a modest decline of 0.54%. So while the S&P 500 is down 1.9% from its high, over that same period, the ‘average’ stock in the index is down even less. For all the talk over the last year about how narrow the market has been, over the last two years that hasn’t been the case.In the tables below, we show the 25 best and worst-performing stocks in the S&P 500 over the last two years …
DB: Trading the US employment report
… As always, there will be three main market-moving elements to the data. The NFP numbers, of which Figure 1 highlights the rarity of a downside NFP miss. Secondly, average hourly earnings, which has often been the dominant driver of the market reaction as seen in Figure 2, and, the U3 unemployment rate from the volatile household survey, that ranks as the third most influential piece in the payroll report, as per Figure 3. In December, seasonal adjustment changes going back 5 years will also detract from some of this U3 usefulness. As always, a holistic approach to assessing the report is needed, and the market will be prone to look at three-month averages of both NFP, earnings, and aggregate hours worked for better clues on multi-month trends.
On strong data, the 10y yield is seen backing solidly into the 4%-4.33% range, with the 2y above 4.5%…
Goldilocks: ADP Employment Above Expectations in December; Jobless Claims Decline More Than Expected (these analytical reports just ahead of the biggie NFP seem incrementally useless to ME but … )
BOTTOM LINE: According to the ADP report, private sector employment rose by 164k in December, 39k above consensus expectations and led by an increase in the services sector. ADP outperformed other Big Data employment indicators in December, and the strength in construction jobs is consistent with a boost from mild winter weather. We left our nonfarm payroll forecast unchanged at +190k ahead of tomorrow’s release, above consensus of +171k. Initial jobless claims declined by more than expected.
Goldilocks: December Payrolls Preview
We estimate nonfarm payrolls rose 190k in December (mom sa), somewhat above consensus of +175k. Our forecast reflects a favorable swing in the December seasonal factors worth roughly +50k and a boost from mild winter weather, as snowfall was minimal in major cities in the Northeast and Midwest. While Big Data employment indicators indicate lackluster hiring, initial jobless claims fell further, consistent with fewer end-of-year layoffs. On the negative side, we assume another sizeable decline in retail payrolls, reflecting soft brick-and-mortar spending trends during the holiday season.
We estimate that the unemployment rate was unchanged at 3.7%, compared to consensus of a rebound to 3.8% and reflecting flat-to-up household employment following its sharp jump in November. We assume labor force participation was unchanged at 62.8%. We estimate a 0.30% increase in average hourly earnings (mom sa) that lowers the year-on-year rate by one tenth to +3.9%, reflecting waning wage pressures but a 5-10bp boost from calendar effects (consensus is also +0.3% / +3.9%).
Goldilocks: How Concerned Should We Be About the Narrowing Breadth of Job Growth?
… Many observers worry that the narrow breadth of job growth indicates either excessive cooling of labor demand or a potential job-worker mismatch problem, but we are less concerned. First, the three industries that have dominated hiring are not small—they account for 40% of employment—and industries accounting for 70% of employment have continued to add jobs on net. Second, job openings are above their 2019 levels in nearly every industry, suggesting opportunities remain plentiful for almost all workers. Third, the distribution of job gains across industries is well explained by tighter financial conditions through 2023Q3, and financial conditions have since eased significantly. Fourth, a few industries that reduced headcount as demand normalized from elevated levels during the pandemic will likely restart hiring in coming months.
Our explanation for the concentration of hiring in a few industries is that understaffed industries where output per worker was furthest above trend—especially healthcare—increased wages by more than other industries in 2023 and hired the most workers. This means that their dominance of recent hiring is not incompatible with labor demand still being strong in other sectors—they were simply in greater need of workers and paid up to attract them. Moreover, this catch-up hiring has room to run …
RenMAC: Dutta’s Economic Daily (from Tuesday, but still…)
Six cuts seem like too many
Futures market sees six cuts; we’re skeptical
The futures market sees the Fed cutting rates six times in 2024 with even a ten percent chance of a rate cut at the end of this month; I am not so sure. The US data don’t justify that sort of move. The Fed is cutting rates this year to recalibrate monetary policy due to slower inflation, not because economic activity is collapsing. The New York Fed’s Weekly Economic Index (WEI) rose to 2.92% for the week ending December 23. Over the last four-weeks, the index is averaging 2.23%. Recall that the index is a composite of ten weekly series mapped to the year-over-year growth in real GDP.UBS: Initial claims slide, ADP tops estimates
…ADP beats estimates; we still expect an above consensus Dec NFP gain
ADP estimates private employment moved up 164K in December, above consensus expectations for 125K. Note that in our preview of this data we noted last year the ADP data posted a pick-up in December, which posed upside risks this morning. The ADP data in 2024 has been following a similar seasonal pattern to 2023. In the event, the 63K acceleration reported this morning is not much different than the 50K-ish acceleration in December 2023. We also noted that year-to-date the correlation coefficient between the change in private employment in the BLS data and the ADP data is -0.3, so the two series are not even positively correlated.Thus, the ADP report has no bearing on our expectations for an above-consensus 180K increase in private payrolls in December, and a 210K increase in total nonfarm payroll employment. The current consensus in the Bloomberg survey is for a 171K advance. We previewed the employment report and walk through the seasonal adjustment risks in the Week Ahead section of Friday's US Economics Weekly.
UBS (Donovan): Employment, inflation, and the price of a Pepsi
… It is US employment report Friday—when an increasingly unreliable survey of people who are prepared to tell an telephone caller all about their private life is published. The consensus forecasts are unexciting—essentially static unemployment and average hourly earnings (employing lower-paid seasonal workers may give some downside to average earnings, because average earnings are not wages).
The US inflation cycle has had relatively little to do with labor markets—real wage growth was negative for a long time. The growth implications should be consistent with a softer landing for the economy. Today’s report is (again) likely to confirm investors’ preconceived biases about Fed policy…
UBS: December CPI Preview: A little less progress (CPI is NEXT Thurs … this too soon? too bad too sad…I’ve included a visual which i’ve touched up a bit and askin’ for a friend …)
… Risks slightly to the downside
As always there is significant uncertainty surrounding the inflation data and we would not be surprised to see the core CPI increase anywhere from 24bp to 39bp. Our forecast is toward the higher side of this range, and we think the risks are tilted slightly toward the downside with the recent weakness in core non-transportation goods and some core non-rent services possibly proving persistent than we have accounted for in this month's projection.Smaller CPI increase in January…
December CPI will probably not change the FOMC trajectory
If our projection is correct and the December CPI surprises to the upside of consensus, we do not think it will alter the FOMC trajectory. Inflation has slowed notably faster than the FOMC was thinking over the summer, and it will take far more than one strong CPI print to change that. More importantly, even with the solid core CPI increase in December we expect the 12-month change in Fed's preferred core PCE inflation measure will step down roughly 13bp, which would see it declining from 3.2% (3.16%) to about 3.0% (3.03%) when the December data is brought in. The larger step down in core PCE inflation compared to core CPI inflation is a result of different base effects and the smaller weight of rents in PCE prices.UBS: US Equity Strategy Market Down… but Don't Blame Rates
Conventional wisdom holds that Nasdaq 100's 19.5% year-end rally was fueled by falling rates. By extension, many are attributing the recent selloff to a reversal in Treasury yields, and are questioning whether a further backup in rates would spell trouble for stocks.
As the exhibits below highlight, the market appears to be much more sensitive to changes in risk metrics—such as high yield spreads and the Vix—than rates themselves. These relationships hold for both the S&P 500 and Nasdaq, but are more pronounced for the latter
… And from Global Wall Street inbox TO the WWW,
AllStarCharts: T-Bonds Stall at Resistance
US treasuries finished 2023 with a bang, hitting our initial targets before Christmas.
But the long-bond trade is losing its luster.
Resistance is now coming into play as the bond market catches its breath…
Check out the US Treasury Bond ETF $TLT with a 200-day simple moving average:
I’m not a big fan of moving averages. I don’t like how they distract from price and create extra noise on the charts.
Regardless, many market participants track the long-term moving average. Bond bulls are shouting their battle cries as TLT peaks its head back above the 200-day mark.
So, is it time to get long bonds?
No!
The 200-day moving average is still sloping downward when we take a step back with a weekly chart:
US T-bonds remain in a structural downtrend. Plus, momentum holds within a bearish regime.
Now is not the time to buy bonds.
Mean reversion traders are licking their chops at these levels (price is hitting resistance as the 14-day RSI prints its highest reading in almost two years) as they flip their books short bonds.
I’ll pass on this one. It doesn’t fit my personality. The bond market will likely chop sideways during 2024 – not my cup of tea. (I prefer a pu-erh or a delicate sencha.)
I wouldn’t argue if you shorted TLT against last month’s pivot high – or if you took a long position on a decisive close above 100.
Both make sense, as two things can be true.
Nevertheless, last season’s tactical bounce in bonds has run its course.
Now it’s time to practice patience and remember no position is a position.
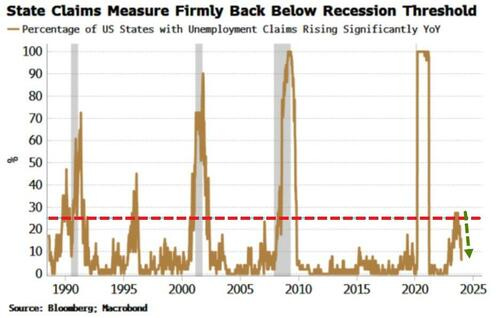
Bloomberg (via ZH): Claims Data Confirm Receding Recession Risk (i know i know, gotta skate to where puck is gonna be … but 6 rate cuts?)
… This cycle, state claims were an indication that a downturn was on its way, but the measure has now decisively fallen back below the recession threshold -- similarly for continuing claims.
Claims are a more reliable indicator of job market health than JOLTS (which came out on Wednesday), which has a very low response rate and sample size.
The inflection lower in claims also supports a positive skew to Friday’s payrolls data.
Recession risk is likely to mount as the year wears on, as the cumulative impact of higher rates increasingly bites.
But today’s data is another evidential bit of the jigsaw that recession risk is retreating for now.
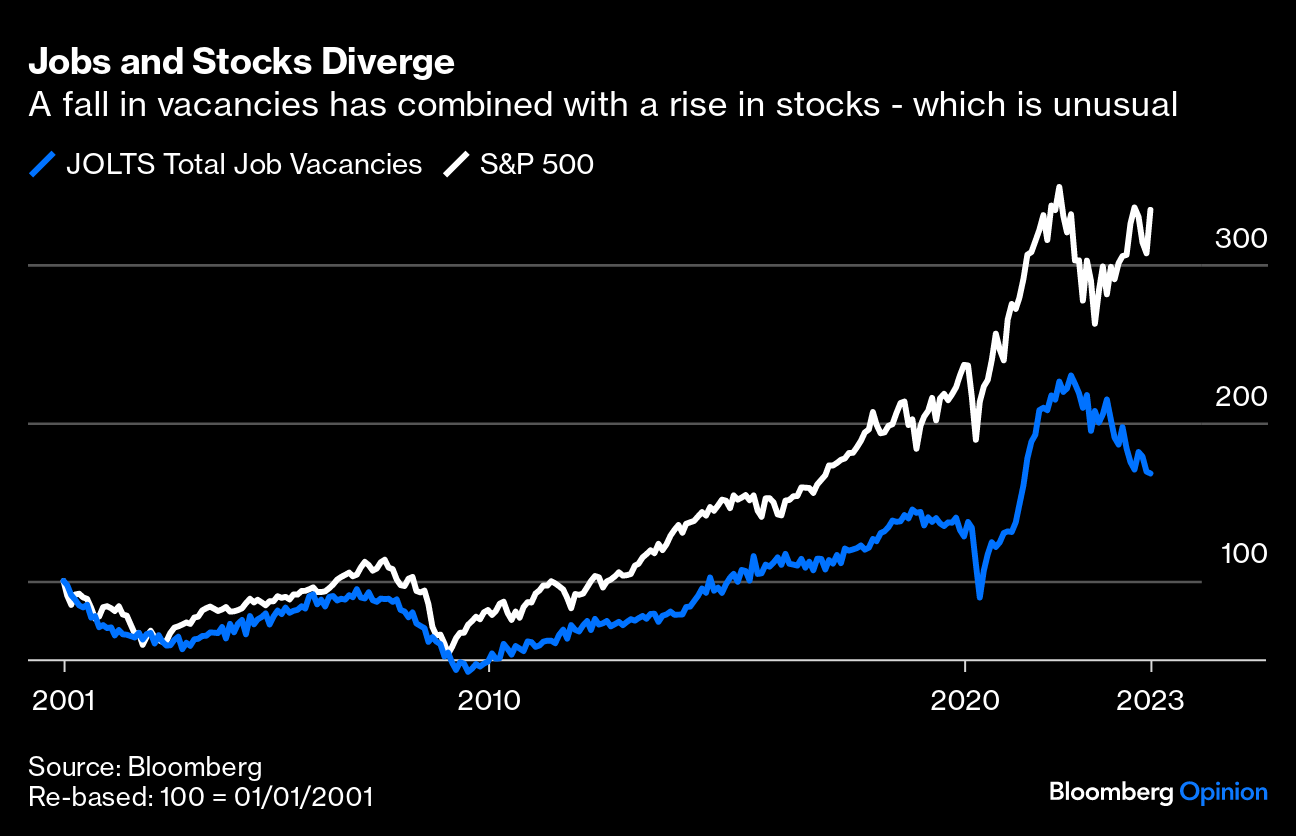
Bloomberg: Might as well throw jobs data against the wall (Authers’ OpED as counter TO the above, a visual of JOBS AND STOCKS)
… Meanwhile, despite the ritual excitement over the payrolls numbers on the first Friday of each month, stock markets are at least implicitly treating the JOLTS data, in particular, as though it can be ignored. If we compare the total number of vacancies shown in the survey since 2001 with the S&P 500, it’s clear that they tend to rise and fall together. When businesses are trying to expand their workforce, it makes sense that share prices would be rising. But there has been a complete parting of the ways over the last year or so. A retreat from an all-time high in job vacancies has coexisted with a rally for the S&P 500:
On the assumption that investors aren’t just dismissing the whole report, other explanations can be a tad concerning. To the extent that the JOLTS data can be relied on, Troy Ludtka, also of SMBC Nikko, points out that much of the decline in vacancies comes from cyclical sectors such as retail, accommodation and food services, and manufacturing. On its face, it really does suggest the economy is moving into a cyclical decline. All else equal, that shouldn’t be good for stocks. Ludtka suggests this must be predicated on expectations of “a productivity upswing, further fiscal expansion, and/or a reversal in Fed tightening.” He questions whether these expectations are reasonable. I would say that falling vacancies are plainly seen primarily as a reason to expect easing by the Fed. While that’s reasonable to an extent, the hopes being piled on it look excessive — particularly as the data may not be totally reliable.
There are plenty more unreliable data to go around on jobs.
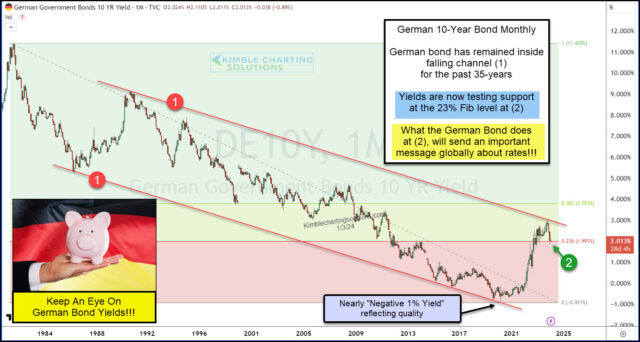
Kimble: German Bond Yields Reach Sink or Swim Moment? (what happens here may very well impact UST yields and so …)
Just as interest rates are pulling back, one particular government rate appears to be nearing an important moment.
The 10-Year German Bond yield.
Above is a long-term “monthly” chart of the 10-year German Bond Yield. As you may recall, this bond was the only bond of the G8 countries to yield a -1% yield at the 2020 lows. Yikes!
Currently, this yield has reversed lower from the topside of falling channel resistance (marked by each 1).
The decline currently has German bond yields trading into a very important support area that global investors may want to watch closely: the 23% Fibonacci support level at (2).
What the German Bond does at (2) will very likely send a message globally about the direction of interest rates!
ZH: Bank Bailout Fund Usage Just Keeps Soaring, Money-Market Funds Biggest Inflow Since SVB Crisis (there’s something happenin’ here and what it is ain’t exactly clear BUT Bill DUDS did speak to it yest? or am I conflating situations??)
… Money-market funds saw massive inflows in the week-ending Jan 3rd, jumping $79BN to a new record high just below $6TN...
Source: Bloomberg
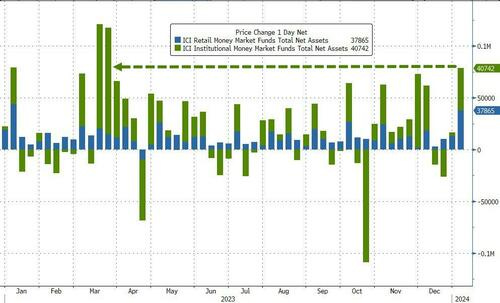
Both institutional and retail funds saw large inflows (+$40.7BN and +$38.9BN respectively) for the biggest combined inflow since the SVB crisis...
Source: Bloomberg
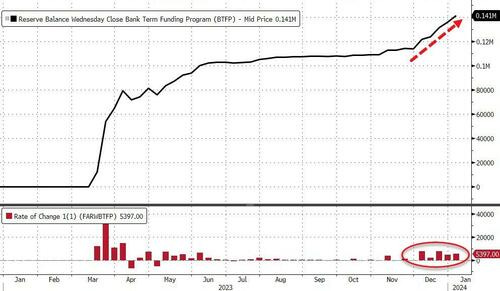
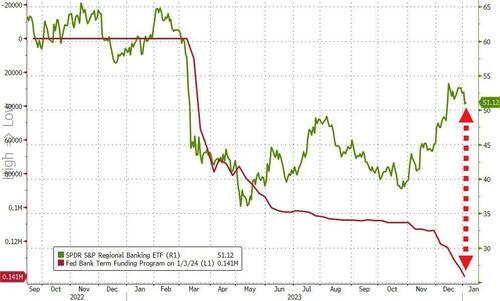
… Usage of The Fed's BTFP bank bailout facility surged by over $5BN to a new record high of $141BN...
Source: Bloomberg
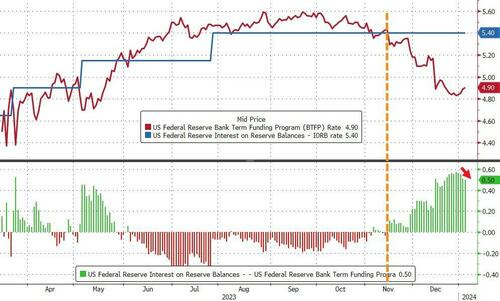
The BTFP-Fed Arb continues to offer 'free-money' (and usage of the BTFP has risen by $32BN since the arb existed), but the spread has narrowed a smidge from a peak near 60bps to 50bps today...
Source: Bloomberg
Which will make it hard for The Fed to defend leaving the facility open after March when its "temporary" nature is supposed to expire.
“In justifying the generous terms of the original program, the Fed cited the ‘unusual and exigent’ market conditions facing the banking industry following last spring’s deposit runs,” Wrightson ICAP economist Lou Crandall wrote in a note to clients.
“It would be difficult to defend a renewal in today’s more normal environment.”
Which makes us wonder, just WTF will the regional banks do to cover the $140BN-plus hole in their balance sheets that they are currently filling...
Source: Bloomberg
And what exactly does that mean for regional bank stocks which appear to exist in a world of their own for now.
Before hitting send and letting you tend to your positions ahead of the NFP, on this day in 1980 … this song became a hit for this group …
AND for those who, like US, may be in the ‘SnoPocalypse’ zone,
AND … THAT is all for now. Off to the day job…Good luck as you plan your NFP trades and TRADE your NFP plans!!





I too have issues! Although in old-school psychology (my day job is Prison Psych Nurse) Acknowledgement is the 1st step towards progress! I'm finding MOST have issues, it's only a matter of the degree....
truth! stay safe, please!