With that in mind, a UST chart which caught MY eyes,
Note — momentum (stoch, bottom panel) have gone TO overSOLD and appear to have crossed which would suggest to ME somewhat bullish (ie LOWER yield) input.
… here is a snapshot OF USTs as of 725a:
… HEREis what this shop says be behind the price action overnight…
… WHILE YOU SLEPT Treasuries are higher and the curve is steeper this morning as weaker-than-expected PMI services readings (China, Europe) and a rare (these days) downtick in stocks... combine to foster 'risk-off' conditions. DXY is higher (+0.12%) while front WTI futures are also higher (+2%). Asian stocks were mostly lower, EU and UK share markets are all in the red (SX5E -0.65%) while Es futures are showing -0.4% here at 7am. Our overnight US rates flows saw a downtick in Treasuries during Asian hours with fast$ interest to add flatterers noted by our Tokyo desk. During London's AM hours, Treasuries followed bunds higher with a block buy of ~11k TY futures mentioned alongside some buying interest in the 20yr sector. Overnight TY futures volume was ~45% of its 10-day average…
… This morning 10y reals are back below their former range support at ~1.60 after they took a brief look above their March move high (~1.67) last Friday. We've noted this before, but the potential evolution of so-called triple bullish divergence (drawn in) is what intrigues us along with the so far successful tests and rejections of the aforementioned support levels. The evolving triple bullish divergence, if confirmed by a bullish close/flip in momentum, would cement the idea that 10yr real yield sellers may be pushing on a string a present. We'll see how it goes for 10y reals from here as they sit near key range support levels.
… and for some MORE of the news you can use » IGMs Press Picks for today (5 July) to help weed thru the noise (some of which can be found over here at Finviz). But first, from the days IGMs Press Picks, a story from WSJ caught my eye
From some of the news to some of THE VIEWS you might be able to use… here’s what Global Wall St is sayin’ …
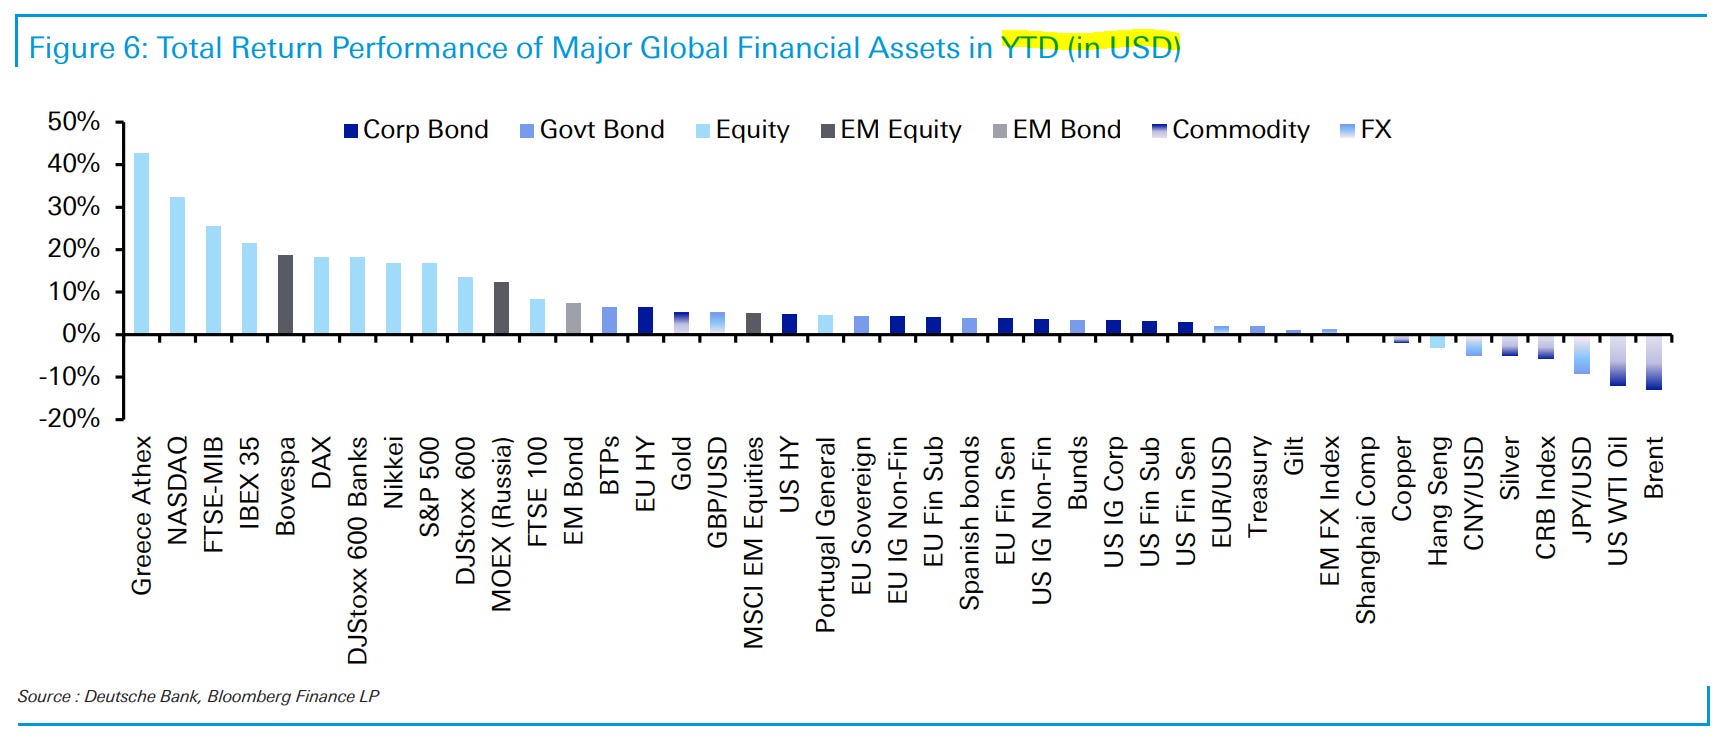
First up from Monday’s note, I included a monthly performance review while missing the more important YTDupdate and so, without further delay,
Now in as far as a couple / few more items from the Global Wall Street inbox and specifically a quick look back TO Mondays DATA
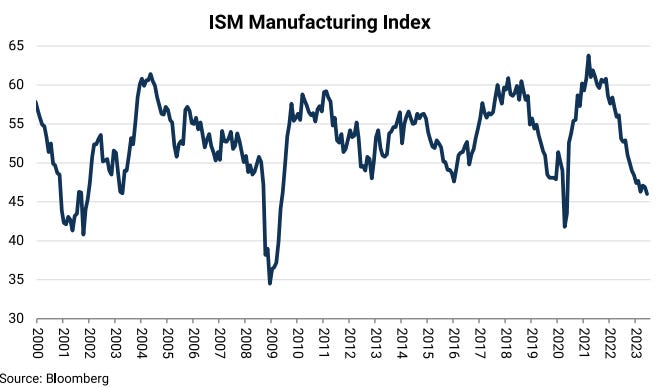
JEFF: Jun ISM Mfg PMI Falls to Lowest Since May 2020
… With 8 straight readings below 50, the June ISM manufacturing PMI shows that the sector remains firmly in a recession. New order demand remains weak, and until interest rates fall, it is hard to see how capex investment demand will rebound.
Wells- ISM Manufacturing Signals Eighth-Straight Month of Contraction
The June ISM manufacturing report was a dud and continues to signal the sector is broadly in contraction. All of the components were below 50, and the only positive takeaway in this release is that new orders contracted at a slower rate in June.
… Data surprises tend to move with equity markets, which makes the recent resilience of equities look puzzling (figure 2). The AI theme is an obvious driver, but with relative valuations at a 16-year high, and positioning now overweight, downside risks look to be mounting. If this unfolds, the dollar likely benefits as a safe haven, but with dovish Fed repricing likely, the yen could also benefit a bit.
Moving along now TO the here and now,
ABNAmro: China - June PMIs point to slowdown in services
… Services PMIs confirm reopening rebound is fading Meanwhile, the services PMIs from both NBS and Caixin tell a clear story: the reopening rebound has faded and momentum in services growth is weakening again (although both services PMIs remain well above the neutral mark). The official non-manufacturing PMI dropped by more than a full point to 53.2 (June: 54.5, consensus: 53.7), the weakest reading since the Zero-Covid exit initiated in December 2022. And Caixin’s services PMI published this morning came in at 53.9, more than three points lower than in May (57.1) and also much weaker than expected (consensus: 56.2). Meanwhile, the composite PMIs (weighted averages of the output indices for manufacturing and services) from both NBS and Caixin came down further, although remaining in expansion territory as well. The official composite PMI dropped to 52.3 in June (May: 52.9), while Caixin’s composite PMI fell by three points to 52.5 (May: 55.6). All told, China’s recovery has clearly faltered, and we have cut our annual growth forecast to 5.7% (from 6.0%). We expect more piecemeal monetary easing, and targeted fiscal support to stabilise the property sector and support domestic demand, also see the China update in our June Global Monthly here
Bottom line: The Caixin China General Services Business Activity Index (headline services PMI) fell to 53.9 in June from 57.1 in May. The NBS and Caixin services PMI both fell but remained well above 50 in June, suggesting the activity in services sector continued to improve but at a slower pace.
With this REBOUND FADING in mind, a story now which the Fed likely wants to hear,
Anyone worried about inflation “stickiness” should look at Eurozone producer price inflation over the past 40 years. May Euro producer price inflation likely fell into deflation, having plunged some 45 percentage points in a year. Energy is a big part of this, but the collapse of inflation pressure is nonetheless astonishing. Most profit-led inflation is not in producer price data—it is generally a consumer price issue.
US May factory orders data is due, with revisions to durable goods orders. French May industrial production data is also due—predating recent riots.
The June Federal Reserve meeting minutes cover discussion where Fed factions may have done a deal to pause for now, but hike in the future. The minutes may tell us more about internal politics at the Fed than the state of the US economy. We also hear from Fed President Williams, a voice of economic authority.
China’s President Xi said they want open supply chains (except, presumably, those supply chains with newly imposed export licenses). China faces two challenges to trade today. Economic nationalism forces deglobalization. Automation and digitization encourages localization. There will be no surge in trading of Beyoncé compact discs if compact disc supply chains become more open, because digitization makes such trade obsolete.
FWIW, I’m still worried about stickiness despite whatever Paul would like me to believe may be the relationship between EZ PPI and the US situation … Back TO the drawing board — perhaps the Fed will take some comfort in the following SUPPLY RELATED note,
Despite low investment, non-OPEC+ supply has been growing robustly and supply from Iran and Venezuela has been creeping higher. We still model stock draws in 3Q, but expect oil price softness to continue as the market's focus shifts to 1H24 when balances look in surplus.
Increased supply (hopefully outpacing DEMAND) will then support lower prices (at the pump) and so, lower / less sticky ‘flation and higher consumer confidence … in the Fed doing its job? And speaking OF the Fed and its job, today we’ll get to see most recent FOMC meeting minutes and a large German operation asks,
… Have the minutes been a market mover this cycle? Today’s COTD suggests not.
The chart shows the volatility of various asset prices on FOMC minutes and meeting days relative to all other trading days, for the period since 2020. (Vol is measured as the absolute daily change in yield or price.) A positive/negative value indicates higher/lower average volatility on minutes or meeting days and the asterisks denote whether the marginal effects are statistically significant.
As shown in light blue, FOMC meeting days over the past three years have been associated with significantly higher volatility in rates, risk assets, and the dollar. The minutes on the other hand (in dark blue) have been associated with slightly lower daily volatility though the differences aren’t significant. The effects are robust to alternative sample periods as well as specifications that allow for shifts in volatilities on other types of days – e.g., CPI and NFP release days.
The overall message is that one shouldn’t pay a minutes volatility premium.
Okie dokie … so as we’re NOT paying attention TO this afternoons FOMC minutes, perhaps we should be contemplating upcoming JOBS report … To help with that, BBG
BNPs US jobs preview: Schools out for summer – Teacher scarcity to prop up June hiring
KEY MESSAGES
We project nonfarm payrolls at 230k (down from 339k prior) and a partial reversal in the unemployment rate to 3.6% (3.7% prior).
Private payrolls will provide a clearer guide to labor conditions than the headline number, as the public sector reading could be prone to distortions related to seasonal end-of-school-year layoffs in education-related sectors.
Industries where employment remains in deficit relative to pre-Covid norms – such as education and leisure/hospitality – may continue to support job growth over the summer months. However, intensifying strains in higher-paid industries would be detrimental to aggregate income and spending, and in turn to economic growth.
Seasonal factors may support job growth over the June-July period, but we estimate the lagged effects of 500bp of Fed rate hikes, ensuing credit tightening and falling corporate profits will ultimately result in net layoffs this fall as back-to-school and holiday seasonal factors kick in.
… Seasonal factors could support summer payrolls: The lack of teachers – state and local government educational employment remains well below pre-Covid norms – could result in a smaller-than-usual seasonal swing in teacher/education layoffs. State and local governments may need to lay off fewer school workers in June and July than usual, which also means fewer re-hires in September. Barring a significant adjustment in seasonal factors, such a dynamic would be supportive of headline payrolls in the summer and weaker hiring in the fall.
The education sector layoffs during the summer months are the second-largest (after the holiday season swing in the winter) seasonal adjustment during a calendar year (see left chart above). This could make the state and local payrolls reading less reliable in June-July, shifting focus to the private sector jobs tally…
And for those who’ve made it this far, my apologies for resuming OF spammation of your inbox … it will only be another couple days ‘til the weekend where you’ll get a much needed break … but for now,