Good morning … it may just be the case that there’s nobody here but us mice. That said,
RTRS: Oil rallies on Saudi and Russian output cuts for August
Oil rose on Monday after top exporters Saudi Arabia and Russia announced supply cuts for August, overshadowing concern over a global economic slowdown and the potential for further increases to U.S. interest rates.
Saudi Arabia on Monday said it would extend its voluntary cut of one million barrels per day (bpd) for another month to include August, the state news agency said.
Russia, seeking to nudge up global oil prices in concert with Saudi Arabia, will reduce its oil exports by 500,000 bpd in August, Deputy Prime Minister Alexander Novak said on Monday, further tightening global supplies…
… Fears of a further economic slowdown denting fuel demand had grown on Friday as U.S. inflation continued to outpace the central bank's 2% target and stoked expectations it would raise interest rates again.
Higher interest rates could strengthen the dollar, making commodities such as oil more expensive for buyers holding other currencies.
Factory activity growth in China, the world's largest crude importer, also slowed in June as sentiment and recruitment cooled in sluggish market conditions, the Caixin/S&P Global private sector survey showed.
This morning is one like I cannot recall, even when I had a seat at an institutional FI sales / trading / strategy table — a Monday where markets are open for a 1/2 trading session before a Tuesday holiday. I’m quite certain there will be a ‘half staff’ and if you are here reading this, well, I’m sorry you didn’t get stuck out in The Hamptons or ‘down the shore’…
I’ll begin with a quick look at the big picture / setup,
Looks to ME that the 10yy continues triangulating and as the walls appear to be closing in, perhaps a break is near, I’d note continue bullish momentum in the form of the green line (slow stochastics, bottom panel).
Mom always said — if you don’t have anything nice to say then don’t say anything at all — I’d note this weekends narratives DID include a few words on why bullish seasonals may move from August to … JULY. MS,
… Historically, August has come with a bias for lower yields and higher returns. In a 2018 analysis, we found an August seasonal bias coefficient of -17bp for the 10-year yield. That is, controlling for the average monthly change in yields over the past year, we expect a 17bp 10-year rally in August. However, monthly rate movements since 2018 suggest that the August seasonal rally could be fading.
We revisit our rates seasonality model to determine whether this is the case. Using our methodology from 2018, we estimate seasonality bias coefficients for each month, controlling for the average monthly yield changes over the past year. We select different frames between 2003 and 2023 to understand how rates seasonality may have changed over time. Finally, we break months into halves to get an even more granular view of changes in seasonality since 2003.
We find the following:
Negative August rates seasonality has weakened substantially since 2018.
Specifically, a rally in the first half of August has now shifted to the second half of July.
There is now a seasonal selloff in the second half of August that cancels out the rally in the first half of the month. This selloff sets up an even larger selloff in September.
One of the REASONS they offer was noteworthy,
… These results suggest that the former 1H August rally has shifted – if not fully, at least substantially – to 2H July. A possible explanation for this change is that investors, recognizing negative rates seasonality in August, have "front-run" the rally, causing a stronger rally in mid-July and a much weaker rally in early August.
AND a reminder from one of THE very best — perhaps all time GREAT — David Ader,
… There also was a seasonal bias for a pickup in inflation early in the year (companies getting price increases in early to book them for the bulk of the year). As a result, Treasury Inflation-Protected Securities also benefited in the first few months of a given year, with break-even rates -- the difference in yields between TIPS and conventional Treasuries, and an indicator of the rate of inflation expected by investors -- tending to reach their widest levels around May-June and then narrowing for the balance of the year…
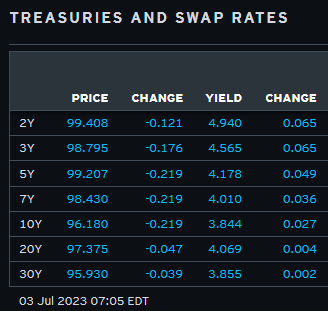
AND … here is a snapshot OF USTs as of 705a:
… HEREis what this shop says be behind the price action overnight…
… WHILE YOU SLEPT The Treasury curve has pivoted flatter around a little-changed 10y point this morning with Bunds and Gilts mildly under-performing USTs despite weaker than expected PMI data in their regions earlier. DXY is higher (+0.23%) while front WTI futures are too (+0.9%- Saudi Arabia and Russia announced extension of oil supply cuts). Asian stocks were higher across the board (Nikkei +1.7%, SHCOMP +1.3%), EU and UK share markets are all in the green (SX5E +0.4%) while ES futures are little-changed here at 7am. Our overnight US rates flows saw Treasuries trade from in Asia on outperformance in the Aussie bond market. Our desk activity was limited though... with real$ buying in the long-end a theme then. In London's AM hours some apparent paying in the belly (and a block sale of ~11k TY futures) pressures USTs but our desk flow saw demand out the curve from real$ names. Overnight Treasury volume was surprisingly decent (125% of ave) despite the limited flow from clients overnight.
… Starting with duration, our first attachment this morning shows how the 3.86% support area (move high in May) has been respected in recent days as we show in the daily chart of Tsy 10yrs.
What's also interesting about this support zone is that it matches up well with a channel/flag top in the weekly chart of Treasury 10yrs, as illustrated. We look at these set-ups and think: 1) ~3.86% appears to be a solid local support for 10yrs and 2) a break and close above the 3.86% level would be bearish and perhaps unleash another spike in 10yr yields at least back to last October's move high near 4.335% on the idea that the channel since October was just corrective and not bull trend-starting. That's what the textbooks would say about bear flag continuation patterns like this price set-up in 10's could be. One idea, anyway.
… and for some MORE of the news you can use » IGMs Press Picks for today (3 July) to help weed thru the noise (some of which can be found over here at Finviz).
From some of the news to some of THE VIEWS you might be able to use… here’s what Global Wall St is sayin’ … (this is in addition TO some WEEKLY NARRATIVESnoted HERE just yesterday).
Jumping right in to what is on the minds and in the hearts of Global Wall Street, a note from Dr. ED synthesizes just about everything in the title,
… On Friday, the S&P 500 closed up 1.22% at 4450.38 (chart). That's even though that morning we learned that May's personal consumption was weaker than expected and core inflation was higher than expected (chart). In addition, Fed officials have turned more hawkish in recent days causing the 2-year Treasury yield to rise to 4.90% on Friday, the highest since March 9, just before SVB hit the fan.
We are still forecasting 4600 by the end of this year, but that's not far off now and it is only mid-year! The S&P 500 is 11% above its 200-dma. It should find some resistance at its current level, which coincides with the upper bound of its bullish channel. If it rockets even higher, a melt-up scenario becomes more likely.
… Since the start of the bull market, the MegaCap-8 are up a whopping 47.2%. The S&P 500 with and without them is up 24.2% and 15.6%.
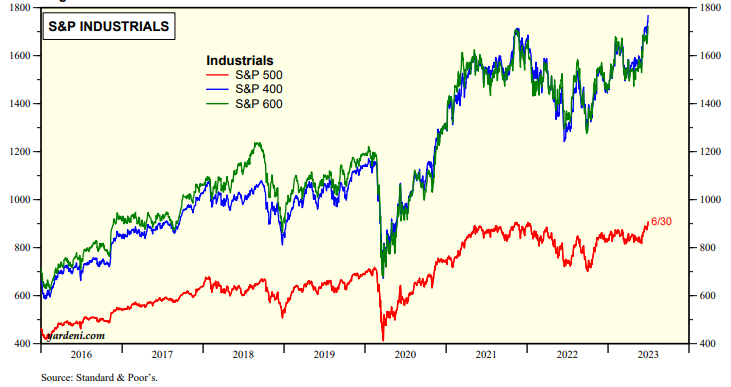
There's room for the rally to broaden out to Financials. Meanwhile, the rally has already broadened out to the Industrials sector, which seems to be breaking out to new record highs for the S&P 500/400/600 (chart).
In as far as a review goes,
DataTREK: 1H 2023 Capital Markets Performance Review
… First, US equity returns started the year concentrated in Big Tech, but the rally broadened out somewhat in Q2 to include other sectors, names, and market caps. Even still, large cap Tech has been the primary engine of US stock outperformance year to date relative to rest of world equities. S&P 500 earnings estimates have been declining most of the year; we’re almost at a new low right now, according to FactSet. Therefore, US stocks’ remarkable YTD run is based on 1) hopes for an end to Fed rate hikes/still strong economy in 2024 and 2) enthusiasm about generative AI’s ability to power Tech company earnings and competitive advantage.
Second, non-US equities began 2023 hopeful that a swift Chinese economic reopening would power growth in Europe and EM Asia but then spent Q2 tempering their expectations on this issue. This capped returns in the just-completed quarter for most non-US stocks, even as their domestic counterparts continued to rally. The only big winners in major international equity markets were India and Brazil, as global investors looked for non-China plays.
Third, fixed income and currency markets have also been a “tale of two halves”. Q1 was all about the end of rate hikes and China’s reopening. This supported bond prices and EM currencies. Once it became clear in Q2 that we might not be at peak monetary policy rates and China was not in the throes of a 2010 – style economic revival, bonds sold off and Asian EM currencies fell.
Takeaway: We start the second half of the year with markets certain that US Big Tech is the place to be, but primarily because everything else is so uncertain. We will be back in the coming days with our outlook for the rest of 2023, but that is the cornerstone observation that drops out of today’s analysis…
… #7: Closing out today’s note, here are fixed income market price returns (not including coupon payments) as well as two hypothetical 60/40 porfolios:
Comment (1): Except for EM sovereigns, bond prices were down across the board in Q2 after rallying in Q1. Hopes for peak monetary policy rates in the US and Europe have given way to concerns that central banks will continue tightening. At the longer end of the yield curve, even if inflation expectations are not far off 2 percent, real rates remain high relative to the last +10 years and rose in Q2.
Comment (2): For all the chatter about 60/40 being “dead”, returns for this portfolio construction paradigm have been just fine this year. Yes, that has been all due to stocks. But that’s what happens sometimes. Equity and fixed income returns should, and usually do, show low correlations. This is a feature, not a bug.
For a somewhat more comprehensive rear view mirror review of H1,
After a Q1 that was positive across the board, Q2 was more mixed for financial markets. Some assets did really well, with tech stocks seeing a strong outperformance thanks to excitement around AI. That extended to other risk assets, and volatility continued to fall as there were no signs of broader financial contagion after the issues in March. However, sovereign bonds lost ground after inflation remained sticky and central banks kept taking rates higher. Commodities also struggled across the board, with Brent crude oil prices down for a 4th consecutive quarter. All-in-all, that meant we had one of the most even quarters in a while in performance terms, with 22 of the 38 non-currency assets in our sample ending Q2 in positive territory. But the strong Q1 means that more assets are still positive over the year as a whole, with 31 out of 38 in positive territory on a YTD basis…
Quarter in Review - The high-level macro overview
… With inflation remaining persistent and central banks staying hawkish, that meant sovereign bonds struggled in Q2. US Treasuries were down -1.4%, bringing an end to two consecutive quarterly gains, whilst German bunds saw a more modest -0.4% decline. However, it was gilts (-6.0%) that saw the worst performance, falling to their lowest levels since the mini-budget turmoil last October. That followed several upside inflation surprises in the UK, where the CPI inflation rate is the highest in the G7, as well as an unexpected 50bp hike from the Bank of England in June. Markets are also pricing in a more aggressive tightening cycle for the Bank of England relative to other central banks, with overnight index swaps pricing in a terminal rate that’s above 6%…
… Which assets saw the biggest losses in Q2?
Sovereign Bonds: It was a rough quarter for sovereign bonds as inflation remained sticky and central banks kept hiking rates. Gilts were the worst performer with a -6.0% decline, but Treasuries (-1.4%) and bunds (-0.4%) also lost ground. Italian BTPs (+0.8%) were one of the few outperformers, and the spread of Italian 10yr yields over bunds tightened by -13.5bps over Q2, in line with the broader positivity for risk assets.
Putting H1 aside for a moment, an attempted rosie look ahead to how / why Fed is or will be winning,
■ Core inflation stopped falling in the first half of the year, and the FOMC now projects the core PCE measure to end the year at nearly double its 2% target. However, we see four reasons to expect renewed declines in inflation this summer and beyond: 1) the 9% pullback in used car auction prices that we believe is only halfway done, 2) negative residual seasonality in the summer for CPI and PCE prices, 3) the sharp deceleration in apartment rent list prices and diminished upward pressure from lease renewals, and 4) significant progress on labor market rebalancing…
■ … We also continue to expect a further decline in shelter inflation. The best alternative rent measures have slowed from a +20% annualized pace in mid-2021 to just over +1% annualized in last 8 months. Additionally, Cleveland Fed research and our own analysis using alternative rent data reveal that at least half of the post-pandemic premium on new rental units has unwound—which will reduce upward pressure on lease renewals. These findings validate the spring stepdown in monthly shelter inflation and argue for additional slowing in coming quarters.
■ The final reason to expect lower inflation readings is also the most durable: the significant progress on labor market rebalancing. Our jobs-workers gap has roughly halved, and sequential growth in average hourly earnings has already slowed to the 4% pace we believe is necessary to bring medium-term inflation back into the Fed’s comfort zone. The normalization of commodity prices and inflation expectations—both beneficiaries of the more balanced labor market—also argue for a slower pace of inflation. We find that these four variables can explain all of the 2023 pullback in non-housing services inflation excluding the (lagging and idiosyncratic) healthcare and financial services categories—and they argue for further moderation ahead.
■ We are lowering our December 2023 core PCE inflation forecast by two tenths to 3.5% year-on-year, and we are now assuming a sizable slowdown in June for both core CPI (0.24% vs. 0.44% in May, mom sa) and core PCE (0.21% vs. 0.31%). Such an outcome would validate the Fed's plan of slowing the pace of monetary tightening and would further reduce the odds of back-to-back hikes in July and September, in our view.
Disinflation appeared to pause during the spring, with year-on-year core PCE inflation stabilizing in a 4.6-4.7% range after falling ¾pp over the previous year (see blue line in Exhibit 1).
Another angle and sellside note attempting to skate to where the puck is gonna be,
Wells: Personal Savings Account You Can't Have Your Funds and Spend Them Too
Summary Excess savings enabled consumer staying power and helped delay recession. This report explores how surplus liquidity itself unlocks the capacity for a structurally lower saving rate and how each monthly draw-down of savings could make the coming recession worse for households.
I’d imagine the news on EARL noted above — our enemies attempting to prop / keep prices high and rising — NOT gonna help savings rate situation … but maybe I’m wrong? Happened before and it’ll happen again …
And back TO the rear-view mirror but this time NOT looking at details of the prior quarter or H1 but rather considering the recent SINTRA conference,
MS The Weekly Worldview: Reflections From Sintra The ECB's Annual Conference at Sintra last week provided valuable insights into the current state of central bank policy-making. We discuss communications strategy in light of data dependence and the challenges faced in firming up peak rates.
This year I was fortunate again to be invited to the ECB’s annual conference, which took place last week in Sintra, Portugal. The prepared remarks--usually the market focus--only tell part of the story. The debates in and around the formal program help to frame where policy is now and where it may be going. For the ECB, the Fed, and the Bank of England, we are not quite at the peak, and one of the biggest challenges is estimating the lags with which monetary policy will more forcefully grip the economy. There was a “hawkish” tone to the prepared remarks, and yet, the idea of data dependence was just as powerful. One key takeaway is that the debate will soon have to shift from finding the peak rate to discussing how long policy makers will be willing to hold rates at the peak rate.
Finding the peak rate has to come first, of course. In thinking through where those peaks are, three issues were woven through the discussions. First, the “hawkish” tone was, to my ear, more about committing to restoring price stability rather than being dogmatic about exactly how high the policy rate will have to go. I also sensed that there was a general willingness to err on the side of hawkish communications, because, in the event that less hiking is needed, adjusting communication would be easier, than if the opposite surprise happened. Second, the continued and even amplified reference to data dependence in making the assessment of where the peak is critical. But it would be wrong to conclude that data dependence is code for an easier policy path; in fact as we have seen, data dependence can lead to more hikes. Finally, providing some balance about how much further rates will need to rise, was the discussion about the lags of monetary policy. We and markets see more hiking in the future. Indeed we recently revised higher our policy paths for the Fed and the BoE, but I came away from the conference with a strong belief that policy makers are very willing to adjust their plans (including the dot plot for the Fed) if inflation and economic activity show the moderation we are forecasting (Exhibit 1, Exhibit 2).
Finally, beginning the note with a somewhat longer-term (MONTHLY) view out the curve, I thought ending the note with a shorter-term view of the front end might not be a terrible way to end a note which more than likely falling on deaf ears…
US 2y yields: Last week, we closed decisively above the gap resistance of 4.87%, as well as resistance at 4.80% after strong US data. We also posted a bullish outside week in the process. All these point to near term upside in the yields space, with little notable resistance till the 2023 highs of 5.08%.
Nevertheless, we warn that some caution is warranted. We posted triple momentum divergence on the slow stochastics indicator (one of our favorite trend exhaustion indicators), with a chance for quadruple momentum divergence. Hence, we prefer to be nimble and continue to update as things develop.
Soaring yields
OTHER TECHNICAL DEVELOPMENTS WORTH NOTING US 10y yields: We posted a bullish outside week, though we still remain below strong resistance between 3.85% to 3.86%…
This will have to hold us all over ‘til Wednesday given the 4th of July holiday. A couple reminders — a PSA of sorts,
AND for the record, I don’t have a cat but if I did … it would likely be shootin’ back … THAT is all for now. Off to the day job…