(USTs higher on WEAL volumes)while WE slept; historical context (rate cuts and the easing of financial conditions); bond traders targeting HIGHER yields by weeks end...
Not watching things too closely yesterday (having increased confidence in BITC etf, being approved, oh, wait though…nevermind) but as the daily dust settled and reading of one account …
ZH: Bonds, Bullion, & Big-Tech Quiet As Data-Deluge Looms
… my thoughts quickly then turned TO yesterdays 3yr auction …
… The internals were most impressive of all, however with Indirects awarded 65.3%, a big jump from last month's 52.1%, and the highest since August (also well above the six-auction average of 62.3%). And with Directs awarded 16.8%, Dealers were left holding 17.8%, down from 26.2% last month and right on top of the recent average of 17.7%.
… and looking backwards not so much for trading / investment purposes but rather, in an effort to glean some morsel of insight as to rate cuts / hike expectations which were ‘basically flat on the day’ -ZH.
Message then received — rate CUT game REMAINS ON and so, the 3yr was stellar.
What, then, should we say / think ‘bout this afternoons 10yr auction … ? Well, I’m not sure BUT we DID see decent (BBG deemed it a RECORD) level of investor demand for 20y GILTS just yesterday (before 3yy) … and so, TO what the charts are saying / suggesting … I call this looka t 10yy dating back to 2015, “Knife fight” …
… where we’ve moved from overBOUGHT to oversold in seemingly a click or two and now, momentum suggesting path of least resistance is … lower. This, as bond traders betting on HIGHER YIELDS end of the week (see below) via shorter dated options!
PERFECT … let the ‘knife fight’ then continue and in the meanwhile … here is a snapshot OF USTs as of 705a:
… HEREis what this shop says be behind the price action overnight…
… WHILE YOU SLEPT Treasuries are higher as the Red Sea remains a hot zone and despite a disappointing JGB 10yr auction overnight. Treasuries are outperforming Gilts and Bunds again today, DXY is modestly lower (-0.1%) while front WTI futures are little changed (+0.3%). Asian stocks saw a nice rally in Japan (NKY +2%) but modest declines in most other exchanges, EU and UK share prices are a touch lower while ES futures are UNCHD here at 7am. Our overnight US rates flows saw prices drift lower during Asian hours (weak JGB 10y auction, poor reaction to a decent Aussie CPI number) with no notable flow besides a 4k block buy in TU's that posted. In London's AM hours, the desk felt that stops appeared to trigger as 10yr yields crossed back below 4% while they also mentioned another day of demand for paper via ASW- a theme this week. Overnight Treasury volume was relatively weak at ~70% of average overall.
… Our first attachment looks at the daily chart of Treasury 5yrs. We are now far enough along into this corrective move to at least suspect that this year's minor bear channel (drawn in) is part of a bigger continuation pattern such as a Bull Flag, in this case. Here's a link describing a Bear Flag BBs since the textbooks tend to write about prices when we operate in a yield world. The set-up is the same and the ideas are the same: lower, over time. In fact, in the link's first illustration/chart you can easily see how the downtrend pictured had periodic counter-trend moves along the way. You can see similar price action in our 5yr chart where there were counter-trend sell-offs in Tsy 5yrs early in November, again in late November (briefly) and then around week #2 of December. What this staircase lower suggests is that markets needed breathers on the way lower to shake-off weak-handed positioning- to eventually resume trend without the burdens that positioning represents. We've now been in this potentially counter-trend duration sell-off long enough to suggest that bonds could be tracing out flags (the counter-trend corrective moves) in big bull flag continuation patterns like those described above.
… and for some MORE of the news you can use » The Morning Hark - 10 Jan 2024 and IGMs Press Picks (who CONTINUES to be sportin’ that new, fresh look) in effort to to help weed thru the noise (some of which can be found over here at Finviz).
Moving from some of the news to some of THE VIEWS you might be able to use… here’s SOME of what Global Wall St is sayin’ …
BNP: DM Rates Strategy Outlook 2024: Levels to long for
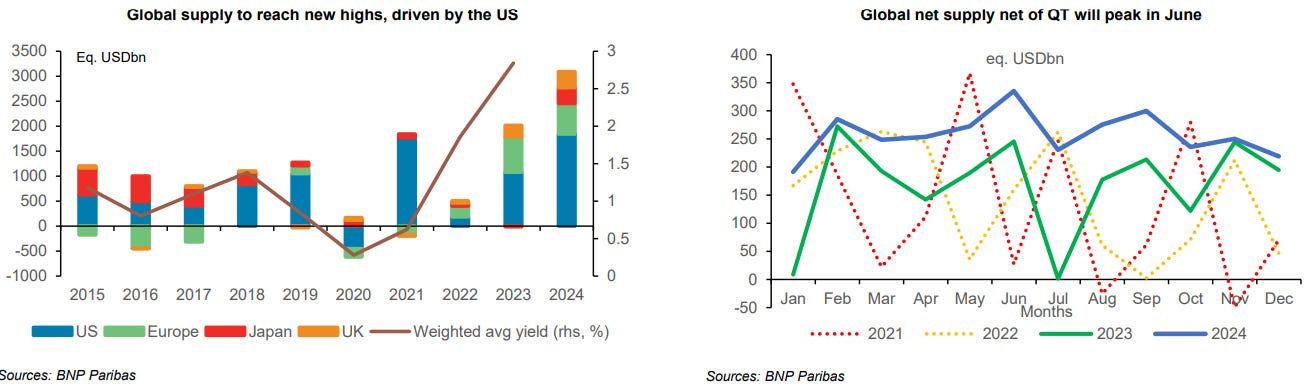
Extreme valuations at the turn of the year leave room for a temporary upward correction in yields: We were forecasting a gradual duration rally into year-end 2024 in our last Global Outlook. We have been surprised by the strength of the recent move, which has taken yields in some markets through our 1-year ahead forecasts. We see scope for a temporary upward correction from current levels, with our term premia framework implying upside risk in H1 2024 thanks to record supply.
Ultimately getting ready for structural longs, at the right level: The anchor for yields will nonetheless decline this year, as illustrated by our fair-value models, with inflation falling fast and central banks embarking on rate cuts from Q2. We think it makes sense to trade the range in the US near-term, with a preference to do so from the long side (e.g. more of a buy-on-dips mentality). Without a shift in the fundamental picture, we look to trade on pullbacks towards 4.25-4.30% on 10y yields. In the eurozone, ideally we would wait for a convergence towards our H1 forecasts (2.35-2.40% on the Bund) before considering structural longs.
Steepeners remain the way to go: We are still more bullish than market pricing at the front end in the US market, while in the UK, the market has rapidly converged towards our view. In the eurozone, our economists still foresee a much milder rate-cutting cycle than priced in. For these reasons, we expect steepeners to outperform in the US. In the eurozone, our top picks remain 5s10s and 10s30s. We prefer 5s10s steepeners on heavily supplied cash curves such as France and Italy and target a steepening in the order of 15bp. Further out along the curve, we believe that EUR 10s30s could keep moving into positive territory this year, although this is likely to be gradual. Furthermore, we see EUR 30s50s at an attractive level and benefiting from our view for lower vol in 2024 which could push the spread towards -15bp…
Markets have just experienced one of their strongest rallies since the GFC, with bonds and equities both surging over November and December.
But there are several risks that markets still have to grapple with this year, and there remains some distance to travel before a soft landing can be achieved. As such, we consider 5 risks worth watching out for over the year ahead:
1. If a soft landing is going to happen, why are multiple leading indicators still pointing in a negative direction?
2. Although some recent data has appeared more positive, several details are still pointing to clear signs of weakness.
3. Historically, it has been hard to sustain equity gains at the pace we saw in 2023.
4. Both headline and core inflation are still above target for the most part, so there is still the risk that another inflation shock could cause expectations to spike and lead to a more persistent issue.
Even as inflation pressures are abating, they haven’t entirely gone away. In both the US and the Euro Area, headline and core inflation are still above target, which will constrain the ability of central banks to deliver a dovish pivot for the time being.
Moreover, since inflation has been above target for almost 3 years now since early/mid 2021, consumers and firms have become increasingly used to higher inflation. It’s true that expectations are now falling back, but given this history, the risk is that a fresh shock could cause expectations to become unanchored, particularly if that meant inflation stayed above target into a fourth year or beyond.
We have already seen one channel by which this could occur, since freight costs have spiked significantly since Christmas in response to issues around the Red Sea. The recent inflation data has also benefited from favourable base effects, since energy prices were still very elevated in late2022, before coming down over 2023. So the current year-on-year figures are comparing energy prices to that higher level from 2022.
If inflation does prove more persistent, that would add to the risk that markets underestimate how hawkish central banks will be in the near term. This happened again in 2023, even after the very rapid rate hikes of 2022. This has been a persistent pattern over the last couple of years, whereby markets have been too quick to price in a dovish pivot.
5. With markets now pricing in a fairly rapid pace of cuts, that risks creating a loselose situation. Based on historical precedent, it probably requires a recession to get those rate cuts (bad for risk assets), but if the economy outperforms then markets risk being disappointed by a more hawkish outcome.
Right now, futures are pricing in around 150bps of rate cuts between the January 2024 and January 2025 Fed meetings. Historically though, we’ve only normally seen that speed of cuts within a year around a recession. Indeed, the last four times we’ve seen rate cuts that fast, it’s been because of the most recent four US recessions.
… For markets, this sets up a potential lose-lose situation. On the one hand, to get cuts that fast it may well require something bad to happen, such as a recession that would not be good for risk assets. But on the other hand, if the economy does hold up better than expected, then that risks creating disappointment since the rate cuts priced might not happen. After all, the median dot in the FOMC’s latest dot plot only pencilled in 75bps of cuts for 2024, rather than the 137bps currently priced in by the December meeting.
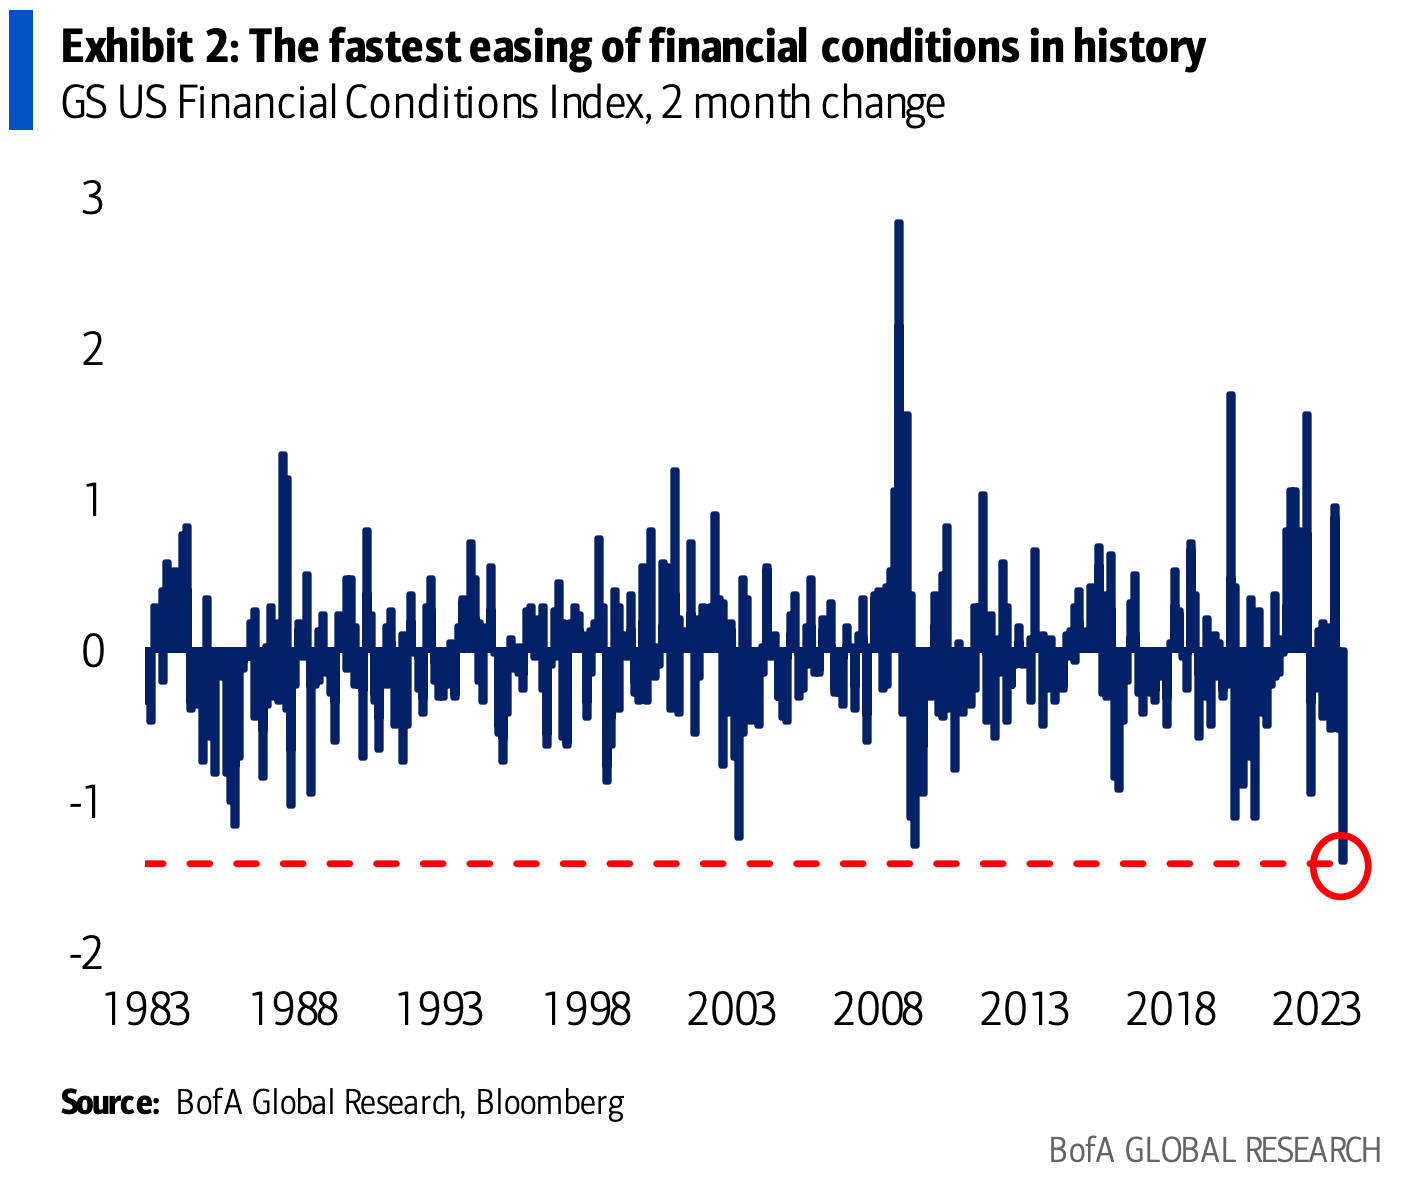
DB: The probability of a soft landing (interesting to consider and compiled using couple publicly avail surveys … ALSO interesting to consider recession probs as we’ve seen financial conditions EASE in an historic fashion — see below)
With the significant repricing in the Fed rate cut profile during Q4 2023 and the evolving dialogue around the possibility of a soft landing, today’s chart explores market expectations around the probability of a recession and recession timing. The probability density function (PDF) in the chart is constructed from the average of two New York Fed surveys (Survey of Primary Dealers and Survey of Market Participants) and paints a broad picture of when the market expects a recession to occur in the coming years.
The October surveys showed a decline in the likelihood of a recession in H2 2023, which was accompanied by increased probabilities for a recession in H2 2024 and H1 2025. Given the comparatively minor increase in probability for the no recession (soft landing) alternative, this change in the market’s outlook can essentially be viewed as a delay in the timeline for an economic downturn.
In contrast, the December survey saw a notable increase in the probability of a soft landing, which lines up with the continued shift in market sentiment around the possibility of earlier rate cuts. One caveat: since the survey responses were submitted before the December meeting, they do not account for potential further changes in views around the soft landing since Chair Powell’s surprisingly dovish tone at the press conference.
Goldilocks: Trade Deficit Narrows in November (for those interested in hindsight trading of economic funDUHmentals…)
BOTTOM LINE: The trade deficit narrowed in November from an upwardly-revised level. Following today’s data, we boosted our Q4 GDP tracking estimate by 0.1pp to +1.5% (qoq ar). We left our Q4 domestic final sales growth forecast unchanged at +2.2% (qoq ar).
Goldilocks: What Can Traded Inflation Tell Us About Tomorrow’s CPI Print? (a nice follow TO the above as well as yesterday’s data…)
We estimate a new measure of market-implied expectations for core inflation by adjusting market-implied expectations for headline CPI inflation derived from inflation swaps. We test which of several possible assumptions about the spread between headline and core inflation best captures investor expectations by measuring which has historically best predicted Treasury market reactions following CPI releases.
Our analysis suggests that combining the headline CPI inflation reading implied by zero-coupon inflation swaps with the difference between our own headline and core inflation forecasts—as opposed to, for example, the difference between Bloomberg consensus headline and core inflation forecasts—provides a best guess of the market’s expectation for core CPI. This proxy implies market expectations of +0.28% for tomorrow’s core CPI reading, a touch below Bloomberg consensus for a +0.3% reading and similar to our own forecast of +0.27%. We also estimate that market expectations for headline CPI inflation are +0.30%, above Bloomberg consensus for a +0.2% reading and similar to our own forecast of +0.29%.
Beyond being a better gauge of market expectations than Bloomberg consensus, we find that our preferred measure of market expectations for core inflation has been a slightly more accurate predictor of the upcoming core CPI reading in recent years, with a mean absolute error of 10.8bp since 2021 vs. 12.7bp for Bloomberg consensus.
Cross-Asset Strategy: Equities and bonds rallied into year-end, leaving markets appearing overbought and sentiment in complacent territory, e.g., illustrated by high RSIs, elevated Bull-Bear, VIX near lows, tight credit spreads and rich valuations. As a result, we’ve seen a partial reversal of the year-end rally since the start of the year, amid somewhat stronger data flow and a resurgence of geopolitical risks. We unwound tactical UST shorts but are reluctant to add longs given aggressive pricing of Fed cuts, fair valuations, and our client survey pointing to more neutral positioning, so we hold 5s/30s steepeners as a medium-term bullish proxy…
…Vulnerabilities at the start of the year: The strong rally in markets in Nov/Dec was largely due to the emergence of the immaculate disinflation thesis that would allow major central banks to cut rates aggressively towards neutral over the coming year, and significant investor re-leveraging and short-covering in a year-end performance chase. However, the disinflation thesis is likely to be challenged during 1H24 as the disinflation process stalls, equities appear overbought given low implied cash allocations and low short interest, and risks are rising for geopolitics to drive both a risk-off shift and a boost to inflation via increased shipping costs.
UBS: Inflation expectations decline at all horizons (a mix of old — weekend — and new news…)
Inflation expectations decline to a three-year low, says FRB of New York…
NFIB Small Business Optimism increases marginally in December…
Balance of trade in goods and services in November partly reversed October's deterioration… FOMC should tap the brakes on QT, says FRB of Dallas President Logan…
The World Bank’s Global Economic Prospects offered gloomy forecasts for GDP growth in the coming five years. If we suspend disbelief and accept the forecasts as accurate, global living standards should do better than the World Bank forecasts imply. Swathes of the world economy have declining populations, meaning headline GDP does a poor job of reflecting living standards. Structural change increases efficiency, and those efficiency gains may go to improving impact economy standards (the environment, work-life balance, etc.) rather than the crude output metrics of GDP…
…More economies have been offering weak, or weaker-than-expected consumer price inflation. The tendency for inflation to surprise to the downside is not that surprising. Mathematical models will underestimate the effects of ending a profit-led inflation episode.
Wells Fargo: U.S. Trade Deficit Continues Narrowing Trend
Summary The U.S. trade deficit narrowed modestly in November, and at -$63.2 billion it's almost 1/5 smaller than it was a year ago. Trade flows may be bumpy month to month, but the narrowing trend is in place.
Wells Fargo: Small Business Optimism Picks Up in December (a bit of GOOD news ‘til you look at the visual)
Summary Brightening Economic Outlooks and Resilient Sales Improve Small Business Optimism Economic resilience to date appears to have improved small business optimism at the end of 2023. The NFIB small business optimism index rose 1.3 points to 91.9 in December, tying with July for the highest reading of the year. Improving credit conditions and sales outlooks were the main drivers of December’s relatively rosy print, while labor and inflation continued to weigh on overall optimism. On the brighter side, stalling labor demand appears to be aiding the labor market in finding better balance. However, as core inflation remains fairly sticky on its road back down to 2%, inflation overtook labor quality as the single most important problem facing small businesses in December.
… And from Global Wall Street inbox TO the WWW,
Apollo: Extreme Disagreement Among Forecasters About the Outlook for Long-Term Interest Rates (for every seller there’s a buyer, and vice versa …? ALL OPINIONS are created equally … some are more equal than others?)
Some forecasters are currently predicting that 10-year rates will end the year above 5%, others are predicting a level below 3%, and the chart below shows the standard deviation of the 12-month ahead forecast for 10-year Treasury yields for 26 private sector forecasters since 2019.
The rising trend in the standard deviation of forecasts shows a very high level of disagreement among forecasters about what will happen to long-term interest rates in 2024.
This is not surprising because some would argue that a soft landing with Fed cuts and lower inflation would result in lower long-term interest rates.
Others would argue that a soft landing with no recession and the risk of reacceleration will push rates higher.
On a different note, others would argue that the key driver of rates in 2024 will be a higher term premium, driven by the coming massive increase in the supply of Treasuries.
What is most remarkable about the high level of disagreement among forecasters is that the same elevated level of uncertainty is entirely absent in the MOVE Index and the VIX Index.
The bottom line is that we have a busy year ahead of us in markets with extreme disagreement about the forces driving longer-term interest rates.
1. Financial conditions. "The easing in financial conditions over the past two months was the fastest in history."
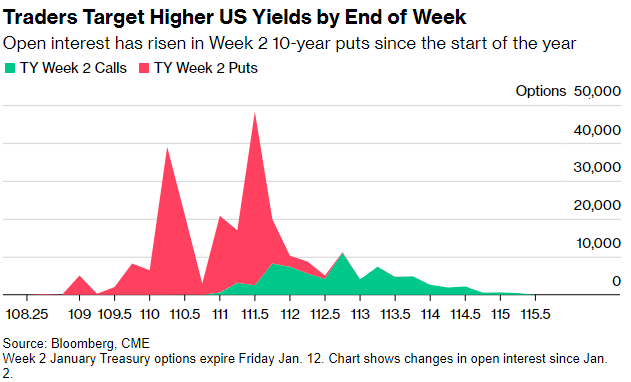
Bloomberg: Bond Traders Pile Into Short-Term Wagers Targeting Higher Yields (but, but … what about rate CUTS and a stellar 3yr auction…)
Strong appetite for bearish wagers that expire in just days
Meanwhile Hedge fund net SOFR long cut for third week in a row
Bond traders are turning to the short-dated maturity Treasury options market to hedge potential for soaring Treasury yields over the coming days, ahead of key risk events including Thursday’s December inflation report.
The theme has been prominent since the start of the year, as open interest, or the amount of new risk, has soared in put options targeting a Treasuries selloff over call options. Activity has picked up again this week, with demand continuing to emerge before December CPI and PPI as well as auction event risk…
…Weekly Options Surge Since the start of the year, demand for protection on a Treasuries selloff via the Week 2 10-year options, which expire Friday Jan. 12, has risen sharply. These types of short-dated expiry options act as hedges against event risk; this week, the event risks include bond auctions, CPI and PPI data. Largest demand over the week has been at the 111.50 put strike, which equates to roughly 4.10% 10-year yield.
Hedge Funds Cut Long SOFR Futures For the third week in a row, hedge fund net long SOFR futures positioning has been reduced, this week by around $4.2 million per basis point in risk, per CFTC data up to Jan. 2. Further out, the divergence between asset manager and hedge fund positioning rose sharply, with asset managers extending duration long from 2-year out to ultra-long by $14.5m per basis point and hedge funds adding to duration short across same tenors by net $14.8m per basis point risk.
WolfST: The BTFP Will Expire in March: Fed Vice Chair for Supervision Michael Barr (thinking this was large part of narrative creations and price action and as always, Wolf here does great job)
Last remaining bailout tool from the March bank panic goes away. Current arbitrage may have been a factors in shutting down this baby.
… Since November 1, the BTFP balance (blue line) jumped by 30%, after having been essentially flat in the prior three months (the Discount Window is the red line):
Since the BTFP’s rate (one-year overnight index swap rate, plus 10 basis points) runs close to the one-year Treasury yield, we use it as a stand-in for the chart below: It compares the one-year Treasury yield (red line) to the interest rate that the Fed pays banks on their reserve balances (blue line).
In early November, the red line (ca. BTFP cost of funds) dipped substantially below the blue line (income earned on those funds), and that’s where this risk-free arbitrage became profitable, and at least smaller banks jumped on it.
This arbitrage may have been another motivation for the Fed to shut down this baby.
Tomorrow we get CPI and long bonds and FRIDAY is earnings and with them in mind …
… Good luck as you plan your trades and trade your plans … THAT is all for now. Off to the day job…


Great information......
Scholarly work !!!!