(USTs higher, flatter on above avg volumes) while WE slept; rate CUTS in March (? Apollo ?) vs "Global liquidity: The honeymoon looks to be over" (BNP) ...
Good morning … Okie dokie … I’ll spare you the Field of Dreams (build it and they will come) video where ‘IT’ is concession (ie 2yy over 5%) and note,
BMO - 2-year auction stops through 0.1 bp -- middling stats
Today's 2-year auction was decent with a stop through of 0.1 bp and non-dealer bidding of 86.0% vs. an 83.3% average…
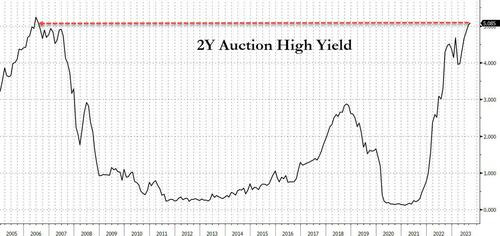
ZH: 2Y Auction Prices At Highest Yield Since July 2006
…The first coupon auction of the week priced at a high yield of 5.085%, higher than last month's 5.028% and the highest since the 5.09% yield of the July 2006 auction. Also, notably, the offering priced on the screws with the When Issued which also traded at 5.085% ahead of the pricing.
The bid to cover of 2.728 was less impressive, dropping from 2.942 in August and the lowest since April.
The internals were in line with last month, with Indirects awarded 65.02%, unchanged from the 65.01% in August, and with Directs taking down 20.99%, or just above last month's 20.01%, Dealers were left holding 13.99%, below the 14.98% in August and also below the 16.7% six-auction average…
… Overall, this was a solid, if not stellar 2Y auction, which in light of another concession day (2Y yields pushed higher along with the entire curve all day), was not surprising. After all, in a year or so, when the US is in a deep recession, many will be wishing they had another opportunity to lock in 2Y interest above 5%.
AND with this all ‘noted’, I’ll ask if you’ve #Got5s? Want some…?
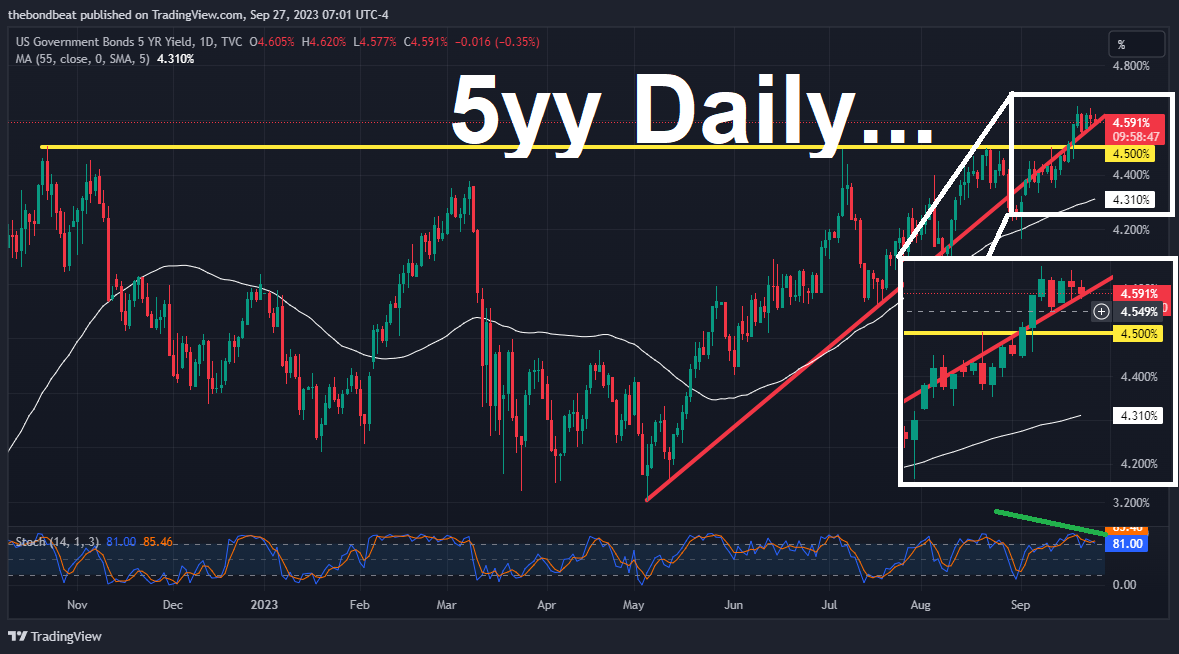
At / near TLINE and while Mom always said, if you can’t find anything nice to say, then don’t say anything at all … little did I know I’d be able to relate THAT to 5yy — where in this case I’ll note momentum (stochastics) to the best of my ability — at / near overSOLD levels and north of 4.50% — might just attract some interesting. But then, I might have said that ‘bout 2yy over 5% yesterday too … and we all know how well that worked out … Maybe, just MAYBE tomorrows 7yr auction — bit MORE duration — will be more appetizing as we head into weeks ending month and QUARTER end?
Get those bids in early and often (? it IS election season, right? is it ever NOT?) … here is a snapshot OF USTs as of 705a:
… HEREis what this shop says be behind the price action overnight…
… WHILE YOU SLEPT Treasuries are higher with the curve flatter after well-received German (10y) and UK Gilt (50y) auctions this morning with ~$1.4mln/01 total in curve steepener (FV>US) unwinds(?) also seen during Asian hours. DXY is higher (+0.1%) while front WTI futures are higher too (+1.5%). Asian stocks were mostly higher, EU and UK share markets are mixed while ES futures are showing +0.35% here at 7am. Our overnight US rates flows saw a block-influenced Asian session that had elevated volumes going through in intermediates. The swaps desk also noted a better skew to receiving in the 5yr sector (Asian real$) with spreads better offered as a result. During London's AM hours, activity was muted with the desk seeing slightly better selling overall ahead of today's 5-year auction. Overnight Treasury volume was ~110% of average overall.
… Starting with Treasury 2yr yields, this morning's yield levels are now back below their daily closing range highs in place since March of this year. Importantly, daily momentum is indeed flipping bullishly right now (lower panel, circled), a sign that buyers have wrested control of the price action from the sellers. Should front-end rates continue to rally (as now implied by today's likely bull flip in momentum), the rally will ultimately threaten the incumbent bear trendlines as we show in our next attachment of the weekly chart of SFRZ4 futures…
… and for some MORE of the news you can use » The Morning Hark - 27 Sept 2023 and IGMs Press Picks (who CONTINUES to be sportin’ that new, fresh look) in effort to to help weed thru the noise (some of which can be found over here at Finviz).
From some of the news to some of THE VIEWS you might be able to use… here’s SOME of what Global Wall St is sayin’ …
Growth looks set to slow sharply in Q4. Even without a government shutdown, the restart of student loan repayments and slowing jobs growth are likely to weigh on consumption. The labour market has cooled significantly. This is helping to dampen wage growth, making it likely that disinflation will resume once the near-term inflation bounce is behind us. We continue to expect rate cuts next year, but policy will stay in restrictive territory until 2025.
… Elsewhere, the economy is showing signs of slowing. Q2 GDP was revised down to 2.1% from 2.4% on the back of weaker business investment, and although jobs growth for August was broadly in line with expectations, there were significant downward revisions to previous months. All told, the pace of jobs growth has more than halved in the year to date, with the 3 month average falling from around 330k at the beginning of 2023, to just 150k as of August. Over the same time period, job vacancies have fallen by nearly 2 million, and the ratio of job vacancies to unemployed people has fallen to 1.5 – still on the high side, but now not far above the pre-pandemic level of 1.2. This broad easing in labour market tightness has helped dampen wage growth, with various wage growth measures now cooling rapidly. Given that wage growth is the main driver of the medium term inflation outlook, we expect the broad disinflation trend to resume once the near-term (oil-driven) rebound in inflation is behind us (see this month’s Global View).
For now, the Fed continues to strike a hawkish tone given the resilience in the economy, and the fear that inflation may not fall fully back to target. We remain unconvinced that the Committee will follow through with a further rate hike, as signalled in last week’s projections. Financial markets are currently split on the issue, with around a 50% probability of one last hike priced in. Once the economy more meaningfully slows, and assuming the the labour market slowdown and the broad disinflation continues, we continue to expect the FOMC to pivot to rate cuts from March. Still, rates are likely to remain well into restrictive territory throughout the coming year, with policy returning to neutral settings only in 2025.
Apollo - Eight Months from Last Fed Hike to First Fed Cut (nothin’ but the facts only thing here is the word **IF** … John Boehner used to say every day would be XMAS IF ands and buts were candy and nuts…or something something something)
The last Fed hike was in July.
If this was the last Fed hike during this cycle, and assuming it takes on average eight months from the last Fed hike to the first Fed cut, then the Fed will start cutting rates in March 2024, see chart below.
The big difference today is that inflation remains significantly above the FOMC’s 2% target. This may lead the Fed to keep rates high, even if the economic data starts to slow down more meaningfully.
Barclays - Equity Strategy - Who Owns What: Positioning pain more from rates than growth
Stagflation angst prompted a rush to cash, commodities and USD but no equities exodus as investors are well hedged. Defensive positioning is reflective of lower growth expectations, but it is higher real rates that hit equities. And while bonds look more reasonably priced now, Growth-to-Value rotation still lags.
… Stagflation fears have resumed and stocks have sold off, however equity flows have remained surprisingly resilient, seeing a slight inflow overall on the month. And while mutual funds have indeed increased their allocation to cash ytd, it was more due to reduced bond exposure than a lowered allocation to equities.
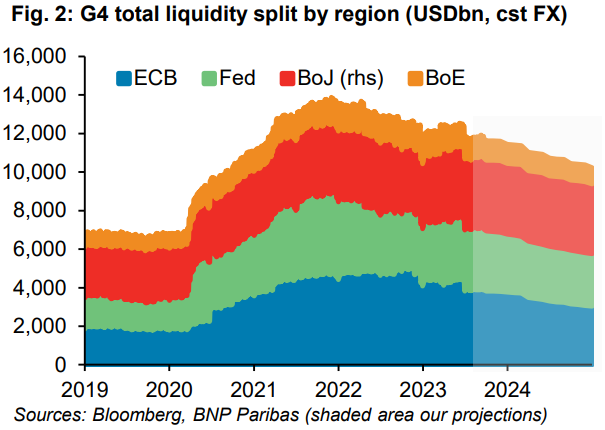
BNP - Global liquidity: The honeymoon looks to be over (oddly enough not 1 visual of global liquidity and stocks)
Global liquidity has started to decline again. We forecast it to contract by 10.6% in 2024, led by EUR liquidity, followed by the BoE and the Fed.
Such a drop would be consistent with last year’s decline, a shift from a comparatively benign 2023.
We expect secured funding channels and FX swaps to bear the brunt of the impact.
Medium term, though, we expect unsecured funding to remain relatively resilient, particularly in Europe.
… Our take: We think unsecured funding markets will remain relatively resilient in the medium term, particularly in Europe given robust demand for short-term deposits. Rather we expect the brunt of the impact will be felt in secured funding channels given increased collateral supply at the same time as liquidity is drained out of the system. Our US recession call is also consistent with a widening in xccy bases as funding in USD becomes more expensive, despite a slower decline in USD liquidity.
In considering the prospects for r-star, most point to fundamentals such as productivity growth, demographics, and risk aversion. We would add the state of private-sector balance sheets to that list.
Indeed, we've previously attributed the sharp drop in r-star coming out of the GFC in part to the significant post-crisis de-leveraging in the household and financial sectors. This balance sheet repair raised desired savings and depressed equilibrium interest rates. In line with this, today’s chart shows that growth in household sector liabilities and estimates of r-star simultaneously plunged in 2008-2009.
What does this suggest ahead? Household and financial sector balance sheets are in much better shape now than they were 10-15 years ago, supporting our view that the post-GFC decline in estimated r-star should to a large extent reverse. That said, corporate balance sheets, which are similar in size to households, are nearly as leveraged as ever though without a comparably sharp run-up to what was seen in other private sectors pre-GFC.
Goldilocks - Consumer Confidence and New Home Sales Weaker Than Expected; Lowering Q3 GDP Tracking to +3.0% (am reminded of something noted HERE yesterday — to NOT fall into trap of thinking Q3 GDP = GOOD)
BOTTOM LINE: The consumer confidence index was slightly weaker than expected in September, led by a sharp decline in the expectations component and falling to the lowest level since May 2023. The labor differential edged up. New home sales declined by more than expected in August from an upwardly-revised July level. We lowered our Q3 GDP tracking estimate by 0.2pp to +3.0% (qoq ar) and our domestic final sales growth forecast by the same amount to +2.6%….
Goldilocks - A Status Check on Bank Lending and Bank Balance Sheets (as banks are generally the funding source for the business cycle, am wondering what to make of nominal lending growth — and we use that term loosely — just below)
Since the turmoil in the banking system subsided earlier this year, deposit outflows have stabilized and bank lending growth has stopped declining. Nevertheless, lending growth remains slower than at the start of the year, and the renewed rise in long-term interest rates could reignite concerns about banks’ balance sheets. In this US Daily, we leverage the latest bank-level data from regulatory call reports to investigate the drivers behind the recent slowdown in bank lending and assess banks’ balance sheet health.
Going forward, we expect the drag on growth from tighter bank lending standards to fade because we expect bank lending standards to remain roughly unchanged in Q3—as fading recession fears and modestly higher bank stock prices roughly offset higher interest rates—and to start to normalize gradually next year. We expect the tightening in financial conditions and lending standards to generate a roughly 0.2pp drag on GDP growth next year, down from around 1pp in 2023 and 1.2pp in 2022.
The recent rise in long-term interest rates could bring back the concerns from this spring about mark-to-market losses on banks’ asset portfolios. Historically, banks have hedged their interest rate risk by matching the interest rate sensitivity of their interest income and interest expense (the deposit beta). Reassuringly, we find that this has remained the case this cycle and that deposit betas are only modestly higher now than at similar points in past hiking cycles for most banks.
Nominal bank lending growth has slowed from 10% to 2% since the start of this year on a 3-month annualized basis, for two main reasons. First, deposit outflows and higher deposit rates have led banks to reduce lending to a degree roughly in line with the usual historical relationships. Second, recession fears have likely led banks to reduce lending, and we find that banks that built upmore provisions for loan losses over the last year have slowed lending by more.
LPL - Seven Things to Know about Government Shutdowns (i’m interested in basic definitions — so #5 and 6 are fine BUT … how about the markets? and by that I mean EQUITIES cuz, you know, bonds are for losers ? maybe next time someone will write of bond reflex TO shutdowns — perhaps AFTER the fact?)
… 7) How do markets respond to government shutdowns?
Historically, markets were not materially impacted by a shutdown. For example, in 2013, the House and Senate were in a standoff over funding for the so-called Affordable Care Act and the government was shut down for 16 days during the first part of October. The S&P 500 had some down days but overall, the equity market took all the political drama in stride with a 3.1% advance during those 16 days. In this case, we think there would be minimal damage: the U.S. postal service is unaffected since it does not depend on Congress for funding; the Social Security Administration would keep issuing benefits and payments and Medicare and Medicaid would continue payments since many aspects of these programs are not subject to annual appropriations. If we had to highlight a downside risk, it would be if FEMA runs out of disaster relief should a major storm impact the country.
Soft confidence in recent years has not always translated into spending declines partly because consumers were flush with cash and had easy access to affordable credit. But with savings running dry and credit now scarce and costlier, the biggest monthly decline in consumer confidence since 2020 could be more impactful on actual spending.
Wells Fargo - New Home Sales Pulled Back in August.Higher Mortgage Rates Start to Weigh on New Home Sales (and they say common sense ain’t that common …)
Tailwinds for Builders Showing Signs of Fading as Mortgage Rates Edge Higher Thus far, builders have been largely successful navigating the headwinds triggered by the Fed’s monetary tightening cycle. Favorable supply dynamics and builders’ use of incentives have prompted new home sales to improve on balance this year despite the rising interest rate environment. Yet, the recent surge in mortgage rates may be weighing on demand as buyers increasingly become discouraged by the prospect of higher financing costs. New home sales dropped 8.7% in August, the largest monthly decline since September 2022. Generally speaking, monthly residential sales data can be quite volatile and subject to substantial revisions. However, it seems that higher mortgage rates are starting to take a bite out of buyer demand. The median new home price dipped 1.4% in August as builders were forced to step up their use of price cuts and other incentives to reinvigorate buyer interest. In our view, the near-term outlook for new home sales has been clouded by the recent uptick in mortgage rates. Per Freddie Mac, the average 30-year fixed mortgage rate has buoyed above 7.0% for the last six weeks, which will likely test builders’ abilities to bridge the affordability gap in the months ahead.
Wells Fargo - U.S. Government Shutdowns & U.S. Dollar Implications (for those playin’ the shutdown home game in the FX markets…i’m just thinking good for USD is GOOD for those assets denominated IN said USDs — EXCEPT that hasn’t much helped BONDS so far … still waiting … and so … nevermind, what do I know…except to say IF this were to be GOOD we know the USofA would then SCHEDULE a shut down every quarter …)
A potential U.S. government shutdown that could start October 1st looms, the chances of which are more or less seen as a coin flip at this point. Should a shutdown transpire, there could be a negative impact of the U.S dollar, albeit one that is likely to be modest and short-lived. Recent history suggests the U.S. dollar index (DXY) could fall by around 1%-1.5% in the several weeks following the start of the shutdown. Also in recent shutdown episodes, three months after the shutdown began the dollar had recovered its losses and there was no meaningful or long-lasting impact on the dollar. In the event a U.S. government shutdown does occur, we would expect a similar pattern to unfold, and we would not make significant changes to our longer-term outlook for the U.S. dollar.
Yardeni- Talking Heads Talk Stocks Down (by talkin’ the talk and doin’ so on TV on occassion, doesn’t that make Dr. Ed a ‘talkin’ head’?)
We were surprised that stock prices didn't drop yesterday along with bond prices. So we aren't surprised to see stock prices down today. Contributing to the selloff was JPMorgan Chase CEO Jamie Dimon, who warned interest rates may need to rise further to subdue inflation. In an interview with The Times of India, he said that the Fed might have to raise the federal funds rate to 7%.
In an article today, Minneapolis Federal Reserve President Neel Kashkari wrote that there’s nearly a 40% chance that the Fed might have to push the federal funds rate "meaningfully higher" to bring down inflation.
Meanwhile, there doesn't seem to be much progress in either negotiations to end the auto strike or to avert a government shutdown. The MegaCap-8 stock prices were weighed down today by falling valuation multiples in response to rising bond yields. The market also got hit after the FTC filed its antitrust lawsuit against Amazon….
In addition to all of that, a few other items once providing funTERtainment value to myself and institutional clients / friends,
Bloomberg - Five Things You Need to Know to Start Your Day (Asia — thinking BILL YIELDS vs stocks)
The stock market is buckling under the weight of a simple equation: cash earns more than equities.
Currently, six-month Treasury bills yield about 5.5% — the highest since 2001 — compared to the S&P 500’s earnings yield of roughly 4.7%. That’s the biggest advantage that cash has enjoyed relative to equities since 2000, according to data compiled by Bloomberg.
With the Federal Reserve’s resolve to keep interest rates elevated for longer firmly cemented in the market psyche, investors are increasingly opting for money market securities. They’re flocking to short-dated Treasury bills, which offer virtually zero credit risk. Assets in money market funds hit an all-time high of $5.6 trillion this month.
Authored by Simon White, Bloomberg macro strategist,
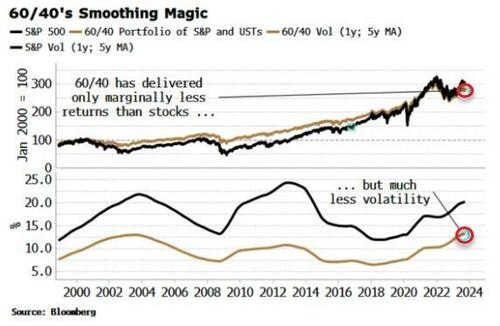
Bonds’ diminishing ability to act as a hedge for stocks jeopardizes the concept of the standard 60% equities, 40% bonds approach to portfolio design.
A lack of viable alternatives for bonds may lead to increased stock exposure, threatening long-term financial and economic stability.
TINA is coming back, but this time with a vengeance. In the salad days of zero rates and fast-expanding central bank balance sheets, stocks were the only game in town. Nothing - not bonds, commodities or real estate - offered higher returns. TINA - There Is No Alternative – really was it.
One pandemic, multi-decade-high inflation and over 500 bps of rate rises later, the investing landscape has changed fundamentally. Equities entered a bear market and have yet to re-take their January 2022 highs, but still, owning them might start to look even more unavoidable than before.
The game-changer is inflation. In last week’s column, I explained how elevated inflation has taken the stock-bond correlation positive after being negative for most of the last two decades. Bonds, i.e. USTs, are losing their ability to act as a portfolio and recession hedge. They are therefore prone to structurally higher yields as the negative risk premium they commanded for their hedging abilities is wiped out and significantly reversed.
If bonds won’t cut it any more, what then are some of alternatives for the “40” portion of the 60/40 portfolio? The attractiveness 60/40 with USTs was that they significantly reduced portfolio volatility, while only marginally reducing the total return over the past quarter of a century.
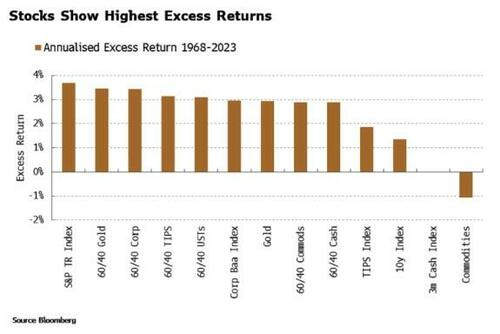
Thus any viable alternative to Treasuries ideally has a lower Sharpe ratio. I considered corporate bonds (Baa), TIPS, commodities, gold and cash as the 40% part of a 60/40 portfolio. I built indexes for each from the late 1960s, and looked at their excess returns (i.e. versus compounded three-month T-bill rates), in both real and nominal terms.
Over the whole period (1968-2003) stocks have the highest excess real and nominal return. They returned 8.2% annualized compared with 4.6% for cash, giving an excess nominal return of 3.7%. But inflation was 4% annualized over the period, meaning stocks have posted a negative real excess return over the past 55 years.
Other asset classes and 60/40 constructions I looked at delivered a lower excess return, while commodities posted a negative excess return over the period in question. Beating cash and inflation over the long term is not easy.
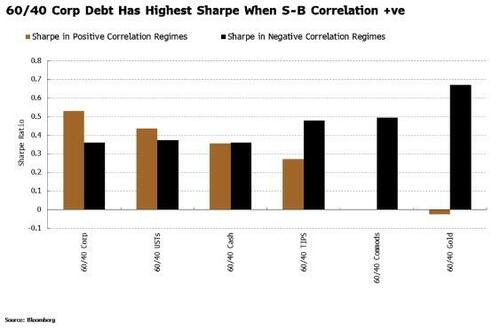
Let’s see how this changes when we condition on whether the stock-bond correlation is positive or negative (using the two-year correlation of one-week changes in the S&P and the Bloomberg Treasury Bond Index, smoothed over two years).
The results are not necessarily what you would expect. For a start, 60/40 with USTs has one of the lowest Sharpes in regimes when the stock-bond correlation was negative, being cleanly beaten by 60/40 with TIPS, commodities and gold.
In positive stock-bond correlation environments it’s even worse, with the Sharpe of 60/40 with USTs dropping to 0.27 from 0.56. Even though the nominal return of 60/40 USTs was higher at 9.7%, cash was also higher – as is typical when stocks and bonds are moving together. That led to a real excess return of only 3.1%, neatly illustrating why the bar for performance is even higher in positive-correlation regimes.
A 60/40 gold and 60/40 commodities strategy delivered the highest real Sharpe ratios when the correlation is negative, perhaps surprisingly given gold and commodities have greater volatility than equities.
High returns in especially the 1970s compounded up over time and outweighed the effect of their elevated volatility.
We are now in a positive-correlation regime, and there are no good options as all strategies, including 60/40 with USTs, have delivered a lower real Sharpe when stocks and bonds are positively correlated.
Naively, looking at the chart above, one would choose 60/40 with corporate bonds as the least worst option. But the Treasury market dwarfs the corporate bond market, and managers with liquidity constraints would be unable to replace the bulk of their USTs with corporates. Ditto with TIPS, gold and commodities, which anyway have lower real Sharpes than USTs. And cash is an unrealistic long-term option for investors who have to justify their fees, as well as entailing high rollover risk.
Bonds will still serve their purpose for liability matchers such as pension funds, but those running 60/40-like strategies (with hundreds of billions if not trillions of dollars under management) will find it increasingly difficult to justify maintaining the same proportion of bonds if they are not serving their central purpose of smoothing portfolio returns.
With no viable alternatives that are liquid enough, or likely to improve risk-adjusted returns, the temptation to add more equity risk and chase returns may become too great. That’s even more the case when we remember that both cash and inflation are higher than average when stocks and bonds track each other, as they do currently, intensifying the need to maximize returns.
There’s a weary familiarity to all of this. Needless to say, such rising concentration risk will increase financial instability and expose markets to significant falls over the longer term. This time, then, TINA’s return may be her swan song.
Stock markets have had another bad day. With equity investors taking losses, that should in theory encourage them to buy bonds when they’re cheap, but that doesn’t yet seem to tempt them. The move in the long-dated Treasury market grows steadily tighter.
One measure of this is the real yield (the yield on inflation-linked “TIPS,” which reflects the income you can expect to make over and above inflation). It has now reached 2.22%, only 10 basis points behind the bond market’s expectation of inflation as calculated by the gap between TIPS and fixed income yields. With the exception of one day when the market was scarcely functioning during the onset of the pandemic in March 2020, this is the narrowest gap since 2009:
This is significant. For the years since the Global Financial Crisis, bond yields have mostly been aimed at compensating you for inflation. The real yield on top reflects real financial tightening. When that real yield exceeds expected inflation, it’s a good rule of thumb that financial conditions have become truly restrictive.
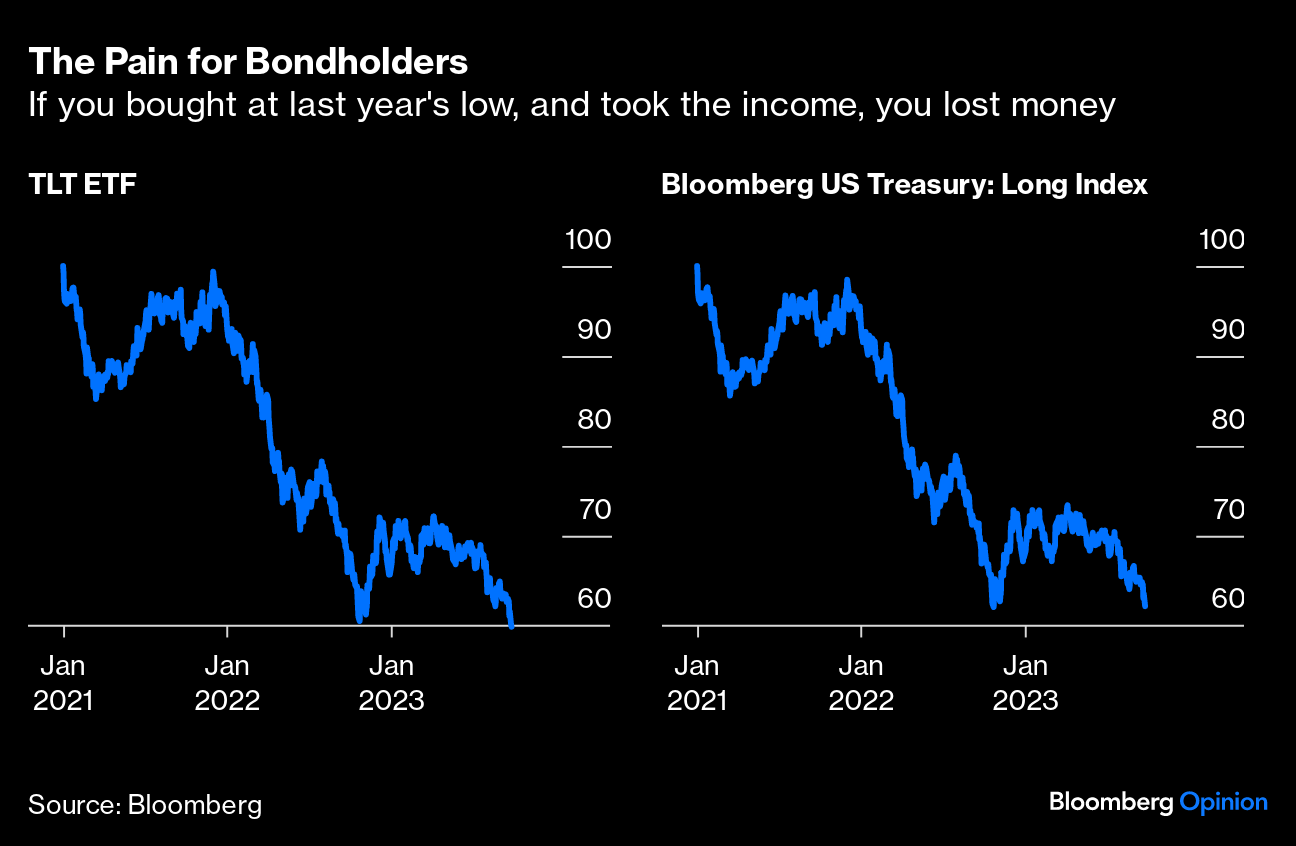
That is seen in renewed painful losses for bondholders. It appeared that the Treasury market had hit bottom last October and started to rally, buoyed by the Federal Reserve’s intention to decelerate its rate rises. Not so, we now know. The iShares exchange-traded fund that tracks the Bloomberg long-dated Treasury index, universally known by its ticker symbol TLT, is now lower than it was at the October bottom. The index itself, reported with a delay, is likely also to have set a new low once the figures are available. These are total return indexes; even if an investor bought at the exact low for long bonds last year, and took the income, they would still at this point have lost money:
This suggests that the bond market is at last helping out the Fed by making conditions genuinely tight. If there’s still concern that inflation isn’t beaten, that is exactly what the central bankers want. For several years before the GFC, then-chairman Alan Greenspan lamented that his rate hikes couldn’t shift the 10-year yield higher, in what he famously called a conundrum. It looks like the Fed under Jerome Powell has at last solved the puzzle. ..
Finally, as all this settling in and I’m still trying to make heads / tails of it all, I’d strongly urge one / all to (re)watch the DiMartino Booth / Lacy Hunt interview noted this past weekend (HERE) and can’t help summarize what it might be like if any of you all sat down with ME to talk ‘shop’ …
Dollar UP, yields UP, economy, well … not so much? AND … THAT is all for now. Off to the day job…
As a Gold Bug-anarcho capitalist-sound money man, I take great issue with the statement 'gold is more volatile than equities'. Um that's a big HELL TO THE NO! It's not gold that's volatile it's the underlying currencies in which gold's prices in. Look at Alisdair MacLoed's chart of oil priced in both gold and dollars. The stability of oil priced in gold vs dollars....well only blind squirrel can't see the difference!


As a Gold Bug-anarcho capitalist-sound money man, I take great issue with the statement 'gold is more volatile than equities'. Um that's a big HELL TO THE NO! It's not gold that's volatile it's the underlying currencies in which gold's prices in. Look at Alisdair MacLoed's chart of oil priced in both gold and dollars. The stability of oil priced in gold vs dollars....well only blind squirrel can't see the difference!
No one here actually gives any credence to that symmetrical fall projected in the future overnight FFR next yr, right?