(USTs higher, curve 'sharply bull-flattening' on above avg volumes) while WE slept; "Frantic Dis-inversion In Treasury Curve May Have Further To Run" (framed as bearish duration)
Good morning … While many / most continue debating how it is that HIGHER bond yields likely to do the Feds own TIGHTENING work for it and so, put us closer TO rate CUTS (? … WSJ “Higher Bond Yields Likely to Extend Fed Rate Pause” … ) it might be worth at least a topical mention of the other side of the coin?
Reuters: Fed's Bowman says US policy rate may need to rise further
… "Inflation remains well above the FOMC's 2% target," Bowman said in remarks prepared for delivery in Marrakech, Morocco, referring to the U.S. rate-setting Federal Open Market Committee…
… "This suggests that the policy rate may need to rise further and stay restrictive for some time to return inflation to the FOMC's goal," she said…
Don’t like REUTERS (or having troubles sleeping at night) then have at THE SPEECH, “Financial Stability in Uncertain Times” and turn to p2 for these comments…
Moving right along, how ‘bout that 3yy auction
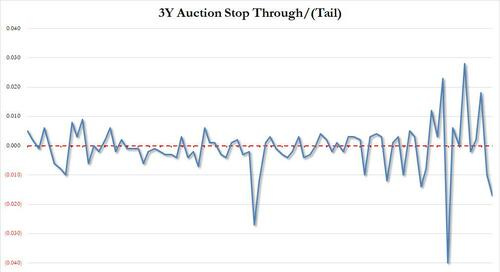
ZH: Ugly 3Y Auction Sees Slide In Foreign Demand, Biggest Tail Since February (ruh roh, RelRoy)
Ugly 3Y Auction Sees Slide In Foreign Demand, Biggest Tail Since February
In a day that has seen yields slide across the curve in what some say is a powerful reversal from what may have been the cycle highs on Friday, moments ago the Treasury sold 3Y notes in a concession-less auction that saw rather disappointing demand and metrics.
The high yield of 4.740% was another cycle high, up from 4.660% last month and the highest since Feb 2007; the auction also tailed the When Issued 4.723% by 1.7bps, the biggest tail since February's record 4bps, and the third biggest tail in the past decade.
The bid to cover was also ugly, sliding to 2.562 from 2.751 in September, the lowest print since February and well below the six-auction average of 2.792.
The internals were also not pretty: foreign buyers were awarded just 56.0%, the lowest since Oct 22 and far below the 66.2% recent average; and with Dealers awarded a surprisingly high 22.1%, the most since October, Directs were left with 21.9% of the auction, both well above recent averages (14.8% and 18.8% respectively).
Bid / COVER, TAILS schmails RIGHT?
WRONG … for more SEE Apollo note HERE as to WHY bid / cover ratios matter and kindly see the note before this afternoons 10yr auction so we can get this process sorted out … certainly before CPI (chased down by 30yr re-auction)…
AND so, we now get chance to reconvene and witness any / all those wishing to make a statement with regards to a view of rates 10yrs forward …
Momentum becoming increasingly OVERBOUTH (stochastics, bottom panel) and the stunning move higher over the past several weeks has its very own exclamation point of a move back DOWN since NFP Friday CHEAPS of nearly 4.90 (think CONCESSION right there) all the way back down to SUB 4.60% …
Good luck to those tasked with bidding on this afternoons reopening and in the meanwhile … here is a snapshot OF USTs as of 705a:
… HERE is what this shop says be behind the price action overnight…
… WHILE YOU SLEPT
Treasuries are higher with the curve sharply bull-flattening overnight after the Tsy 2s10s curve rejected range resistance near -26bp last week. See discussion below for more on curves and curvature. DXY is UNCHD while front WTI futures are modestly lower (-0.35%). Asian stocks were mostly higher, EU and UK share markets are mixed while ES futures are showing +0.25% here at 6:45am. Our overnight US rates flows were light during Asian hours with some real$ selling seen in the long-end. The overall tone was 'flatter' during their hours with a large block (FV-US) flattener setting the backdrop. During London hours, short-covering was a clear theme amid headlines of missile exchanges between Israel and Lebanon- adding to the 'risk-off' tone this morning. Overnight TY futures volume was ~115% of its 30-day average…… Back to developments in duration, curves and elsewhere... Our first attachment this morning looks at Treasury 5yr yields breaking through its bear trendline today with tactical momentum (lower panel) aiming strongly to lower rates still.
More interesting is our next zoomed-out look at the medium-term, weekly chart of Treasury 5yrs where, in the lower panel, you can see momentum just beginning to flip bullishly. If this emerging bull signal is confirmed at Friday's post-CPI close, it would further cement the idea that the move highs in rates are likely in for 2023. Simply, bullish breakouts are expanding outward from the front-end while beginning to extend outward across the momentum timeframes. This is exactly what a chart observer would like to see to mark the end of a bear phase and the beginning of a new bull phase.
NOTED … bullish curl / CROSS in 5yy on WEEKLY BASIS and while I note just the opposite — on a DAILY 10y above — it is worth noting even IF premature to weeks end. Still a great chart from those who still have a Terminal (so clearly THIS VIEW > my humble sketchings) … and for some MORE of the news you can use » The Morning Hark - 11 Oct 2023 and IGMs Press Picks (who CONTINUES to be sportin’ that new, fresh look) in effort to to help weed thru the noise (some of which can be found over here at Finviz).
Moving from some of the news to some of THE VIEWS you might be able to use… here’s SOME of what Global Wall St is sayin’ (in a similar sorta way you’ll find content if you pay for ZH PREMIUM? except … they are SELLIN other folks data where as I’m just point it out and links provided — should work IF you have permission and should NOT work if you don’t … HOW can THEY do that?? askin’ for a friend as I never understood how they do it…)
BNP - US equities: Macro vs Micro
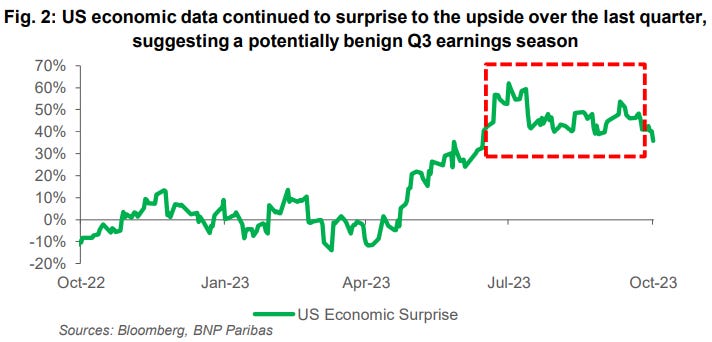
Macro vs micro: Despite the recent spot corrections, the market has held 4200 in the short-term, a key technical level for an acceleration to the downside. Ahead of Q3 earnings, we see more risks to US equities coming from macro volatility than the upcoming reporting season. Through Q3, the data continue to surprise to the upside, and earnings forecasts have been revised higher. We still think the bottom-up consensus earnings for 2024 of >12% YoY growth is overly optimistic, but nor is it obvious that Q3 earnings will be the catalyst for downgrades.
Trade ideas: Equity realized volatility has failed to pick up meaningfully in spite of the recent spot declines. The combination of poor carry and flat skew leaves the upside implieds screening rich. Our preferred bullish trades through earnings season monetize the expensive right tail. We suggest considering call ratios or flies in QQQ, XLE, KRE. IGV vol has been one of the better ETF vols to carry and is our preferred right tail to own.
With a late-cycle feel to markets, we suggest a defensive tilt to equity exposure. However, in a higher-for-longer rates environment, that might be better achieved by focusing on metrics such as balance sheet quality rather than rates-sensitive Defensives. In the index space, tight OTM Put Spreads in SPX and RTY are our preferred hedges for a break to the downside.DataTREK - Big Money Risk Index, Bonds During Mideast Conflicts
… Topic #2: The history of “higher for longer” Fed Funds. The chart below shows the Effective Federal Funds rate from 1980 to the present. We have highlighted times where rates were high and stable, along with the duration of those periods.
Three points on this data:
Fed rate policy changed after the 1980s. During that decade, Fed Funds were constantly evolving as the FOMC fine-tuned policy. Since then, changes have been more muted.
The 1990s saw a 5-year period of relatively high rates (5 – 6 percent), from 1995 to 1999.
Since then, periods of high and stable rates have been getting shorter. In the 2000s, Fed Funds peaked at 5.25 percent for just 1 year. In the 2010s, they reached 2.4 percent, but for only 6 months.
Takeaway: The FOMC’s current Summary of Economic Projections says Fed Funds will stay above 5 percent through the end of 2024, which would be 2 years of rates above that level. History shows we have not had such a long stretch of “higher for longer” since the 1990s. Markets know this, which is one reason why Fed Funds Futures only put 9 percent odds on rates being above 5 percent at the end of 2024. That is a fair assessment, in our view, not markets being irrationally dovish.
Topic #3: How long-term US Treasuries have reacted to oil shocks and military conflicts in the Middle East. We’ve seen yields pull back in over the last 2 days, a welcomed shift from the 800-day bond market rout Jessica discussed yesterday. The question now is “are we at a turning point?”
The historical record is mixed on this point, should tensions escalate:
In the year after the 1973 Yom Kippur War and subsequent Saudi oil embargo, 10-year Treasury yields rose from 6.7 to 7.8 percent. Dramatically higher oil prices stoked inflation, so no surprise there.
The Iranian Revolution reached its climax in January 1979, when the Shah was forced into exile. Oil and gasoline prices doubled, once again feeding inflation pressures. Ten-year Treasury yields went from 9.0 to 10.3 percent over the course of the year.
Iraq invaded Kuwait in early August 1990, with 10-year yields at 8.4 percent. Oil prices spiked through October but then began to decline in anticipation of successful military action to liberate Kuwait. A year later, 10-years yielded 8.2 percent.
The US Congress approved military action against Iraq in October 2002. Ten-year yields at the time were 3.6 percent. They got as low as 3.3 percent a few months later but, 12 months hence, 10s were yielding 4.3 percent.
Takeaway: The only time 10-year Treasuries rallied over the 12 months after a crisis in the Middle East was in 1990, because the resultant oil price spike was short and markets had confidence energy prices would remain relatively stable. Otherwise, long term yields rose because markets were rightly concerned that inflation may increase. This is a useful framework to understand how markets are considering the evolving situation in Israel and Gaza. Oil prices, no surprise, are the key. The good news, of a sort, is that Washington understands how important energy prices are to the US economy. Any disruption in supply will be treated as an existential threat and dealt with accordingly. This, in short, is why stock and bond markets are rallying just now even as tensions in the Middle East continue to rise.
DB - Prescribing a lower rate path (these folks either going to look brilliant OR eventually mark their call — along with everyone elses — to market)
The fed funds rate path is a core component of our framework for forecasting Treasury yields. As described in our rates forecast update last week, we project that the Fed will hold rates steady at today’s level before cutting by 50bps next June. We project another 75bps of cuts in Q3 2024 before slowing to 50bps of cuts per quarter through Q2 2025, bringing the fed funds rate to 75bps below the nominal neutral rate. We then anticipate that the Fed will hold the policy rate constant until Q1 2026, where they deliver the first of 3 quarterly 25bp hikes to move policy back to neutral. This described path is in line with our US economists’ forecast for a mild recession starting in Q1 2024.
Today’s chart highlights how our projected policy rate path compares to market pricing as well as paths generated by policy rules the Fed consults in its decision-making process. The shaded area showcases the range of policy rate paths prescribed by inertial versions of the Taylor rule, the balanced-approach rule, and the balanced-approach (shortfalls) rule. We set NAIRU at 4% and r* at 1.25% for calculating these prescriptions, which is in line with our rates forecast.
As shown in the chart, our forecasted fed funds rate path incorporates more cutting compared to market pricing. However, our projected cuts are mild compared to the range of suggestions by the inertial policy rules using DB’s economic forecast.
HSBCs - The Major bond letter Fixed Income. October Effect.
Why does it always seem to happen in October? This time last year the UK gilt market was in a tizz as the UK government delivered, and then quickly reversed, a radical budget. This year, we have seen yields surge in the USD25trn Treasury market, with an expanding budget deficit again central to the narrative.
Going back, we recall a lot of action in bond markets around this time of the year. In October 2014 there was a “flash crash” which resulted in US yields diving lower. Seemingly the catalyst was a weaker than expected data release, which prompted a huge short-covering move1 . A year before this the 2013 taper tantrum was in full swing as bond markets over-reacted, as it turned out, to the end of QE.
… There are plenty of explanations of what’s behind the October market moves, particularly in the stock market where we find a full range from seasonal superstitions to more worthy behavioural finance studies. Stock markets are said to have an “October effect”, which describes big declines in the equity market that have often occurred in this month. Some of us are old enough to remember 1987, and we can all read about 1907, 1929, and other historic events.
We think the big moves in the bond market this October were founded on three conditions. First, the US recession that was initially anticipated some 15 months ago, at least according to the yield curve, is still not here. Second, deficits have continued to expand, and this through a period when the economy has in fact been holding up rather well. Third, following an aggressive tightening of policy, the yield curve has remained resolutely inverted, at least until now.
Put differently, investors were previously buying bonds with yields significantly below what’s offered on cash, and doing so through a time when the government was issuing tons of them. This would normally be okay if there was a recession looming hat would push bond prices higher (yields lower). But the recession – and thus the demand for the safety of government bonds – just hasn’t happened. There never seem to be enough ‘safe’ bonds when investors are, all at once, fleeing from equities, credit, EM, and the other riskier asset classes.
… As Mark Twain said about the October phenomenon in Pudd’nhead Wilson: “October. This is one of the peculiarly dangerous months to speculate in stocks. The others are July, January, September, April, November, May, March, June, December, August, and February.”
NatWEST - JPY investor flows: Buyers of foreign sovereign bonds in August (stale but something inst investors used to pay attention to)
… Buyers of USTs worth €4.1bn in August, after remaining seller in the previous month. YtD 2023 buying flows now stand at €83.7bn. They had sold €96.9bn of USTs during the same period last year. However, USTs still offer the worst yield pick-up (on a cross-currency hedged basis) after Bunds, of all major global bond curves to JPY investors, in our view.
UBS (Donovan)- US politicians at play (can’t take this guys attitude … I mean its not as if UK politicians and political system is SO stinkin’ much better or less funTERtaining)
… The minutes of the last Federal Reserve meeting are due. However, recent Fed speakers have offered a suspiciously coordinated set of dovish comments—almost as if trying to talk bond yields lower—and those remarks may take precedence over the minutes …
UBS - CTAs Positioning and Flows - Biweekly Update (POSITIONS of all shapes and sizes matter)
No love for stocks or bonds, CTAs are very short both
… Weeks go by and the bond market still can't find any supporter. Being max short, CTAs are far from being one of them, although they did not contribute to the last leg higher in yields. Their duration trade is now very deep "in the money", meaning that for CTAs to start unwinding their shorts, we will need to witness a proper bond rally (>40/50bps) …Wells Fargo - Israel-Gaza Conflict Views & Potential Implications
Summary
After years of geopolitical developments altering the direction of the global economy and financial markets, the conflict in Israel and Gaza has the potential to further disrupt economic and financial markets trends. In this report, we provide perspective on the possible implications—geopolitical, economic, markets and political—of military conflict between Israel and Hamas…… The Israel-Gaza conflict is likely to compound and exacerbate deglobalization…
… Israel's focus to shift away from local political divisions and toward geopolitical risk management…
… Geopolitics can play an outsized role in many of next year's elections. 2024 is likely to be a year defined by elections, and we expect geopolitics to be a point of contention for voters as many developed and emerging market countries host general and legislative elections next year. We have already seen geopolitics cause political fracturing in the United States with additional funding for Ukraine a sticking point that nearly caused a government shutdown earlier this month. U.S. politicians will discuss appropriation bills again in November with no bi-partisan longer-term resolution on additional Ukraine support since the short-term funding deal in early October. Ukraine aid will likely still be a source of dispute in November, and with Israel already a large recipient of U.S. aid, conversations will now likely include increasing support to Israel as well. Federal spending plans could play a role in determining voter intentions during the U.S. election cycle next year, especially as aid fatigue has started to set in. Similar sentiment could spread around the world and could result in more protectionist and domestically focused policy platforms gathering momentum internationally. Not only could new protectionist policies result in additional deglobalization forces, but unorthodox policy platforms could also disrupt local financial markets and economic activity. Israel and Ukraine will likely be a topic of debate leading into the 2024 U.S. election; however, geopolitics can also be a theme in Narendra Modi's campaign for another term as prime minister of India, President Putin's reelection bid in Russia and Taiwan's presidential election. Many African nations will also host elections in 2024. Africa has become a geopolitical hotspot not just because of recent military coups, but also due to most of Africa signing up for China's Belt and Road Initiative (BRI) as well as China being a major sovereign creditor to many debt-distressed countries in Africa. African nations can benefit from China's BRI-related infrastructure plans, but at the same time, have had difficulties restructuring sovereign debt with China as a majority bondholder. Should policy platforms across the continent shift toward developing closer relations with the U.S. as opposed to China, Africa could become the next source of global geopolitical tensions.
Wells Fargo - NFIB Small Business Optimism Index Declines Again in September
Summary
The NFIB Small Business Optimism Index fell to 90.8 in September from 91.3 in August. Optimism is up a bit from the low of 89 hit in April 2023, however over the past few months, the index has been hovering around levels not experienced since 2012 in the aftermath of the Great Recession. Ongoing pessimism on the part of small firms reflects a long list of challenges which include inflation, labor shortages, higher financing costs and reduced credit access. Although some of these macroeconomic factors have improved this year, small firms do not appear to be convinced that the road ahead is clear of obstacles. The share of firms expecting the economy to improve over the next six months, which is still near a record low even after turning up in the summer, deteriorated for the second consecutive month in September.
… And from Global Wall Street inbox TO the WWW,
Bloomberg (via ZH) - Frantic Dis-inversion In Treasury Curve May Have Further To Run (and generally speaking this un-inverting not an equity market positive, IMO)
By Ven Ram, Bloomberg markets live reporter and strategist
Interest-rate traders reckon the Federal Reserve won’t have to raise rates again this year, but the markets are doing a far more effective job of tightening financial conditions. Which is why long-dated yields have surged to the exclusion of those at the front end (notwithstanding the rally today).
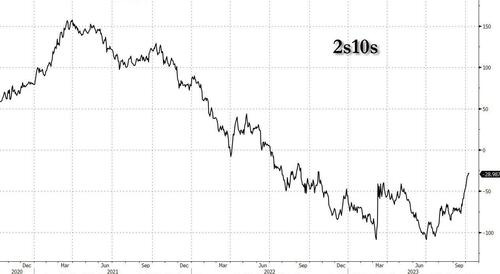
That has spurred a frantic dis-inversion in the Treasury curve since the start of the second half of the year: 10-year yields, which were some 100 basis points lower than the two-year rate at the end of June, are now only some 30 basis points lower.
Much of that rapid dis-inversion in the nominal yield curve has been underpinned by soaring real rates. For instance, 10-year inflation-adjusted rates are now near the highest level since the global financial crisis, boosted in part by a paradigm shift in investors’ time preference. And with geopolitical tensions flaring again in the Middle East, that trend may well accelerate, with investors deciding to consume now and seek a higher discount rate on assets that will pay out at a future point. The implication of all that is that long-dated yields may have little incentive to come off the boil yet.
What happens to the front end, though? My two cents is that the markets are underpricing the risk of the Fed staying higher for longer. Just last week we got another eye-popping expansion in the labor market, and with oil prices climbing afresh this week, there is little to suggest a Fed pivot is imminent.
Even so, the dis-inversion in the curve may have further to run yet, with long-dated yields rising more to possibly equal those on the two-year maturity. That would, of course, mean a yield curve that is back at zero — which would send headline writers into a tizzy.
Bloomberg - Inflation appears beaten, but pain over credit isn't (Authers’ OpED)
Setting Expectations
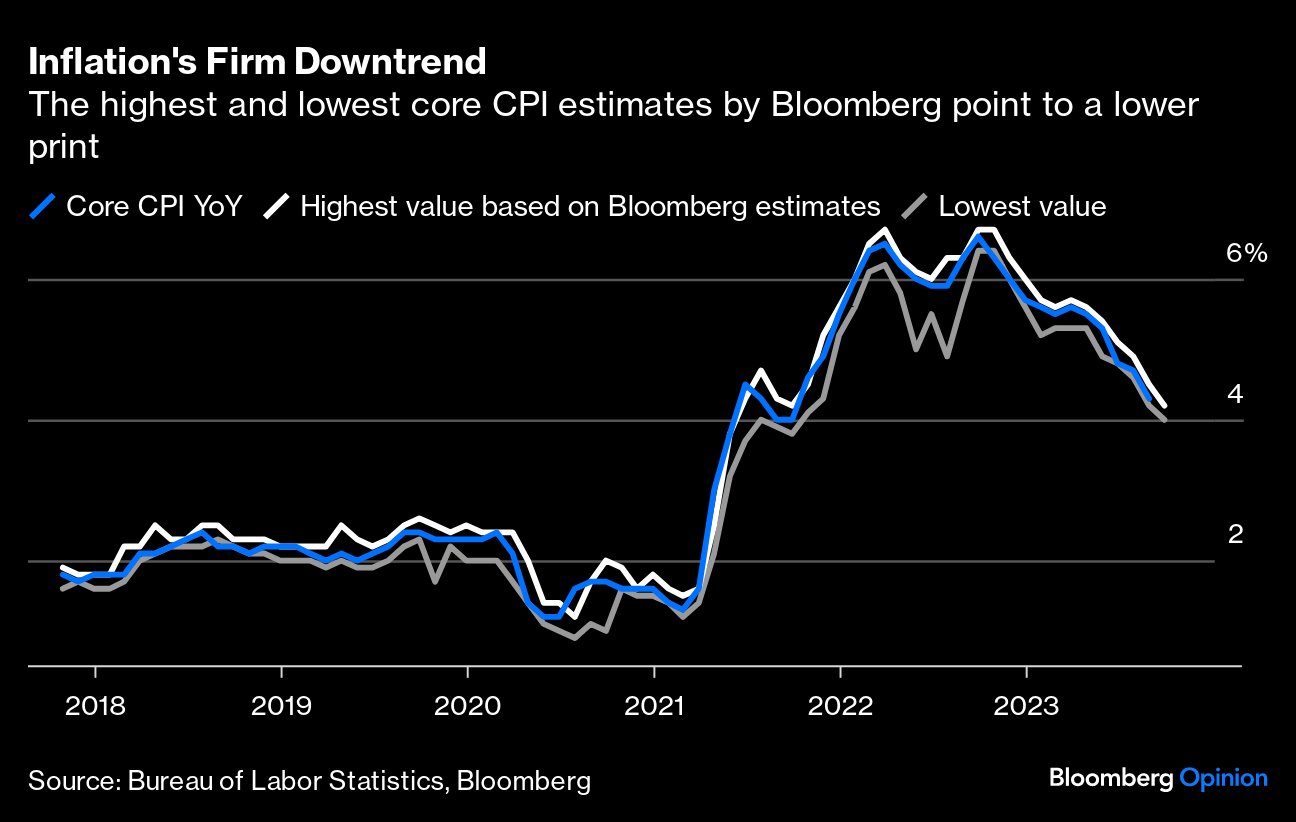
CPI day is almost upon us once again, with the US Bureau of Labor Statistics unveiling the numbers for September on Thursday. But to faithful followers, the print itself may not be that exciting. Expectations, whether the most optimistic or most pessimistic, point to a softening — if the economists surveyed by Bloomberg are any guide.Ever since September last year, the trend in core inflation (excluding food and fuel) has been firmly lower. The graph below shows the highest value predicted (white line) and the lowest (gray line). Both point downward, with the actual core consumer inflation print (blue line) comfortably in between. This was not always the case. As recently as August 2022, the actual print was in line with the highest estimate while in 2021 inflation twice came in higher than even the highest prediction:
That helps to explain market action, with belief in a “soft landing” gaining traction steadily as the financial community builds confidence that it actually understands inflation now. Bloomberg Intelligence’s house view sees both headline and core CPI inflation to post a 0.3% month-on-month gain in the September report. Year-over-year CPI inflation will remain at 3.6% in September, with annual core inflation falling to 4.1% from 4.3%, according to a recent note by Anna Wong, chief economist at BI.
The moderation in headline CPI is due to average daily gasoline prices holding nearly constant from the previous month — eliminating the primary source of August inflation pressures. A seasonally adjusted increase in used- and new-car prices will boost core goods inflation. Disinflation remains elusive in some sticky core services categories, such as car insurance, but that should be offset by clearer signs of disinflation in shelter.
To Omair Sharif of Inflation Insights, there is a “decent chance” that core CPI could just end up with a 0.1% reading — implying that it would actually surprise to the downside. This, he added, may push investors to think “the Fed won’t need to stay as high for as long, and we could see some repricing of the rate path.” If such a reading unfolds, he pointed out this would be the first month at this level since February 2021 and would put the “average core rise over the four months from June to September at 0.17%, or about 2.1% annualized.”
The blowout September jobs report, a true surprise, did little to help settle the debate. Instead, this week’s two critical economic indicators — CPI and Friday’s release of the University of Michigan consumer-sentiment survey — may give a more definitive read, said Wong:
We expect September core CPI inflation to come in somewhat higher than consistent with the Fed’s 2% mandate, while higher gasoline prices may have pushed up short-term inflation expectations in the preliminary UMichigan survey for October.
… What Is Expected From the Fed
… But the Fed’s minutes may matter less than usual because governors have changed their messaging in the last two days in a more dovish direction. On Tuesday, Fed Bank of Atlanta President Raphael Bostic said policy is restrictive enough to bring inflation back to their 2% goal. “I actually don’t think we need to increase rates anymore,” he said.This comes after Fed Vice Chair Philip Jefferson on Monday said that officials are in a position to “proceed carefully.” In the same conference, Dallas Fed President Lorie Logan indicated that if risk premiums in the bond market are on the rise, that “could do some of the work of cooling the economy for us, leaving less need for additional monetary policy tightening.”
Not all governors are in agreement on this. Minneapolis Fed President Neel Kashkari said he wasn’t yet convinced that a surge in long-term Treasury yields would lessen the need for further rate hikes. “It’s certainly possible that higher long-term yields may do some of the work for us in terms of bringing inflation back down,” Kashkari said Tuesday. “But if those higher long-term yields are higher because their expectations about what we’re going to do has changed, then we might actually need to follow through on their expectations in order to maintain those yields.” The direction of travel of the committee as a whole, however, seems clearly to be shifting away from further hikes.
That explains why many economists are beginning to look forward, on the assumption that inflation is licked and rate rises are over — but the ultimate pain that must be suffered in consequence remains to be determined. For David Folkerts-Landau, group chief economist at Deutsche Bank AG, we have now reached “a decisive moment for the economy and markets.”
The main central banks have likely reached their respective terminal rates, and the effects of tighter monetary policy continue to flow through with a lag. In turn, markets experienced one of the sharpest rises for long-dated borrowing costs in decades, and yields have broken out of the bull-market trend that had been ongoing since the 1980s. Whilst a soft landing looks more plausible, the risks of another accident are growing. The months ahead will prove critical.
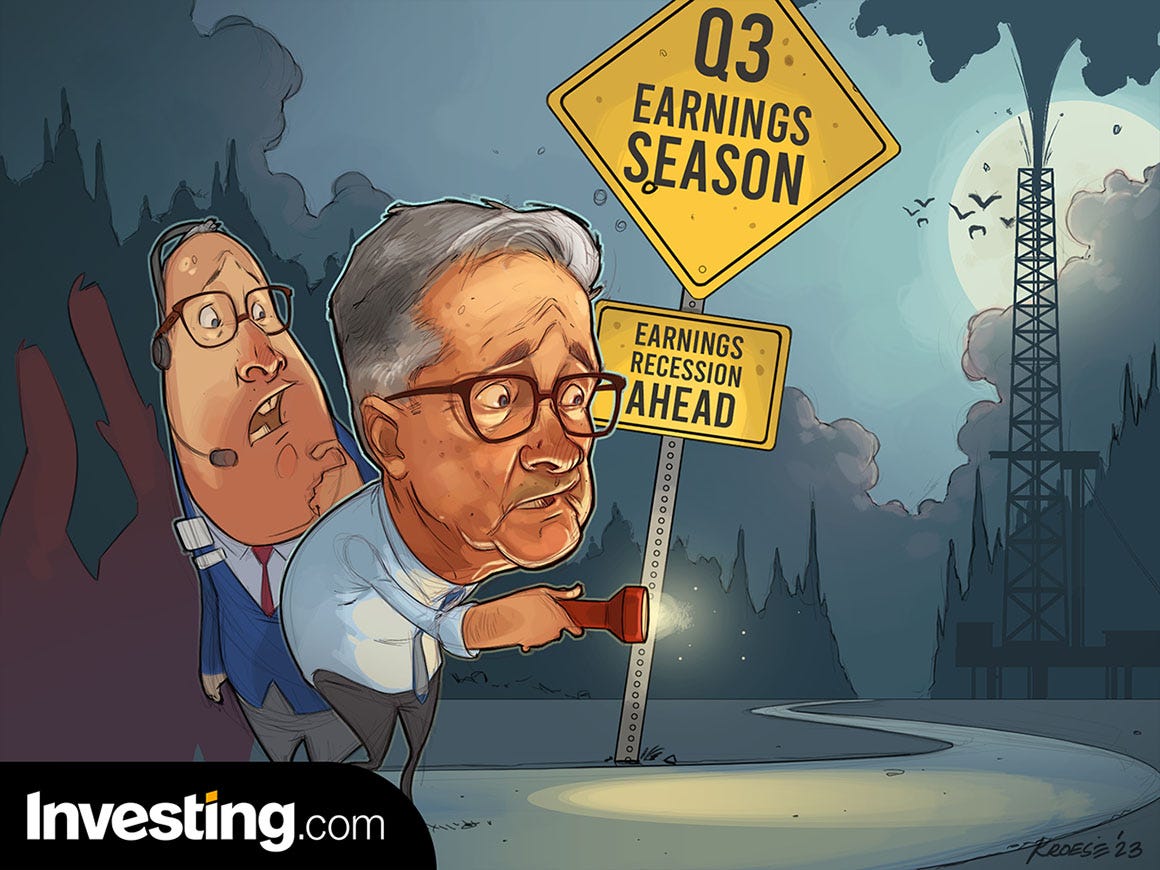
AND ahead of Friday … earnings season getting underway — a live look in to how officials will be watching their Bloomberg Terminals,
AND … THAT is all for now. Off to the day job…





THAT was some high octane reading big thanks. I highly recommend giving a listen to Jim Bianco being interviewed by Keith over at Hedgeye yesterday. Jim is RIGHT behind Lacy Hunt and DDB as far as must listens go imho. Jim's got some incredible thoughts & insights on where he thinks rates and the economy are headed.
I'm highly sympathetic to the plight of the Palestinians. Their lack of received help from their Arab state neighbors (Egypt sealing Gaza boarder tunnels and checkpoints for example) deserves its own documentary. But the biggest "L" (for LOSERS) must be awarded to The Squad and their mates over at the BLM. Tweeting-X'ing support for murderous and rapist Hamas paragliding militants many not age too well, just sayin'