Good morning. I hope this short note finds you well and you / yours all safe given the current geopolitical state of affairs. Situation in the middle east is likely to be heating UP over next several days / weeks, impacting markets as well as things far more important.
I wanted to send a quick note in addition TO what was mentioned HERE yesterday where the world wide web AND the sellside cognoscenti offered NFP recaps and victory laps seemingly celebrating what appears to ME to be somewhat unchartered or rarely seen waters of stagflation…
Stagflation is the simultaneous appearance in an economy of slow growth, high unemployment, and rising prices. Once thought by economists to be impossible, stagflation has occurred repeatedly in the developed world since the 1970s. Policy solutions for slow growth tend to worsen inflation, and vice versa.
-Investopedia (HERE)
With(out) stagflation in mind, a couple additional items hit the Global Wall Street Inbox and are NOT included on this weekends STUFF,
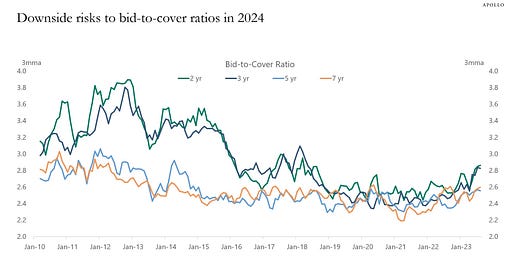
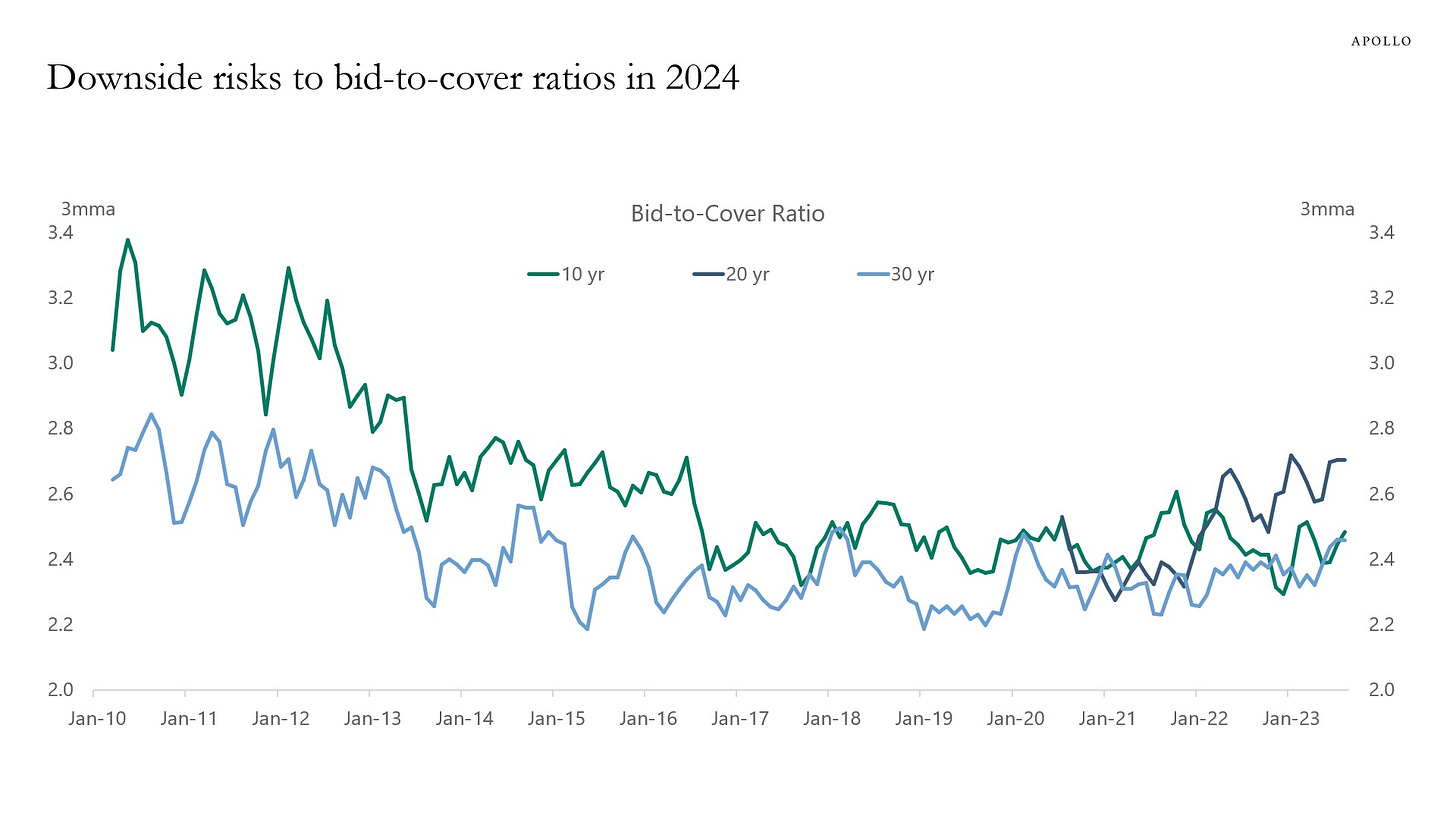
Apollo - Bid-to-Cover Ratios Are Key (ahead of reopenings there are some reasons to pay attention TO the details of the auction process)
The bid-to-cover ratio is the dollar amount of bids received in a Treasury security auction versus the amount sold. In other words, the bid-to-cover ratio says something about how much demand there is for US government bonds across the yield curve, see charts below.
During Covid, the monthly budget deficit peaked at 15% of GDP, and the big supply of government debt put downward pressure on bid-to-cover ratios in Treasury auctions.
At the same time, the Fed was doing QE and putting downward pressure on rates.
Looking into 2024, Treasury issuance is rising, and the Fed is doing QT, putting downward pressure on bid-to-cover ratios and upside pressure on rates.
The bottom line is that the supply of Treasuries continues to increase and investors should look at bid-to-cover ratios for signs of weakness in demand for US government bonds.
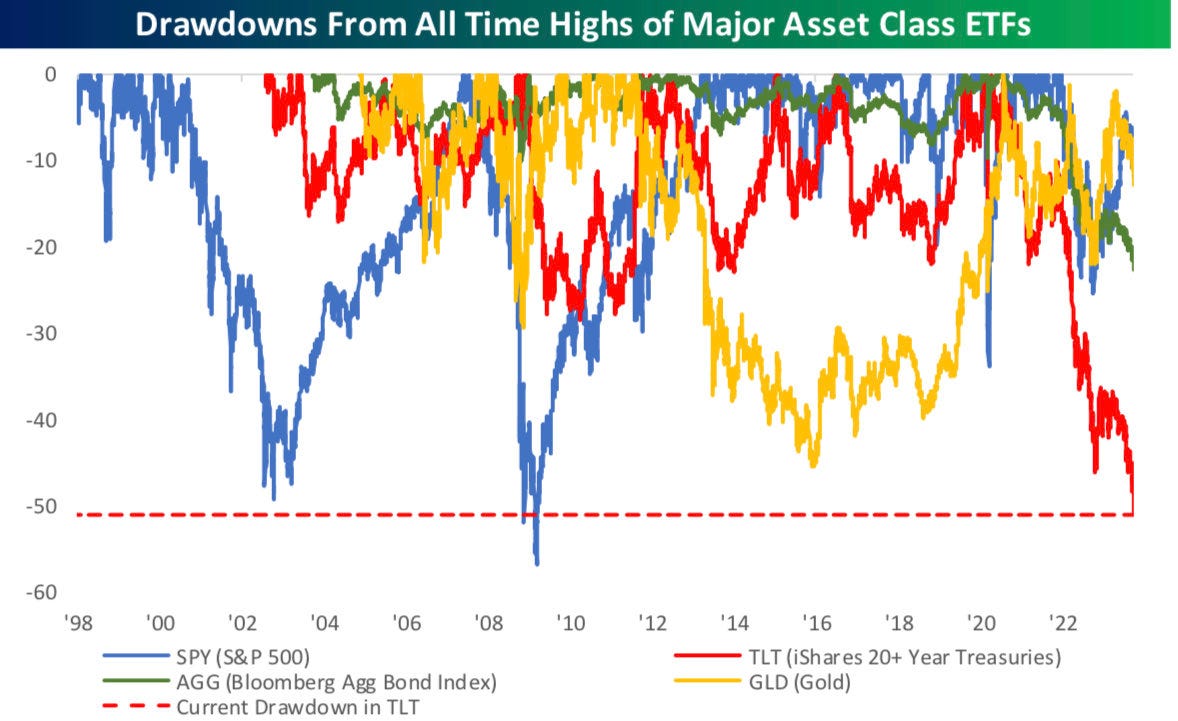
Bespoke ‘Stat of the day’ (for those TRYING to ‘game’ things with CASH bond markets closed tomorrow…good luck with that)
The drawdown for the long-term Treasury ETF $TLT is now more extreme that the S&P’s drawdown during the Dot Com Crash:
BNP - Sunday Tea with BNPP: Defying gravity (positions and correlations here are worth pausing a moment to click — if permissioned — and read)
KEY MESSAGES
Another very strong US payrolls report is supporting the notion that the Fed can hold rates in restrictive territory for longer than previously thought.
The combination of a higher-for-long Fed, increased sovereign supply and technical factors continues to add to worries about the stability of the US long end.
This week’s focus will be on US CPI, where we see two-sided risks to consensus.
… adding fuel to the fire are technical factors affecting the back end as well. Specifically, asset managers who are very long US futures (Figure 2) are seeing their duration exposure extend as yields move higher, as the rates selloff has pushed the “cheapest to deliver” (CTD) further out the curve. At the time of writing, we calculate that another ~15bp parallel shift in the yield curve higher from here will shift the CTD out again. This may in turn be restricting market participants’ appetite to “buy the dip”. And in more extreme scenarios, market participants may find themselves sufficiently overweight duration, resulting in even more selling of US Treasuries…
This is important, as what’s happening in the US back end is not only impacting rates but also increasingly driving all other asset classes, with the S&P 500’s negative correlation to rates, for example, near extremes (Figure 3)…
MS - Sunday Start | What's Next in Global Macro: Growth, Inflation, and Policy … Pulling in Different Directions
The strong US jobs data on Friday reinforce questions that have been driven by the recent sell-off in interest rates. When will the Fed stop hiking and when will it cut? I always like to think in terms of plausible scenarios appropriately weighted, starting with the baseline, quickly followed by the ways we could be wrong. The Morgan Stanley baseline view has been that the Fed finished hiking in July but will keep the policy rate “higher for longer,” as the saying goes, and only gradually lower rates next year. Continued strong data force us to contemplate another hike. And another hike would mean an even longer wait for rates to come down. On the other hand, comments about recessions have quieted down but not died out. This cycle is different from those of the past 30 years or more because the Fed is actively trying to slow the economy. That fact matters, because if the Fed causes a recession, it can undo this itself, and likely with only moderate cuts…
… What can we say about the path for rates, then? If stronger data do result in a hike this year, then our call for a cut in March 2024 will have to be reconsidered. Stronger data alone demand that we pressure test our timing assumption, and because the FOMC tends to be somewhat inertial, it takes time to reverse course. The result is both a higher peak and a higher path for all of next year…
… We are still holding to our baseline view, relying on noticeable slowing in the fourth quarter to stay the Fed’s hand. We all need to think about the other scenarios. Clearly, the market has reacted to the fact that if growth is stronger, the policy rate will be higher, and the Fed may hold at that level longer. In the recession scenario, though, the likelihood that the policy rate will be much lower is probably limited.
Interesting, indeed.
That said, a quick reminder … it was on this day in 2008, the Fed joins the ECB, BoE, Canada, Sweden and the Swiss CUTTING RATES …
This is a slide offered (p60) in 2020 chartbook by the folks at Yale School of Management and the Hutchins Center on Fiscal & Monetary Policy at Brookings
This is NOT a reminder dropped today BECAUSE it is a forecast of what may be to come … in fact anything BUT.
They say, though, that those who do not learn from history are doomed to repeat it and to doubt the temerity of global policy makers to come together in times of duress (perceived or actual) and to take action, would seem to ALWAYS be a bad bad.
I hope there is decisive action amongst these very same ‘brave policy makers’ with geopolitical regards … ‘taking steps to free up $6bb for Iran’ does NOT seem to be — IN HINDSIGHT — a judicious call. It is NEVER too late to right a wrong.
Ask monetary policy makers back in October of 2008.
Given the gravity of this moment AND the fact that those friends (and former clients) who are ONLY involved in the Cash UST markets, well, be careful out there tonight through tomorrow.
I recall feeling like a caged animal with clients and portfolios at risk while futures moved in reflex TO developments in / around this time of year in years past.
Cash closed, futures (and equities) OPEN leads to an environment where those ‘allstar’ and armchair chartists and techAmentalists are at risk of (over/under/MIS)interpreting moves that likely on BASIS TRADERS can understand (ie trying to extrapolate where the Cash 2, 5, 10 or 30yr Treasury will / ‘should’ be based on an etf, well, seems a bit of a stretch to ME. Said another way,
Enjoy what is left of your (holiday LONG)weekend and I hope you / yours are all safe AND tensions in the middle east take a step down…


PEACE, the ever elusive concept