Good morning … all is quiet on the EASTERN front and while many continue to deliver their kids TO college and / or enjoy remaining days of summertime, Yellen & Co are going to be calling on those who are staffing Treasury trading desks for some assistance in underwriting this afternoon’s 20yr Treasury liquidity event.
While all is quiet HERE on that there WESTERN front,
Goldilocks - Europe: August Flash PMIs—Services-Led Deterioration Across the Euro area and the UK (#gotBONDS? perhaps reason for BID in USTs this morning?)
BOTTOM LINE: The Euro area composite flash PMI decreased by 1.6pt to 47.0, below consensus expectations, on the back of a further meaningful decline in services activity. Across countries, the decline in the area-wide index was led by Germany and, to a lesser extent, the periphery, while the composite index in France remained unchanged. In the UK, the composite flash PMI decreased by 2.9pt to 47.9, also below consensus expectations. We see three main takeaways from today's data. First, Euro area growth momentum appears to be weakening by more than anticipated, due to a sharper deterioration in services activity. Country press releases attributed today's weak print to a range of factors, including inventory de-stocking, weak foreign demand, and a squeeze on both household and corporate budgets. Second, despite the weakening in activity, underlying price pressures are turning out to be more persistent. This is particularly true in Germany where the services price components ticked up for the second consecutive month. Third, growth momentum in the UK also appears to be slowing on the back of a weakening in demand, which is being accompanied by a moderation in inflationary pressures.
More below — from CSFB …
And so, here we are with USTs taking a small step back from the edge of the cliff and while there’s a rally going on at moment, perhaps activity over past couple / few weeks will be viewed as a concession and an entry point for some willing buyers of 20yr sector … Here’s an updated look at 20s
While I’m well aware that 1 day in a row does NOT make a pattern, I AM intrigued by momentum — slow stochastics — rolling over (bottom panel, green arrow) and MY visuals are sans Bloomberg SO … ahead of this afternoons 20yr auction, a few words and a link (thanks TO Harkster — see below — for pointing this one out via an email dumped into the inbox @ 3a)
Saxo: US treasury actions will test bond markets ahead of Jackson Hole
Summary: Wednesday's 20-year US Treasury notes and Thursday’s 30-year TIPS auctions might be pivotal ahead of Jackson Hole on Friday. With Japanese investors returning home, the US Treasury increasing bills and bonds supply, and Quantitative Tightening (QT) still running, investors might find little reason to buy long-term US Treasuries. In August, many traders are not at their desks, leaving those in the office reluctant to add duration to their portfolios. Yet, the above-average yields offered by these issuances might be enticing for whom is speculating the Federal Reserve might be done fighting against inflation.
… Indirect bidders below 67% might indicate a lack of foreign investors' demand, hinting at Japanese investors' repatriation spurring additional bearish sentiment in US Treasuries. On the other hand, indirect demand above 75% might signal a return of duration appetite among investors despite the increase in auction sizes and QT running in the background.
… here is a snapshot OF USTs as of 705a:
… HEREis what this shop says be behind the price action overnight…
… WHILE YOU SLEPT Treasuries are higher with the belly outperforming as UK and EGB yields tumbled after disappointing PMI readings overseas (see bullets above). DXY is higher (+0.37%) while front WTI futures are lower (-1.5%). Asian stocks were mixed (SHCOMP -1.34% though), Eu and UK share markets are mixed while ES futures are showing here at 7:15am. Our overnight US rates flows saw a bull-flattening push during Asian hours even before the weak EU/UK PMI data- with better buying in intermediates seen amid light volumes in the region (60% of ave). In London hours we saw receiving flow in swaps after the PMI disappointments while cash activity (net better buying overall) has been muted so far. My cash volume sheet not working today but volumes appeared below overage, as a guess.
From some of the news to some of THE VIEWS you might be able to use… here’s SOME of what Global Wall St is sayin’ …
Barclays - July existing home sales: Mortgage lock continues to reduce sales (higher rates may provide SAVERS extra cash to spend and so, a stimulative effect but for housing … well, what exactly did we / they think was going to happen?)
Existing home sales declined 2.2% m/m in July, continuing the downward trend since the recent peak in February. Single- and multi-family sales both declined, alongside increases in the monthly supply of homes. Mortgage lock continued to diminish sales through July.
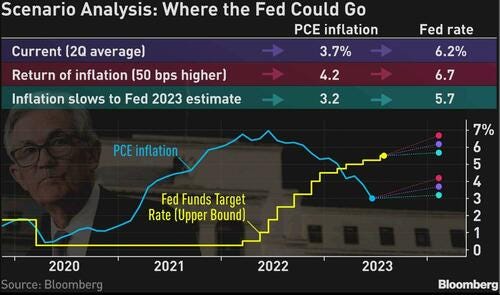
Bloomberg(via ZH): Why The Fed May Need To Go To 6% (food for thought esp for those LONG benchmark) Authored by Ven Ram, Bloomberg cross-asset strategist,
Interest-rate traders reckon that the Federal Reserve won’t have to raise rates again in this cycle. They may be wrong.
The short-term real neutral rate that underpins the US economy will reach 2.5% by the end of this year, according to researchers at the New York Fed. Given that average PCE inflation hit 3.7% in the second quarter, the Fed may be forced to tighten its policy benchmark to at least 6%.
The findings also suggest that the Fed will find it hard to cut interest rates as the market widely expects should the neutral rate remain sticky.
In that case, higher for longer may indeed turn out to be the Fed’s mantra.
The Taylor Rule rate, which is premised on a stable neutral rate, was already pointing to a higher funds rate.
The restrictive rate for the US economy is 6.55%, assuming a real neutral rate of just +50 basis points.
Neutral rate, popularly known as r*, is the rate which is consistent with an economy that is at full employment together with steady inflation.
In a recent blog post, researchers at the New York Fed led by Katie Baker contended that in the short-run r* “has increased notably over the past year, to some extent outpacing” the aggressive tightening done by the Fed in its current policy cycle.
That implies that “the drag on the economy from recent monetary policy tightening may have been limited, rationalizing why economic conditions have remained relatively buoyant so far despite the elevated level of interest rates”.
The higher neutral rate posited by the researchers is in sharp contrast to the Fed’s own assumptions as laid out in its June summary of economic projections. The central bank had assumed a real longer-run inflation forecast of 2% and a policy rate of 2.5%, consistent with a real neutral rate of 50 basis points.
There are plenty of reasons why the neutral rate may be rising. Baby boomers already in retirement and spending their nest eggs, governments running larger and larger deficits, investment in green technology and trade fragmentation may all help to tip the balance between the demand for borrowing and supply of savings.
The recent surge in real rates resonates with the findings of the New York Fed. The yield on dollar-denominated debt for 10 years reached 1.90% on Tuesday, the highest level since 2009. Nominal yields have risen in consequence, with the 10-year yield fast approaching its cyclical peak of 4.34% set in October last year.
Those are ominous signs that the real neutral rate, already running at elevated levels, may continue to rise in the coming months.
Here are some reasons why.
Bloomberg Econ DeptBNP - US Jackson Hole preview: Powell can be grounded as others stargaze
KEY MESSAGES
Fed Chair Powell will speak in Jackson Hole on 25 August (10:05 EDT), during a conference where policymakers may discuss underlying changes in the global economy and potentially their implications for policy-relevant variables including the neutral rate of interest (r-star).
We believe officials are inching toward a neutral rate estimate higher than the current 2.5% FOMC median, in line with our own view. The June dot plot showed further movement in that direction, even as Powell has said it’s “hard to know” where rates settle and New York Fed President Williams – creator of a widely recognized neutral rate model – sees conditions little changed versus before the pandemic.
After 525bp of rate hikes and inflation moving in a favorable direction, officials could ultimately split the difference – nod to the potential that neutral rates may be higher, but address it by maintaining restrictive rates for longer.
As for whether inflation targets should change, we think central bankers will generally agree that this is not the time.
… Acknowleding the uncertainty, we estimated the real neutral rate in prior analysis and see it around the upper end of a - 0.2% to 0.8% range, roughly consistent with the Holston-Laubach-Williams (HLW) estimate shown in the chart below. But accounting for an updrift in underlying inflation, the short-run nominal neutral rate may very well be higher than the current FOMC median estimate of 2.5% for the longer run, shown in the green line in the chart below at right (see Central banks: Still shooting for the r-stars, dated 28 June).
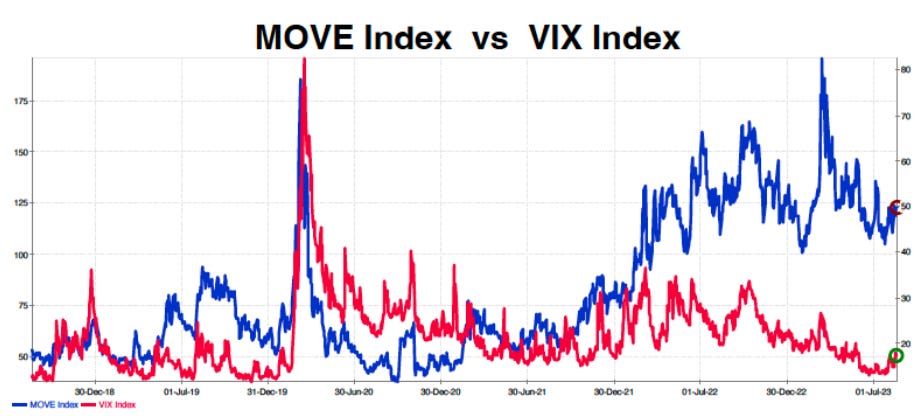
Convexity Maven - "The Big 'O'" (when this guy — THE inventor of THE MOVE index — speaks, we should pause, print and read a couple / few times …)
I am loathe to publish in August, but today's Commentary - "The Big 'O'", is way too timely to let sit on my desk until after Labor Day (when I will republish for those on vacation).
For bond investors there are three 'risk knobs' than can be turned to add extra return:
1) Duration
While it is often suggested that US Treasuries (USTs) are the safest asset on the planet, duration risk can be quite real. Notice the -alani line- price of the 30yr UST issued near 100 in September 2020 is down nearly 40%. This looks more like a hard equity bear market loss than a safe place to park funds.
2) Credit 3) Convexity
The -polu line- MOVE Index is the VIX Index for the bond market as it measures Implied Volatility for one-month options on USTs. While the MOVE has declined significantly, at nearly 125 it is still well above its long-term average and indicates an expectation of rate movements of more than 7bps a day.
Considering the uncertainty of FED policy, this is not odd, but what is strange is that the similarly structured -koko line- VIX Index is near its pre-Covid lows.
As will be detailed, with the MOVE Index at 125, selling interest rate options via the purchase of newly issued Mortgage-back Securities (MBS) is by far the most advantageous.
In a nutshell, a strategy of buying newly-issued MBS is functionally similar to a "bond covered-call" with NO credit risk. And since the effective expiry of this "call option" is about three years, the strategy is remarkably stable.
Today's Commentary has almost no math and lot's of colorful pictures, as such, it is perfect for summer beach reading.
CSFB - European Economics: August PMIs show a sharp deterioration in economic momentum, increasing the chance of an ECB-pause in September
August PMIs for the euro area surprised sharply to the downside, pointing to persistent weakness in economic momentum and reducing the risk of a further ECB-hike in September. The composite index fell from 48.6 to 47.0 (48.5 est.), which is the lowest level since May 2020. (Figure 1.) Forward-looking components such as new orders and business expectations continued to soften, suggesting that a turnaround is not in sight just yet. (Figure 2.) A persistent slowdown in demand combined with cooling hiring intentions could put downward pressure on core inflation, reducing the need for further monetary tightening. (Figure 3.) Hence, while the decision for the ECB’s September meeting remains finely balanced between a pause and another 25bp hike, today’s release increases the likelihood of the ECB pausing, or at least “skipping”, in September.
The drop in the composite PMI was led by a sharp fall in services sentiment, more than offsetting a small improvement in manufacturing activity. Manufacturing output remains firmly in contractionary territory but recorded a slight uptick (43.7, +1.0pts) on the back of easing inventory destocking and an improvement in new orders, among other factors. However, services sentiment fell sharply (48.3, -2.6pts), driven by a sharp fall in activity in Germany.
Despite the weakening economic momentum, price pressures failed to ease, elevating the importance of the inflation data released next week. More firms reported higher input (56.2, +2.0pts) and output (53.3, +0.2pts) prices in August compared to July. (Figure 5.) While the arrest in the disinflationary trend may be concerning for the ECB, the HICP flash estimate released next week will provide a more telling view of the underlying inflation dynamics. Hence, in insolation this reversal does not offset the dovish implications from the decline in the overall PMI.
While we expect mild growth this quarter, today’s release raises risks of a contraction. Our soft data model indicates that the PMIs for July and August are consistent with a contraction of c.0.2% QoQ. Firmer evidence of a slowdown in services could support such a view.
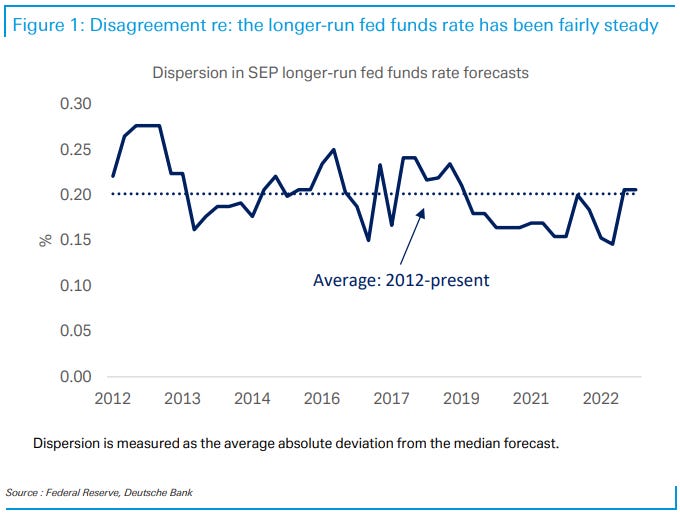
DB - Disagreement re: the longer-run dot (a response TO FRBSF letter posted / noted YESTERDAY and while this is all well and good, collegial debate / discussion, it seems to me to miss the mark — RATES UP in USTs leading to high / rising mortgages making homes less affordable and at some point i’d expect there to be an economic pound of flesh — ie the ‘pain’ JPOW discussed this time LAST year)
Yesterday, a San Francisco Fed staff note looked at disagreement in SEP fed funds rate (FFR) forecasts for the current year, one year ahead, and two years ahead.
Given growing focus on the prospects for a higher neutral policy rate (i.e., r-star), today’s CoTD extends their approach to the SEP longer-run (LR) dots. As in the staff paper, disagreement is measured as the average absolute deviation of individual forecasts from the median.
As shown in the chart, disagreement around the longer-run FFR has moved in a tight range over the past decade. In June, it was above its levels over recent years, but right at the historical average. Broadly similar results hold when disagreement is calculated in other sensible ways (e.g., relative to the mean LR dot).
Is it surprising to see so little movement, particularly when speculation around higher r-star seems to be up sharply? Perhaps, though it's easy to imagine that uncertainty among FOMC participants around r-star is high and rising but shifting views aren't yet broadly impacting the modal forecasts they write down in the SEP. That said, as detailed in a recent piece (Connecting the dots), we’re keenly watching the LR dots and expect the median to shift up, perhaps as soon as September.
DB - Could Japan sell foreign bonds (again)? (perhaps this is THE more important note from DB over past 24-48hrs…)
BoJ policy tilts have lifted JGB yields, but done nothing for yen given relative yields haven't moved in Japan's favour. But yen could rise if Japanese investors sell foreign bonds in favour of JGBs. Foreign yields are of course much higher, but given extremely high hedging costs investors must accept FX risk to benefit. So far that seems to be the preferred option - Japan has been buying foreign bonds all year, and lifers' hedge ratios have sunk to record lows. But the low level of yen could leave them vulnerable, plus history suggests foreign bond buying could tail off as relative yields stop rising (even if they hold at high levels). All up, there seems a lot of scope for Japan to sell foreign bonds, but it'd require a substantial trigger, like a US growth slowdown that produces a dovish Fed repricing.
FirstTrust- Finally, A Real Yield! (so, better BUY BUY BUY before it’s gone?)
… Takeaway: It appears that the Fed’s tighter monetary policy has led to a moderation in the pace of rising prices. Inflation, as measured by the CPI, stood at 3.2% in July, down significantly from its most recent high of 9.1% set in June 2022. Fortunately for bond investors, higher interest rates have also ushered in better yields. As today’s chart reveals, after 4 years of negative real yields, bonds are once again providing investors with a rate of return that outpaces the CPI. While inflation is not the only metric the Fed looks to for guidance as it sets its target rate, it has openly stated that one of its goals is to reduce the CPI to 2.0% or lower. We’re not there yet. Whether or not the Fed can pull off the balancing act of moderating the pace of inflation without causing a recession is yet to be determined.
FirstTrust- Data Watch - Existing Home Sales Declined 2.2% in July
Existing home sales declined 2.2% in July to a 4.070 million annual rate, lagging the consensus expected 4.150 million. Sales are down 16.6% versus a year ago. Sales in July fell in the Northeast, Midwest, and South, but rose in the West. The drop in July was due to both single-family homes and condos/co-ops. The median price of an existing home declined to $406,700 in July (not seasonally adjusted) but is up 1.9% versus a year ago.
… a weakening economy in which the Federal Reserve doesn’t act quickly to cut rates, because of high inflation, could be a headwind for home sales later this year. On top of this, new fee changes that went into effect May 1st as part of the Federal Housing Finance Agency’s push for affordable housing will effectively subsidize homebuyers and refinancers with riskier credit ratings by charging higher fees to those with good credit scores. These changes are likely to cause extreme confusion and result in pricier monthly mortgage payments for most homebuyers. Adding this altogether, expect sales and prices to drag on in the year ahead, with no persistent recovery in existing home sales until at least late 2023 or early 2024…
Goldilocks - USA: Existing Home Sales Below Expectations in July (rates UP, mortgage rates UP, exactly what did we THINK was gonna happen … still not terrible .. yet)
BOTTOM LINE: Existing home sales declined by 2.2% to a seasonally adjusted annualized rate of 4.07 million units in the July report, below consensus expectations for a smaller decline. The imbalance between housing supply and demand improved slightly but the median sales price increased 1.3% month-over-month (sa by GS). We left our Q3 GDP tracking estimate unchanged at +2.6% (qoq ar). Our Q3 domestic final sales growth forecast stands at +2.7%.
Wells Fargo - Existing Home Sales Fall in July as Higher Mortgage Rates Continue to Bite (h’line says quite a lot, as does the visual)_
The impact of the recent resurgence in mortgage rates is becoming increasingly apparent. Existing home sales declined 2.2% during July, the second straight monthly decline. Since existing home sales reflect contract closings, July's data largely reflect activity in June when mortgage rates averaged 6.8%, but rates have marched higher since.
WolfSt- Home Sales Plunge Further as Demand Vanished at these Prices. Even Cash Buyers Pull Back. Supply Keeps Rising
Finally, for those of us visual learners, something from #FinTWIT cuz, you know, I believe everything I read on Twitter,
A housing market that has more New homes for sale than Existing homes, and more Real Estate agents (over a million strong!) than total homes for sales, doesn't auger well for the next Turn in the housing market....


A housing market that has more New homes for sale than Existing homes, and more Real Estate agents (over a million strong!) than total homes for sales, doesn't auger well for the next Turn in the housing market....
Good perspective and not one you’ll see / hear from any of those 1 mil strong (couple of friends in that line of work…)