(USTs slightly bid, belly leading as US follows UK all on above avg UST volumes)while WE slept ... 5000yrs of low rates, what next? DUDs, 'Goodbye to the bond bull'; Fed model says...
Good morning … Except for bond bulls (oer perhaps stories like these will help?)
Bloomberg OpED by Bill Dudley - Goodbye to the Bull Market for US Treasury Bonds (presented without comment except to say remains true to form that once OUT of ‘the system’ they all seem to get sip from cup of truth serum?)
Who knew that the subject of US Treasury bond yields could inspire such passion? When, in late June, I argued that they were likely to move considerably higher than the then-prevailing 3.75%, I attracted some vehement pushback. In a publication titled “Don’t Be a Dud,” analysts at Morgan Stanley insisted that the 10-year bond would experience a summer price rally, and that the yield would ultimately settle into a longer-term range of 2% to 3%.
I’m sticking with my prediction. What’s more, I strongly suspect that the bond bull market that began in the early 1980s is over…
… The outlook will probably deteriorate further as higher interest rates drive up debt service costs and retiring baby boomers push up Medicare and Social Security expenditures. Larger deficits push up r*, and add to the bond term premium by increasing the risk of long-term lending to the US government…
AND while I’m sympathetic to this view — NOW more so than when he suggested as much in JUNE — as we all ‘mark to market’ our views — I will ALSO stick with view that NOW may be somewhat less opportune time to say start getting bearish.
And since I believe everything I read on the intertubes, I’ll insert a FED MODEL VISUAL from LinkedIN (via ZH) with some commentary … but again, noting full well these are unusual times and BOND YIELDS > dividend yield of S&P500 and clearly something Fed aware of …
The last time the gap between the yield of the 10 Year Treasury and the dividend yield of the S&P500 was so high was in 2007! On this measure often used by the Fed and called the Fed model, equities have not been as expensive compared to bonds in more than 15 years. Also there appears to be decent value in US bonds. Question remains what duration to choose. While the yield curve starts indeed to flatten, the short end of the curve remains higher than the longer maturities with the 6 months T-bill at 5.38% and the 2 years Treasury at 5%. At ECP, we have launched this August 2 new UCITS Funds in August investing respectively in USD and EUR short term bonds. On the equity side, we focus on individual companies of good quality with less demanding valuations.
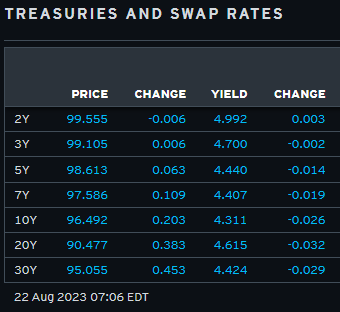
AND … here is a snapshot OF USTs as of 706a:
… HEREis what this shop says be behind the price action overnight…
… WHILE YOU SLEPT Treasuries are modestly higher (belly outperforming), perhaps dragged along by the out-performing UK Gilt market (UK 5's -7.5bp). DXY is little changed (-0.06%) while front WTI futures are too (-0.2%). Asian stocks were higher overnight, EU and UK share markets are all in the green again (SX5E +1.43%) while ES futures are showing +0.38% here at 6:55am. Our overnight US rates flows saw real$ buying in the front-end and intermediates on decent volumes for a change (110% of ave) there. During London's AM hours saw a better overall bid to Treasuries but amid 'exceptionally light' flows. Overnight Treasury volume was ~110% of average overall with 20yrs (215% of ave) seeing some elevated turnover ahead of tomorrow's auction of the same.
From some of the news to some of THE VIEWS you might be able to use… here’s SOME of what Global Wall St is sayin’ …
Advisor Asset Management (AAM) - The U.S. Treasury Yield Curve Has Begun to Steepen. Good News? Likely Not. (‘nuff said? and BAML chart caught my attn)
The U.S. Treasury yield curve has begun to steepen, and I don’t think that’s good news. But before I get into the nitty-gritty of why, there are a few things that you need to remember. 1) a yield curve is formed by charting Treasury yields from short to long maturity. Yield curves are normally tilted slightly positive since shorter-dated yields are typically lower than longer-term yields (which makes sense since one would generally expect to be paid more interest the longer one has committed to lending money to the borrower). 2) The chart below from Bank of America illustrates interest rates purporting to go back 5,000 years. One can clearly see the anomaly period of low rates we have been in over the past 15 or so years.
And 3) the Federal Reserve (Fed) has raised interest rates from zero — the lowest ever — to roughly 5.5%, prompted by a spate of high inflation that gripped the U.S. economy after the pandemic…
… Chris Verrone, technical analyst at Strategas, notes that it is likely that the long maturity part of the U.S. Treasury yield curve is on the cusp of breaking out to higher yields. See chart below. He notes that if yields break about 4.34% on the 10-year Treasury and 4.42% on the 30-year Treasury we will be likely to see much higher yields in our future. Higher yields are not conducive to economic growth or margin expansion. As the cost of money continues to rise, profits generally suffer, and consumers suffer, which is what we are seeing at this point. This condition is rare, but we are seeing it globally in developed economies.
The bottom line here is that if rates on the long end continue to rise, it will un-invert the yield curve…but not in a good way…
… Our conclusion is that we are likely in a longer business cycle than normal because of the record-setting stimulus distributed in the economy during and after the pandemic. The economy and jobs have been good but not at normal economic cycle strength. We believe that higher interest rates for longer will be needed to fight inflation, which typically shows up in waves. We are between waves now, but that doesn’t mean we can celebrate victory. Higher interest rates will eventually slow the consumer, industry and the economy.We continue to believe that a recession or significant slowing is in the future for the U.S. economy.
The “bear steepener” is just one more indication of that event forthcoming.
Bloomberg - Yield-Curve Bear Steepenings Aren't That Uncommon (good to know) Authored by Simon White, Bloomberg macro strategist,
Bear steepenings of the yield curve, as we have had lately, are not uncommon, and cannot be taken alone as a sign of rising inflation expectations.
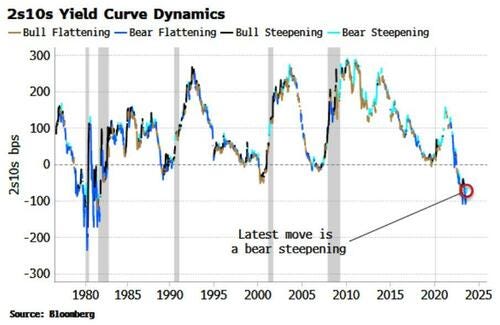
The yield curve has steepened over the last month, prompting some commentary that this is driven by inflation fears, and also that such moves are unusual. Yet in fact, bear steepenings occur fairly frequently.
We can see from the chart above that, especially since the GFC, bear steepenings in 2s10s have tended to be counter-trend rallies in the curve.
When the curve’s prevailing trend switched to steepenings, it is often driven by bull steepenings, i.e. the Fed is typically cutting rates aggressively in the run-up to a recession.
The chart also shows that bear steepenings have occurred at many different junctures over the last 50 years that have not been associated with escalating worries on inflation.
Therefore a bear steepening alone is not an indication of rising inflation premium.
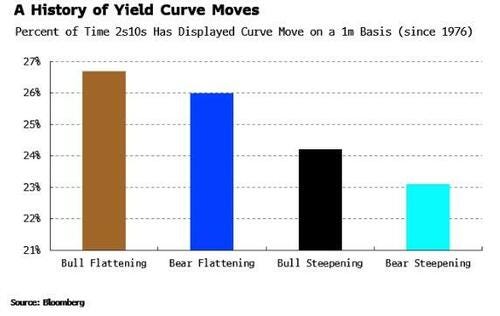
Bear steepenings are the least common of the regular curve moves. Still, excluding “twists” (i.e. when the 2y and the 10y move in opposite directions), they have occurred over 23% of the time since 1976 for the 2s10s yield curve.
There are reasons to believe that the market has been extracting some extra compensation for heightened inflation expectations, such as a rise in term premium and breakevens, but in truth neither perfectly captures the effect. The same also goes for bear steepenings.
Bloomberg … BNP - US: Dallas Fed mini-SLOOS shows policy lags still percolating (make of this whatever you will — an attempt to find relevance in an irrelevant period of time where it seems to me — ignoring the elephant in the room — PRICE action in rates — risks missing the point)
KEY MESSAGES
The Dallas Fed's August Banking Conditions Survey shows a continued move to tighten credit – albeit slightly less broadly than in recent reports – and an expectation that unfavorable trends continue.
We view the directional move as less important than the level, the latter consistent with past recessionary dynamics.
Coupled with pessimism in respondents' comments, the data suggests the Fed’s quarterly Senior Loan Officer Opinion Survey (SLOOS) will echo these trends when it is released on 6 November.
For the FOMC, we believe the Dallas Fed survey is consistent with the view that policy lags have yet to fully play out, warranting a cautious approach to any further hikes.
CSFB - China: We might be soon out of consensus again, but this time on the other side of it (reads thru like a ‘WE TOLD YOU SO’ or ‘its different this time’ …)
By now, consensus forecast for China’s GDP growth for the year has been drastically slashed. Forecasters who appeared to be competing for the most optimistic outlook as recently as four months ago, with their around 6% annual growth outlooks while looking for every reason to revise further up, are now seemingly engaged in the opposite exercise of trying to see who can be the most pessimistic, with some of the same forecasters now slashing growth to below 5%.
In contrast, our forecast for the year has remained unexcitingly (and perhaps even boringly) stable by comparison. We started the year at 5.1%, adjusted mechanically to 5.2% a few months back, and are now back again at 5.1%. We see little reason to become more pessimistic for this year than we have before and would like to caution our audience against reading too much into the drastic changes to consensus forecast. The very fact that it swings around so quickly in such a meaningful magnitude is itself evidence that much of it might very well be noise.
To be fair, there are legitimate (but rare) reasons to alter annual economic forecasts drastically, especially for a large economy like China. By drastic, we mean a revision to annual growth outlook of 0.5ppt or more. For instance, we didn't anticipate the pandemic when we formed our 2020 outlook during 4Q 2019. We also didn't anticipate the shutdown of Shanghai ahead of 2Q 2022. In both these years we had to make drastic intra-year revisions. But this year is not comparable to 2020 nor 2022 in this sense.
While fully acknowledging the various challenges China is facing, we interpret China's policy responses so far to mean that the country is finally taking the trade-off between near term growth and medium-to-long term growth sustainability more seriously. Granted, this might simply be an involuntary choice given that China lacks effective policy tools to stimulate household demand (link) (Figure 1), but at the very least the authorities are recognizing their policy limitations rather than wasting their policy ammunition. As a result, intended or not by policy makers, China's households are finally deleveraging (link).
FirstTrust- Monday Morning Outlook - Where is the Economy? (asks / attempts to answer - recession still coming and stocks COULD still drop esp when plugging in 4.30% 10yy into ‘the model’ — always hated their model never found it to be of much use)
What’s going on with the markets and the economy? Long-term Treasury yields are up substantially since last Fall while the stock market, after a big rally, has stumbled so far this month. Meanwhile, the real economy appears to continue to chug along – even accelerating! – while inflation has dropped a great deal versus a year ago but will likely go up again soon due to rising oil prices. What do we make of all this and has this changed our fundamental outlook?
… The bottom line is that faster growth and persistent inflation are a recipe for the Fed to either move higher than the market now expects or stay at a higher level longer than the market expects, or possibly both.
In turn, we remain convinced that our call from the end of last year that the S&P 500 would finish this year at 3,900 remains a solid forecast. When we plug a 10-year Treasury note yield of 4.30% into our capitalized profits model, it spits out a “fair value” estimate for the S&P 500 of 3,126. We are not predicting a drop that low in stocks, but this method makes us comfortable keeping a target of 3,900.
In addition, we are not waving the white flag on our forecast of a recession and think the conventional wisdom has lurched too far and way too fast against the odds of a recession. Many investors think that with an unemployment rate of 3.5%, the economy is somehow invulnerable to a recession. But we think this theory is wrong; recessions almost always start when the jobless rate is at or near a low…
… A monetary policy that is tight enough to eventually wrestle inflation down to 2.0% doesn’t make for a pleasant economic ride in the next year. The road is smooth today, but potholes are ahead.
Price momentum is a key driver of sentiment, especially in a late cycle environment when uncertainty about the outcome is high. With recent price action taking a decided turn lower, we think sentiment will follow. We like defensive quality, high FCF and operational efficiency factors.
… Tactical price support for the S&P 500 and many leading stocks remains below current prices and in some cases well below. We like the 200-day moving average as minimum downside for this current tactical correction and view most of the price action since NVDA's stunning guidance on May 24th as the FOMO / high risk part of this year's rally. While NVDA's stock move is justifiable given its very uniquely bullish situation as our analyst Joe Moore lays out, we think extrapolating this dynamic to the entire stock market is very risky, particularly given the uncertainty of the late cycle environment we believe we are still in. Furthermore, we view the recent breakdown in breadth and inability of small caps to break above the early February highs, as negative technical signs. We have also been surprised at the complacency/comfort around this recent correction given how far we have come this year on valuation in the face of rising back-end rates. With risk events this week including Jackson Hole and likely thinner than normal volumes, we expect volatility to remain on the upswing. Our advice remains the same—stay more defensively oriented with a premium on earnings quality, FCF, and operational efficiency. This is not the same strategy as owning growth which appears to be more vulnerable than value at the moment given the aforementioned rise in rates.
MS - Charts That Caught My Eye (director of research highlights)
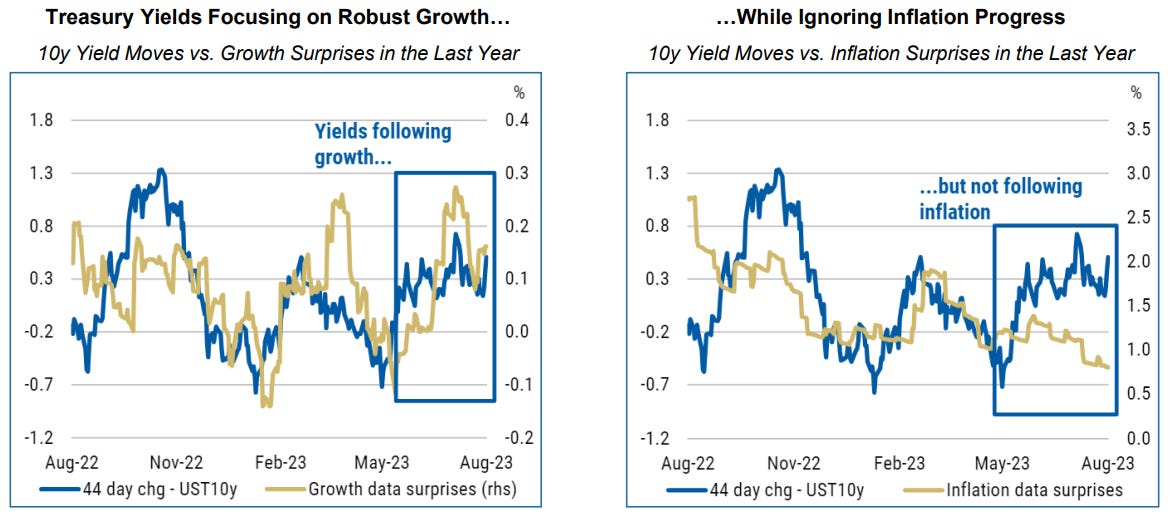
(2) US Rates Strategy: We believe the rise in Treasury yields reflects robust growth — but ignores progress on inflation.
Our Rates Strategy team observes that a common narrative in the market is that the recent bear-steepening in US Treasuries has been a repricing higher of the "neutral rate" due to a strong US growth outlook. Yet our team argues that (1) growth surprises are already near a typical peak and are likely to surprise to the downside; (2) recent growth surprises are already reflected in higher yields; and (3) by focusing on growth, markets are ignoring the improving inflation picture. They suggest fading the recent bear steepening narrative, and they stay long 5-year US Treasuries. They also suggest playing for lower 30-year real yields by going long 30y TIPS.
UBS - Paul Donovan - The fruits of Fed failures (i’ve cited ‘Fed’ notes referred to, below)
Real yields helped push US 10-year yields higher yesterday. Caution is needed when interpreting market moves in the dull days of summer, but there are concerns that the Federal Reserve may keep rates higher for longer. Fed policy fears are difficult to control, because Fed Chair Powell’s 2022 policy errors trashed forward guidance. Work from the San Francisco Fed suggests policymakers are more divided than normal.
US economic data has tended to be better than expected, partly because of problems with consensus expectations. Aggregate data is given too much importance—middle income consumers have more savings and lower inflation than aggregate numbers might suggest. There is still an economic landing in progress, and the Fed is now tightening policy aggressively by letting real (inflation-adjusted) interest rates rise as inflation falls rapidly.
WisdomTree - Prof. Siegel: Productivity Rebound Hopefully a Multi-Year Trend (with only a few words on RATES, I’ll skip to them and his — BEARISH — conclusion)
… The rising bond yields are impacting longer duration assets such as tech, which they should. Shorter duration value stocks—whose cash flows in short run support valuations—should perform better as interest rates rise. Better economic growth and the lower risk of recession is also supporting the profit outlook for these value stocks. I increasingly expect rates to stay high for quite a while, while I expect that the market at 20 PE is just about right.
Will positive momentum come back to the market after this recent pullback? When we have a surge in equities and then a rate rise, we often can see the market settle back five to 10% and then we get another surge to breakout to new highs. It is hard to say when that'll come, but certainly I don't see anything threatening the market that would erase more than another 5% or so from today’s level. Nvidia’s earnings report this week is the next key test for technology stocks. Expectations are so high, if there’s any degradation in the outlook for sales, this could cascade into further pressure for the AI darling and technology stocks.
Yardeni QuickTake - Bond Yield Returning To Normal (returning ≠ there)
The 10-year US Treasury bond yield continued to rise today, yet stock prices rallied led by the MegaCap-8 stocks. The bond yield is returning to the levels seen prior to the period spanning the Great Financial Crisis (GFC) through the Great Virus Crisis (GVC) when the Fed kept interest rates abnormally low. And the stock market might be OK with bond yields returning to their old normal. Nevertheless, there might be more downside risk on fears that the yield could move still higher.
The yield curve continues to "disinvert" as the 10-year yield (currently at 4.34%) is rising toward the 2-year yield (currently at 4.97%) (chart). The former has been moving higher since it bottomed on April 6, following the March banking crisis, as investors concluded that the crisis wasn't turning into a credit crunch and that the economy is remarkably resilient and not in danger of falling into a recession after all.
The recent rebound in the nominal yield has been driven by the rebound in the 10-year TIPS yield from a low of 1.06% on April 6 to 2.00% today (chart). The latter seems to be normalizing back around 2.00%, which is where it was during 2003-06, the years just before the GFC of 2008 set the stage for the TIPS yield to fluctuate around 1.00% to -1.00% from 2010-22.
AND for those of us who are visual learners and arm-chair technical analysts,
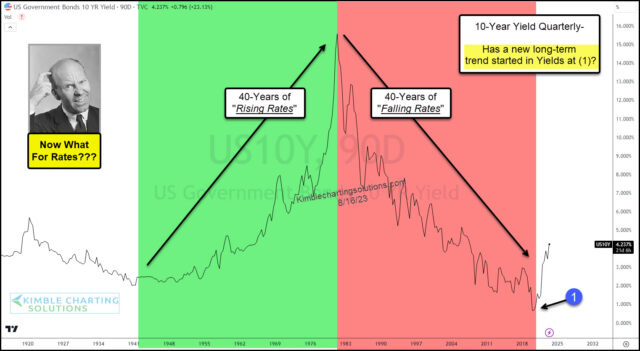
Kimble — Have U.S. Bond Yields Began A New Long-Term Trend Higher? (dumbing down “R*”
Rising interest rates are beginning to spook investors. And rightfully so.
It’s been the fastest rise in rates in decades. And just when we thought interest rates were easing, they pushed higher once more!
40 years up and then 40 years down… now what for bond yields?
And when we look at today’s long-term “quarterly” chart, it appears yields are attempting a breakout amidst a broader trend change.
So while interest rates could pull back at any point over the coming weeks/months, we may need to adjust in a new market trend of higher rates. And this has investors and consumers feeling a bit uneasy.
Large speculators/hedge funds haven't pulled back on their net short positions in 2y Treasury bonds ... still hovering near multidecade low
7:25 AM · Aug 21, 2023
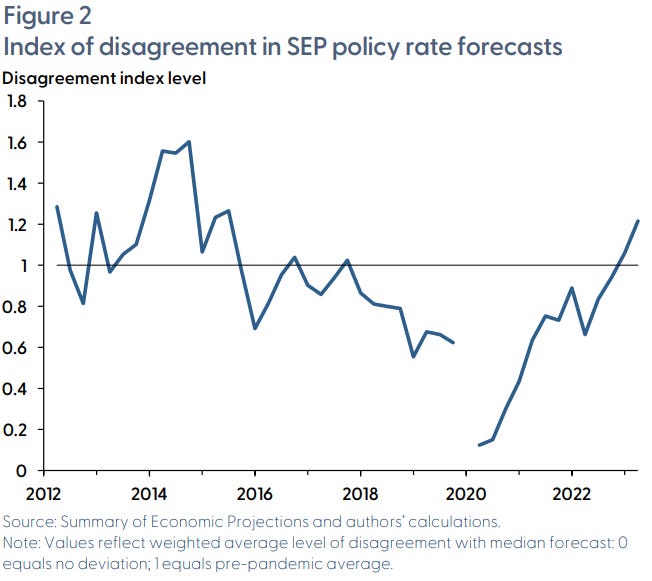
Finally, in closing, ahead of this weeks ending Jackson Hole symposium and any / all continued discussions of R*, a departure of sorts where an official account discusses the DOTS <GO> and disagreements therein,
The Summary of Economic Projections offers important insights into the views of Federal Open Market Committee participants. The summary’s “dot plot” charts each participant’s assessment of the appropriate path for monetary policy given their economic outlook. A new index measuring the level of disagreement indicated by the dots shows that disagreement fell during the 2010s expansion, was nearly nonexistent early in the pandemic, and has been increasing recently. Policy disagreement is correlated with disagreement about future inflation, but factors unrelated to disagreement about the outlook also play a large role.
… Figure 2 presents a new index of disagreement we developed, which summarizes the deviations across the three horizons into a single number at any given point in time. We use a statistical procedure called principal component analysis to create a weighted average of the forecast deviations in Figure 1. Intuitively, the index captures a type of underlying disagreement in SEP forecasts. When this index of underlying disagreement is low, the deviations in forecasts will be low across all horizons; as underlying disagreement increases, the deviations at the current year horizon will tend to increase a little, and disagreement about policy will increase at the longer horizons a bit more. The index is constructed so that a value of zero indicates no disagreement—all participants have identical policy forecasts at all three horizons—and a value of one indicates the pre-pandemic average level of disagreement.