(USTs higher, belly leading on above avg volume) while WE slept; "Here Is What Stops, And What Doesn't, When The Government Shuts Down This Weekend" (ZH, BBG)
Good morning … With lots of moving parts overnight including a BoJ bond buying (bonanza? no, not really at what I’ve heard to be an operation of just ‘bout 2bb USD?) I’ll note markets appear to be breathing a bit of a sigh of relief ahead of week / month and QUARTER END …
Bloomberg: BOJ Acts to Slow Rising Bond Yields With Unscheduled Buying
Backing up just a moment and in order to review what we’ve learned YESTERDAY and since the data preceded 7yr supply, some of the painful details,
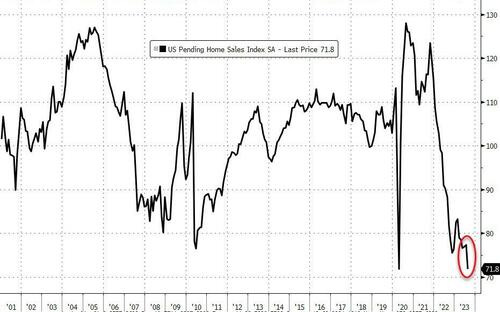
CalculatedRISK: Q2 GDP Growth at 2.1% Annual Rate ZH: Initial Jobless Claims Drops To 12-Month Lows CalculatedRISK: NAR: Pending Home Sales Decrease 7.1% in August; Down 18.7% Year-over-year ZH: Pending Home Sales Puked In August To The Lowest On Record
… That is the biggest MoM decline since Sept 2022 and drops the overall index to exactly equal to its COVID-lockdown lows (the worst on record)
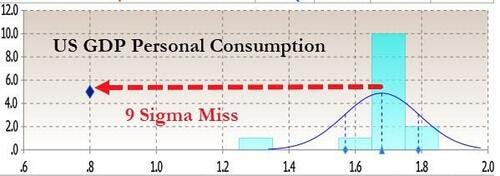
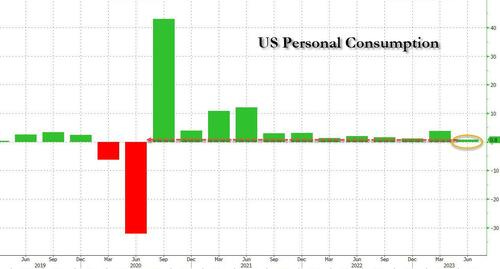
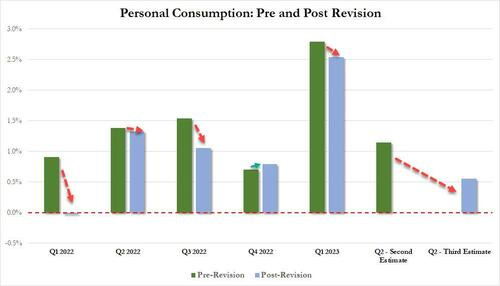
ZH: "9-Sigma Miss": Personal Consumption "Unexpectedly" Collapses In Latest GDP Revision
… As shown in the chart below, Personal Consumption was expected to print unchanged from the 1st revision to Q2 GDP at 1.7%. Instead, it came in less than half at 0.8%, a 9-sigma miss to expectations!
Furthermore, at a sharply downward revised print, the Q2 GDP consumption was not only the first sub-1% print since September 2020, it was the lowest consumption going back to the covid quarter, Q2 2020.
Confirming this, the BEA coyly put it as follows:
The update from the “second” estimate primarily reflected a downward revision to consumer spending that was partly offset by upward revisions to business investment, exports, and inventory investment. Imports were revised down.
… While it is largely irrelevant since all the historical data was also revised, compared to the first quarter, the deceleration in GDP in the second quarter primarily reflected a deceleration in consumer spending, a downturn in exports, and a deceleration in federal government spending. These movements were partly offset by an upturn in inventory investment, an acceleration in business investment, and a smaller decrease in housing investment. Imports turned down.
Quantifying the changes in Q2, we get the following picture:
Personal Consumption contribution to the change in GDP was just 0.55%, down more than half from 1.14% in the last revision, and down massively from 2.54% in Q1
Fixed investment was where the BEA plugged the consumption hole, and despite continued cuts in CapEx, fixed investment magically boosted Q2 GDP by 0.9%, up from 0.66% in the previous revision,
The change in Private Inventories was exactly 0.00%, almost as if it was fat fingered, although considering it was -0.09% in the previous revision, it's somewhat credible.
Net Exports were also used by the BEA to incredulously boost GDP because somehow, despite the soaring dollar, net exports contributed 0.04% to the bottom line GDP number (exports -1.09% vs imports 1.13%), up from a -0.22% detraction previously. How this is possible, again, with the dollar surging is anyone's guess.
Finally, government consumption was largely unchanged from the previous estimate, and at 0.57% it contributed just over a quarter to the bottom line GDP print of 2.06%.
Comprehensive Update of the National Economic Accounts
Today’s release presents results from the comprehensive update of the National Economic Accounts (NEAs), which include the National Income and Product Accounts (NIPAs) and the Industry Economic Accounts (IEAs). The update includes revised statistics for GDP, GDP by industry, GDI, and their major components. Current-dollar measures of GDP and related components are revised from the first quarter of 2013 through the first quarter of 2023. GDI and selected income components are revised from the first quarter of 1979 through the first quarter of 2023.
We will now take a closer look at the various GDP revisions and share the data in a subsequent post.
This all as a preface FOR a less than optimal 7yr auction at 1pm
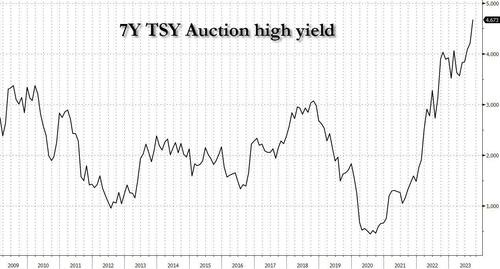
ZH: Tailing, Subpar 7Y Auction Prices At Highest Yield On Record
… After two solid bond sales earlier this week, moments ago the Treasury offloaded another $37BN in 7Y paper, in what was at best a mediocre affair.
Pricing at a high yield of 4.673%, this was the highest stop on record...
... up a whopping 46bps from the 4.212 in August, and also tailed the When Issued 4.670% by 0.3bps…
… AND with that, 20s latest victim having a peek at 5%, albeit briefly before retreat,
I’ve also attempted to highlight momentum — stochastics — oversold (time at a price) and possibly turning down, potentially taking yields with … to be determined. More to follow as data dust settles and the facts / figures in for the day / week / MONTH and QUARTER … but for now, here is a snapshot OF USTs as of 726a:
… HERE is what this shop says be behind the price action overnight…
… WHILE YOU SLEPT Treasuries are higher with the belly leading up after Treasuries and Oil rejected key technical levels yesterday while buyers in Treasuries have apparently begun to overwhelm the sellers at these yields (much more below). DXY is lower (-0.5%, see attachment) while front WTI futures are higher (+0.9%, see attachment). Asian stocks saw hefty gains in China-linked markets, EU and UK share markets are all higher (SX5E +1.1%) while ES futures are showing +0.53% here at 6:55am. Our overnight US rates flows saw a modest rebound in Asian hours that was met with real$ selling in the long-end. Overnight Treasury volume was ~110% of average with 3yrs (199%) seeing some relatively elevated turnover overnight.
… Well, yesterday Treasury 20yr yields had a seconds-long peek at 5%, but ended the day smartly rejecting that while tracing out a Shooting Star bear trend candle too. And daily momentum also confirmed a new momentum Buy signal at the close. Step 1: check.
THEIR visual far better than mine but I DO love when ‘great minds’ think (and feature same sorta charts) alike?
… and for some MORE of the news you can use » The Morning Hark - 29 Sept 2023 and IGMs Press Picks (who CONTINUES to be sportin’ that new, fresh look) in effort to to help weed thru the noise (some of which can be found over here at Finviz).
From some of the news to some of THE VIEWS you might be able to use… here’s SOME of what Global Wall St is sayin’ …
BAML - 10yT at 5% - What Would it Take? (another good question in addition TO what Apollo asked / didn’t answer YEST … and here the answers all lead back to belief system of LOWER RATES BUT hedge against higher with … 6m10y payer ladders — once again fully beyond MY humble understandings and comprehension … look, either yer bearish or not there’s NO such thing as having cake and eating it too — don’t fall for the ‘duration neutral ZERO RISK hedge’ … risk managers ultimately NEVER do, either and someone somewhere always gets a tap on the shoulder ….)
Potential catalysts for a move to 5% in 10yT
Improved macro fundamentals… Repricing of the neutral… Repricing of term premium… What is stopping the market? The above factors are not uncorrelated, and in fact to some extent feed on each other. Better fundamentals are likely to increase the level of conviction in the market, and these are likely to push the view for the neutral higher. A more challenging backdrop for demand in a context of improved fundamentals and a sticky view for supply at relatively high levels drives a repricing of term premium higher.
We see major forces pushing back against these drivers: (1) Negative feedback loop between bond yields are risky assets (ERP > 1sigma tight, and a higher duration of equity indices, increases this risk); and (2) and baseline soft landing scenarios which continue to reflect the unfolding of policy lags near term. These have scope to push 10yT back to c.4% levels and remain closer to our baseline. However, we continue to recommend hedging scenarios where yields push higher. We favor costless 6m10y payer ladders.
BAML - Flows follow yields (this note much more common sense…)
The big jump in interest rates leads to concerns about outflows from HG bond funds and ETFs. Flows tend to follow returns with about a month lag, and on Friday September 22nd HG funds and ETFs reported a large $1.3bn outflow (Figure 4). However, this year the relationship between flows and returns has broken down, potentially due to much more attractive yields. That means the 44bps jump in 10-year Treasury yields so far in September may not trigger the typical outflows in October…
BNP - US: GDP revisions show slower, lower (slightly steadier) consumer
KEY MESSAGES
Comprehensive revisions to the GDP accounts reveal a US economy with slightly less momentum in 2023 and less thrust from consumers relative to previous perceptions.
Adjustments to GDP were relatively mild, with the wide gap between GDP and gross domestic income (GDI) partially resolved via an upward revision to the latter.
Consumer spending was less vigorous over five of the last six quarters, but revisions to income and savings show a slightly larger stockpile of extra savings. Upper income-earning households hold most of the excess, according to the latest distributional accounts from the Fed.
Inflation revisions show a slightly firmer trajectory for core PCE inflation in y/y terms, but the 2023 run rate is little changed.
The revised figures imply incremental upside risk to Q4 GDP but do not materially change our base case ─ that a number of economic headwinds will weigh on growth. These include: a softer labor market, dwindling excess savings, resumption of student loan payments, lagged effects from higher interest rates, rising energy prices and a potential government shutdown.
… GDI revised up, statistical gap persists. GDP and GDI, two different ways of measuring the same concept of aggregate output, have diverged significantly over the past few quarters. The difference is also termed the statistical discrepancy in the national accounts, as the two should be similar, yet emanate from different source data.
The revisions pushed GDI higher in 2023 on account of higher wage and salary income in Q1 (which took real GDI to +0.5% annualized in Q1, from -1.8% prior). However, the two measures remain far apart in terms of levels (chart below at top left). GDI can have leading qualities for GDP, particularly around economic turning points, with the chart below at bottom right showing the discrepancy tends to rise ahead of recessions.
The average of the two measures, the preferred metric for the National Bureau of Economic Research committee that dates business cycles, suggests the economy has been growing closer to trend in the last two quarters than previously estimated. That said, our view is headwinds including the lagged effects of past monetary policy tightening will result in negative GDP growth in H1 2024.
CitiFX - Chart of the Day: 30yr yields near massive resistance (h’line says it all…)
US 30yr Yields: It has fast approached MASSIVE resistance between 4.79% (2008, 2009, 2011 high) -- 4.86% (2010 high).
This should be a difficult level to get above.
Massive resistance
FirstTRUST - Real GDP Growth in Q2 Was Unrevised at a 2.1% Annual Rate
… Implications: The final reading for real GDP growth in the second quarter ended up matching last month’s reading, but the “mix” of growth changed. A large downward revision to consumer spending, mainly in services, offset upward revisions to commercial construction, net exports, inventories, and home building. Today we also received comprehensive revisions to GDP and related data going back many years in some cases. Current-dollar measures of nominal GDP and related components were revised from the first quarter of 2013 through the first quarter of 2023. Gross Domestic Income (GDI) and selected income components were revised going back to 1979. All in all, the updated estimates show that real GDP increased at an average annual rate of 2.2 percent from 2017 to 2022, only 0.1 percentage point more than the previously estimated. We also got our second look at economy-wide corporate profits for Q2, which were revised higher, now up 0.2% from Q1, but still down 2.7% from a year ago. The government includes Federal Reserve profits in these data, and the Fed is generating unprecedented losses. So, we follow profits excluding those earned (or lost) by the Fed, which are still up 6.2% from a year ago. Looking at the benchmark revisions to prior years, profits are now 13% higher than originally estimated, great news! But even with new higher profits our Capitalized Profits model still shows the market is overvalued. We would need to see the 10-year Treasury yield at around 3.5% to be fairly valued today. Moving forward, we expect declines, or small gains in corporate profits as the economy continues to re-normalize after the massive fiscal and monetary stimulus of 2020-21. In turn, this will be a headwind for equities. In addition to corporate profits, we also got a second look at the Q2 total for Real Gross Domestic Income, an alternative to GDP that is just as accurate. Real GDI was revised higher, rising at a 0.7% annual rate in Q2 but is up only 0.2% versus a year ago, consistent with underlying economic weakness. These are figures that are normally seen in and around recessions. Regarding monetary policy, the inflation outlook has improved. GDP inflation was revised lower to a 1.7% annual rate in Q2 versus a prior estimate of 2.0%. However, GDP prices are up 3.5% from a year ago, still well above the Fed’s 2.0% target…
FirstTRUST - Market Observations - Global Government Bond Yields
We update today’s table on a regular basis to show the effect monetary policy could be having on government bond yields. As many investors are aware, global central banks have been tightening monetary policy as they battle stubbornly high inflation, leading to increased yields. In the U.S., for example, the Federal Reserve increased the federal funds target rate (upper bound) eleven times, from 0.25%, where it stood on 3/15/22, to 5.50% on 7/26/23. Despite higher policy rates, headline inflation remains elevated above target rates in eight of the ten countries listed in today’s table (China and Switzerland being the only exceptions).
The yield curve between the 10-Year Treasury Note (T-note) and the 2-Year T-note remains inverted in the U.S…
Negative real yields on government bond issues remain the rule rather than the exception…
Takeaway Despite the tighter monetary policies enacted by central banks around the world, inflation remains stubbornly high. Just two of the countries in today’s table have headline inflation readings that are below their stated target rate (China and Switzerland). The impact of higher interest rates on bond yields has been notable, with most of the countries in today’s table experiencing year-over-year yield growth. That said, the real yields of these countries continue to reflect the impact of inflation. As mentioned above, real yields on the 10-year government bond issues are negative for seven of the ten countries represented in the table, with China, the U.S., and Canada being the only exceptions.
Goldilocks - Q2 GDP Growth Unrevised, but Multi-Year GDP Trend and 2022 Core Inflation Revised Higher; Jobless Claims Remain Low (laundry list says…all is well)
BOTTOM LINE: Real GDP growth was unrevised at +2.1% annualized in the second quarter and consumption growth was revised down sharply to +0.8%—both below consensus expectations. However, the details of the report were strong on net, as the annual revisions resulted in a stronger multi-year trend in GDP and a stronger multi-year and recent trend in gross domestic income.The sequential pace of core inflation was revised higher in the second half of 2022. We left our month-over-month August core PCE inflation estimate unchanged at +0.12%, now corresponding to a year-over-year rate of +3.90% (vs. 3.79% previously). The personal saving rate was revised down over 2015-2019, reflecting downward revisions to proprietor and interest income; however, more recent revisions were positive, with the Q2 saving rate revised up 0.5pp to 5.2%. Pending home sales fell 7.1% month over month in August, below consensus expectations for a more modest decline. Initial jobless claims edged up by 2k to 204k, below consensus expectations for a larger rebound. We will update our Q3 GDP tracking estimates following tomorrow’s personal income and spending report…
Golidlocks - Updating Our Rates Forecast—Higher for Longer
… We now project that the benchmark 10y UST yield will end both 2023 and 2024 at 4.3% (previously 3.9% and 3.75% at YE2023 and YE2024 respectively), with an intermediate rebound early next year to roughly current levels. We have also revised up our CAD, AUD, NZD and JPY forecasts, largely due to a drift higher in our fair value estimates. Bonds currently appear oversold, in our view, and we think the risks are skewed towards lower rates from here in the final quarter of the year. We expect yield curves to steepen, though still by modestly less than priced in forwards. We expect the widely watched 2s10s curve to remain modestly inverted through next year, marking the longest stretch of inversion without a recession over the past several decades…
LPL - October Stock Market Seasonals: Trick or Treat?
As another scary September for stock markets draws to a close with what will almost certainly be a second consecutive monthly loss for the S&P 500 Index, we take another look at what clues seasonality data may give us for stock market performance during October and the remainder of 2023. So far September has lived up to its reputation, especially in recent years, as being one of the worst months for stocks. In fact, the S&P 500 is on track for its worst monthly return since December 2022. The light at the end of the tunnel is that October has proved far from spooky for investors historically, demonstrating strong monthly seasonals for stocks.
October has been a solid month for stocks with the sixth best monthly returns over the past five years, and third and fourth best over the past 10 and 20 years respectively. Over all periods since 1950 it ranks seventh. 10 of the last 11 Octobers have finished with positive returns, with a slight 0.8% decline in 2021 the only trick among a bunch of Halloween treats for stock investors.
Looking out further the October-November two-month period is on average the strongest of all the monthly pairings over the past five and 10 years and is second strongest over 20 years and all periods back to 1950.
… Another slice of data that we have studied is how stocks do the year after a large annual loss of greater than 15%, as we experienced last year with the 19.4% annual drawdown. The good news is that in three of the four occasions since 1950 that there have been calendar year losses this large, the next year’s returns have been well above average. The one huge caveat to this is that 1973 was followed by an even worse year in 1974 before the market bounced back in 1975. Though we acknowledge the small sample size, overall this data demonstrates that the strong returns we have seen year to date, even after the recent pullback, are normal following last year’s losses.
As we have also previously mentioned, the current stage of the presidential cycle is also still supportive for stocks with returns a year out from midterm elections finishing positive every time since 1950, with an average gain of 16.8%…
UBS: US Big Data: growth-inflation mix remains benign (evidence lab SAYS…)
Growth remains resilient & inflation continues to ease… What to look for in stability - risk assets perform well, but inflation is key factor…
Historically, stable US growth momentum benefits risk assets (Figures 7-10). DM equities beat long-term averages, high yield credit delivered solid returns, while the USD showed weak performance. However, inflation data remain key. Elevated August CPI amid US economic strength reinforced the fear of higher-for-longer rates that weighed on both risk assets and bonds as Fed officials' tone tuned more hawkish. An inflation slowdown in September, with stable growth in payrolls and spending, may bring back risk appetite. However, that is a tactical opportunity, as long as inflation is easing faster than growth. Beyond September, our economists expect volatile CPI data, with monthly core prints of 26bp on average, and anticipate a growth contraction in 4Q23, following higher rates, tighter credit and fiscal drag. Therefore, our strategists are cautious on equities, bearish on credit and the USD.
Expect above-consensus growth and below-consensus inflation surprises…
Summary While the ongoing United Auto Workers strike impacts all three major automakers, the number of picketers even after the latest escalation sums to just over 18,000, not even half the number of strikers involved in the strike against General Motors in 2019. Yet angst is elevated because the combination of a well-capitalized union and an unusually tight labor market make for a potentially long standoff, adding yet another hurdle to taming inflation without a decline in economic activity.
For now, the surgical approach to the walk-offs is helping to limit the hit to production and union workers' income despite all three of the major automakers being in the crosshairs. Yet the renewed threat to motor vehicle dealer inventories could temporarily thwart the downward trend in autos inflation, which has been an influential source in lowering both headline and core inflation since early 2022. This report explores how the longer the strike goes on, the worse the potential impact on the economy
… AND from Global Wall St TO the world wide web where I found the following things of some funTERtaining value,
AllStarCharts- Rising Rates Are the Market’s Golden Thread
Stocks and bonds look vulnerable right now.
US T-bonds are sliding to fresh decade lows. The S&P 500 completed a three-month top last week. And the Nasdaq 100 is on the verge of doing the same.
Those summer highs are receding into the collective memory bank, replaced by new lows and growing unease. Sellers are out in full force.
But instead of allowing the near-term selling pressure and overall choppy conditions to throw us off balance, let’s focus on the one underlying trend tying this market together…
I presented this chart yesterday during the Chart Summit – no markups needed.
For whatever reason, I’ve never shared this chart before. Perhaps I thought it was too obvious. Everybody knows commodities outperform bonds during a rising-rate environment. Right?
Rising interest rates are the market’s “golden thread.” They’re the key theme tying the major asset classes together, pulling price and all of us along with it.
We can use this understanding to approach the markets with clarity and purpose.
What do we want to buy, and what do we want to sell or not buy?
The chart answers that question: If rates are rising, buy commodities and sell bonds.
… On top of whatever reasons Menendez has for hoarding cash, there are two key arguments. The first is that it gives you optionality; if you decide the moment has arrived to take an opportunity, you can do so quickly. And second, these days, it pays you a decent yield. Indeed, the yield on three-month Treasury bills now exceeds the earnings yield (the inverse of the price/earnings ratio) that can be received from the S&P 500, for the first time since the dot-com bubble burst at the beginning of this century. It’s also far above the S&P’s dividend yield, reflecting what it will pay you in cold hard cash, again to an extent not seen in more than 20 years:
The bond selloff this month has been one of the most extreme in years, a fact unchanged by a startling reverse in Thursday’s New York trading. It’s true that the 10-year real yield dropped more than 12 basis points in a matter of hours, which is spectacular. It’s also true that by the end of Thursday, the yield, at just under 2.2%, was slightly higher than the level at which it opened Wednesday — the bond market remains unsettled, and the upward trend remains intact for now…
… Perhaps because growth still looks so strong, stocks are still performing well enough to outstrip bonds’ performance. In theory, higher income from bonds should tempt some people to sell their stocks, but on aggregate that isn’t happening. Rather, the way to limit the damage so far during this selloff has been to hold on to stocks while shorting bonds. Such a strategy, proxied below by the ratio of the main exchange-traded funds tracking the S&P 500 and Bloomberg’s index of long-dated Treasuries, has carried on without missing a beat, even since the S&P peaked and began to shed some of its gains about two months ago:
To quote Bloomberg Surveillance colleague Lisa Abramowicz, it’s “as if the two markets weren't talking to each other at all, despite their traditional relationship.” She suggested that “stocks and bonds are on completely different pages right now, with equity traders rejecting the message being sent by their fixed-income peers.”
How long can this go on? That depends on the effect that higher bond yields have…
… The case for lower long-term yields in future (and hence for buying bonds) goes as follows. What has happened in the past is that higher yields prompt an economic slowdown, which brings down rates and bond yields (thus making money for bondholders), while creating much tougher conditions for stocks. All the rises in bond yields to threaten the steady downward trend that started in the early 1980s have culminated in a major financial accident of some kind, followed by falling yields. Here’s an illustration of the phenomenon that we first published in August:
This implies that the rising yields will soon break something, either the economy or a financial institution. At that point, it’ll be a great idea to buy bonds as their yields plummet, and sell or short stocks. The bond selloff so far has been driven by the belief that the economy is too strong, meaning that equities can still prosper. To be able to do this swiftly when there is greater clarity in the situation, perhaps execute the Menendez Strategy and put money into cash for now.
Cullen Roche once said, “The stock market is the only market where things go on sale and all the customers run out of the store….”
This behavior might seem irrational, but it’s understandable when you consider how averse people are to losing money. The fastest way to make the pain disappear is to sell, regardless of the irreparable damage you may be doing to your long-term returns.
This aversion to losses, apparently, does not carry over to the bond market. The bond market might be the only market where customers run into a store that’s on fire. I’m not sure I’ve ever seen a chart like this. Most of the time, total assets will track the current price. If something is going up, investors pile in. If something’s going down, investors rush out.
Long-term bonds are down 10% this year and are in a nasty 45% drawdown. And yet, investors keep piling in, plowing $16 billion YTD into TLT. The only ETF that’s taken in more assets this year is VOO, Vanguard’s S&P 500. The building might be on fire, but investors know that eventually, the sprinklers will turn on and the fire engines will show up.
“With every tick higher in yields (and lower in duration), the risk-reward of owning Treasuries improves. The scatter plot below shows the expected return for the Barclays Aggregate index if the yield goes up 100 bps (horizontal) or down 100 bps (vertical). We were at the lower left and are now at the upper right. At a duration of 6.2 years and a yield of 5.2%, the return upside is +11.4% and the return downside is just -0.9%. Just a few years ago, that same tradeoff was +7.1% vs -5.0%.”
When rates went from 0 to 5, there was no income to buffer the fall. Investors were swimming naked. There’s no telling how high rates will rise, but this time, investors are at least wearing a life jacket.
The amount held in money market funds is reaching new highs almost daily in 2023, the latest figure shows just over $5.9 trillion.
MMFs are expected to see a record-high inflow of $1.5 trillion this year alone, and retail MMFs are exploding (see next tweet).
The growth rate of capital being poured into retail money market funds is at its highest level in several decades.
Retail MMFs recently surpassed $1.5 trillion; a record high.
WolfST- Another Recession Indicator Refuses to See a Recession: Corporate Profits without Federal Reserve Banks Hit Record
…So I’ll just start with this, and then I’ll follow with the essential nitty-gritty:
“Corporate profits” (all businesses that file corporate tax returns, including LLCs and S corporations, see nitty-gritty #2 below) before taxes (nitty-gritty #3) and excluding the Federal Reserve (nitty-gritty #1) but with “CCAdj” (nitty-gritty #6) and with “IVA” (nitty-gritty #7)…
…rose 1.3% from the prior quarter and 6.2% year-over-year, to a seasonally adjusted annual rate of $3.33 trillion in Q2, the highest ever, driven by record profits in nonfinancial industries. according to the Bureau of Economic Analysis today.
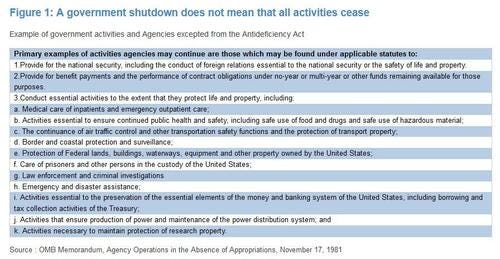
ZH: Here Is What Stops, And What Doesn't, When The Government Shuts Down This Weekend
…As JPM writes in its latest shutdown note, if no deal is reached by Oct 1 - which is now certainly the default case - then a continuing resolution is one of the more likely paths, but should a CR remain in place by Jan 1, 2024, then there will be an automatic cut to military/defense spending.
A government shutdown does not actually shutdown all aspects of the government, as many elements are exempted. In addition to the items listed below, JPM assumes that Departments of Defense, Health and Human Services, Homeland Security, State, and the Social Security Administration continue to make payments.
Some more details on the economic impact
The 5-week shutdown from 2018-19 reduced real GDP by $11bn or 0.3%; $3bn of that $11bn was likely non-recoverable once the government reopened.
In the past events, the 10Y yield has dropped both ahead of the shutdown (beginning as many as 15 days ahead) and throughout the shutdown.
What about Equities?
JPM's Mkt Intel desk finds that if you one uses the bank's sample size of shutdowns lasting more than one business day, the SPX fell 2.5% in the 10 days leading up to the shutdown with Tech and Real Estate the biggest laggards.
If the shutdown reaches the 10-day mark, the SPX will have rebounded by ~2% led by Cyclicals and Tech the only major sector producing a negative return.
Once a resolution is reached, the SPX trades up 80bps at the 10-day mark, +3.6% at the 30-day mark, and +5.9% at the 90-day mark.
10-day mark: SPX +0.8% and top 3 sectors are Industrials (+2.4%), Staples (+1.9%), and Utilities (+1.3%)
30-day mark: SPX +3.6% and the top 3 sectors are Industrials (+5.2%), Healthcare (+4.9%), and Utilities (+4.5%).
90-day mark: SPX +5.9% and the top 3 sectors are Tech (+9.8%), Industrials (+8.1%), and Materials (+7.9%).
Finally, courtesy of Bloomberg, here is a summary of what government services would stop on Oct 1, and what would go on:
Not all services would abruptly stop. Medicare payments and efforts to safeguard nuclear weapons would be unaffected. You’d likely still get mail and be able to travel on Amtrak. You wouldn’t, however, be able to get married in DC courts.
Many federal employees are likely to be furloughed, but some will be deemed “essential” and work without pay until the shutdown ends. The last major shutdown in 2018-2019 lasted 35 days.
Federal Reserve activity would be unaffected, meaning the central bank could still raise interest rates at its next meeting Nov. 1.
Financial Regulators
The Federal Trade Commission would stop “the vast bulk of its competition and consumer protection investigations.”
The Securities & Exchange Commission wouldn’t review or approve registrations from investment advisers, broker-dealers, transfer agents, rating organizations, investment companies and municipal advisors.
IRS
The Internal Revenue Service has yet to release plans for this potential shutdown. Previous plans said the agency would use funds from President Joe Biden’s Inflation Reduction Act to keep employees paid and working. A union representing IRS workers has said new plans are being discussed that would involve some furloughs.
Businesses and individuals who requested six-month extensions for their tax returns in April are still required to file by Oct. 16.
The Interior Department would retain limited discretion to issue permits for energy projects on federal lands and waters when user fees are attached.
A funding lapse would paralyze other work to develop required environmental analyses for energy projects, highways and other infrastructure.
The Environmental Protection Agency may be able to continue some IRA-funded activities as well as other exempted work, such as settlement-funded cleanup at some Superfund sites.
The White House has warned most EPA-led inspections at hazardous waste sites, as well as drinking water and chemical facilities, would stop.
The Energy Information Administration, which publishes snapshots of US oil inventories and fuel demand, would continue to collect and publish data on schedule — at least initially.
The Nuclear Regulatory Commission would stop licensing, certification and permitting and inspection activities, along with emergency preparedness exercises.
Transportation & Travel
Travelers could face delays as air traffic controllers and Transportation Security Administration officers working without pay could lead to higher rates of no-shows, as happened in 2019.
Passports and visas would still be issued at consular offices worldwide, provided “there are sufficient fees to support operations.”
Defense
Efforts “to defend the nation and conduct ongoing military operations” would continue, but most civilian Defense Department employees would be on furlough.
The National Institutes of Health might have to postpone clinical trials for diseases like cancer or Alzheimer’s, according to the White House.
Medicine-price negotiations could be sent into disarray, as some drugmakers face an Oct. 2 deadline to report data to Medicare for use in determining new prices.
Food stamps for low-income people, the disabled, and others could be delayed.
Social Security checks would be delivered, and applications for benefits processed, but people would not be able to verify benefits or replace Medicare cards.
Parks
Most national parks would likely be shuttered, turning away visitors and crippling businesses in the $800 billion outdoor recreation economy.
“Nearly all” Department of Housing and Urban Development fair housing work would stop, as would some monthly subsidy programs, including potentially for public housing operations.
Review or issuance of loans under the Small Business Administration would cease, including those for women-owned and service-disabled, veteran-owned small businesses.
Commerce Department collection of decennial census data probably would continue, as would forecasting and warnings around weather, water, and climate.
ZH: You Will Never Guess What Happened To "The Strong US Consumer" After Today's Huge GDP Revisions (important here and so am copying / pasting quite a bit BUT … conclusion reminds me of conversation noted over the past weekend HERE)
… Let's start with personal consumption, and compare the latest post-revision current data (link) with the most comprehensive pre-revision data as of last month (link). It should come as no surprise to anyone that with the (slight) exception of just Q4 2022, personal consumption in every single quarter since the start of 2022 - when the Fed aggressively started tightening and hiked rates by the most since Volcker - has been revised lower, and in some cases dramatically so.
Bloomberg also picks up on the GDP revision and looking at revisions to the historical data, writes that "the pandemic contraction is seen as being a bit less severe than previously thought: GDP is now reckoned to have dropped at a 28% annual clip in the second quarter of 2020, instead by 29.9%, as the government shut down swathes of the economy to fight the spread of the virus. But the recovery since then has been somewhat slower, according to the update. Growth last year was revised to 1.9% from 2.1%." And of all GDP components, consumption was the weakest.
So not only was the Fed hiking at a time when personal consumption would grow much less period to period than previously expected, but the US economy was generally weaker than previously expected (as discussed here).
There's more.
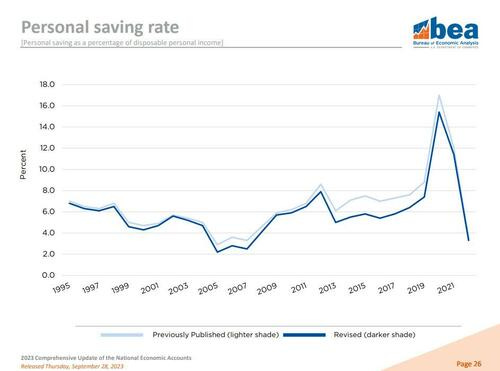
When looking at the composition of the US household's income statement - the summary of economic accounts - we find just what we had expected: US savings were in fact far lower than previously expected.
... and indeed as the BEA chart below shows, Americans stashed away an average 8.3% of their disposable income annually from 2017 through 2022, down from a previously estimated 9.4%.
The reduction stems from an accounting adjustment that lowered personal income from mutual funds and real estate investment trusts. Additionally, as Bloomberg notes, much of the reduction in personal savings seen in the revised data occurred prior to the pandemic, so its implications for how much extra cash Americans may feel they still have now is not clear cut.
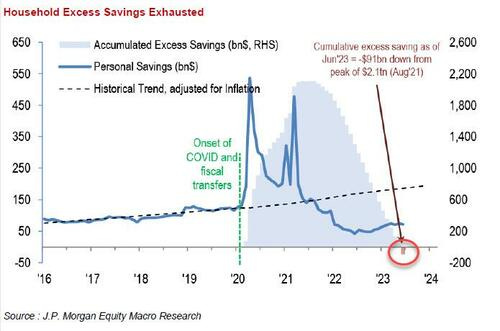
Whatever the reason for the statistical adjustment, however, one can say goodbye to even the faintest speculation that US households have any excess savings left... why they don't, of course, because even when using the previous methodology which artificially inflated total savings, JPM calculated that excess savings had already run out...
... which means that if Q3 GDP was bad and consumption was "revised" sharply lower (odd how economic data is never revised higher under Joe BIden), Q4 - when savings are virtually non-existant - and where we also get the i) return of student loan payments; ii) the UAW strike; iii) the government shutdown and iv) oil at almost $100 and gasoline at one year highs, is about to fall off a cliff.
And while this all may be exhausting to read, can you imagine how hard and labor intensive it will then be to REWRITE once all the facts CHANGE (UAW strike ENDS, government reopens, etc…)?
Final comment, cannot stress this enough, IF these things (strikes, shut downs) were to be GOOD — rebound will make econ grow back bigger / better than ever before ? — then we’d schedule these every so often.
That just isn’t the case. Never has been and you’ll never convince ME that it ever wll be…
Happy week / month / QUARTER end. Enjoy weekend ahead — doesn’t look too good for USA in Ryder Cup (but its early) …


Absolutely Amazingly Detailed work !!!!
Agree with your FI thoughts and the Y/E 2023 & 2024 Predictions...
Surprisingly, the GDP/GDI, are about what I expected...
Count on the BLS to report EVERYTHING in Biden's favor.....then later, after the Positive Headlines,
the Sobering Reality becomes Clear.
The Corporate Profits revisions could help to explain the strength in the Stock Market ???