Good morning … given this mornings lighter than LIGHT volumes (not to be dismissive OF some bullish steepening overnight which has essentially erased SOME of Friday’s limited bear flattening move), i’ll be brief.
2yy in context of some TLINES I’ve have been watching for awhile. Momentum seems to point bearishly (ahead of CPI and in wake of strong NFP — think HIKE) and that makes some amount of sense. Meanwhile … here is a snapshot OF USTs as of 715a:
… HEREis what another shop says be behind the price action overnight…
… WHILE YOU SLEPT Treasuries have bull-steepened this morning, correcting some of Friday's employment-induced sell-off despite market closures in many countries (EU, UK, Australia, Hong Kong). DXY is UNCHD while front WTI futures are little-changed too. Asian stocks saw weakness in China's exchanges and modest strength elsewhere, EU and UK exchanges are all shut for Eater Monday while ES futures are little changed here at 6:50am. We got now flow color from overseas and overnight Treasury volume looks like ~30% of average with many regions shut for holiday.
… Here's Wrightson on their assessment of the debt ceiling x-date after the March 31st Statement of the Public Debt was released: "The bottom line is that we still think the Treasury can probably scrape by until the mid-June tax date without action on the debt ceiling, which would probably push off the expected x-date until the end of July. However, the risk of a crunch in the first half of June cannot be ruled out altogether. The outlook could change again once April tax receipts start to roll in next week."
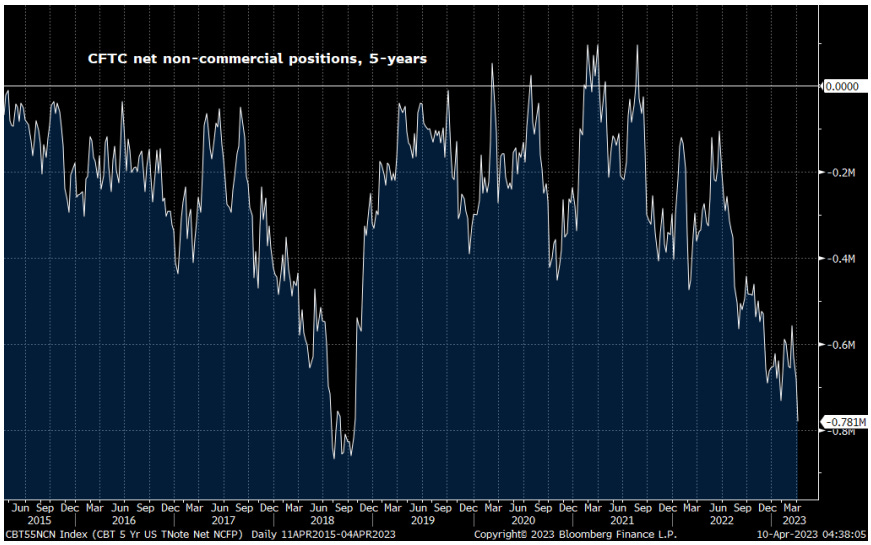
… Our next attachment looks at the CFTC's net non-commercial positioning in FV futures. There have been problems with the CFTC data of late but if this is an accurate picture of spec FV positioning, the net short nearing the 2018 extremes does fit the late hike cycle vibes that curves and 2yrs are sending right now...
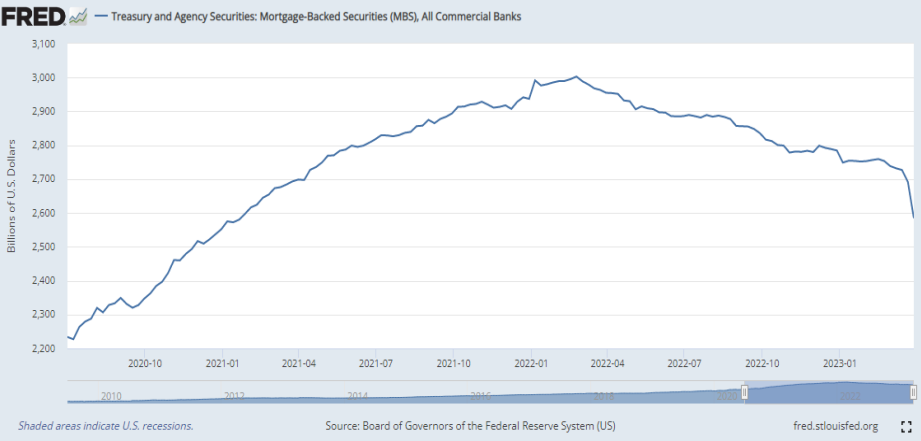
Our last attachment looks at commercial bank holdings of MBS after the latest Fed data showed that commercial bands dumped almost $110bn in MBS into the market during the final week of March- by far the most sold on a weekly basis in at least the past 12+ years according to The Daily Shot. Hmmm...
… and for some of the news you can use head over here TO Finviz where you’ll find some of the news (along with some of the noise)…
From some of the news to some VIEWS you might be able to use. I’ll begin by offering THIS LINK through to what little Global Wall St had to say over the weekend … There were a few NFP recaps and victory laps (BMO outta 10y longs at revised target) as well as a few CHARTS (CitiFX showing 30yy at pivotal supports) … AND MORE.
In as far as today goes, there are a very FEW things from the inbox to share … First up a few words from Dr. Ed BOND VIGILANTE Yardeni,
The Silicon Valley Bank imploded on Friday, March 10. To avert a widespread bank run, the Fed announced, on Sunday, March 12, that liquidity would be provided by the Bank Term Funding Program (BTFP). The Fed's press release stated that this new liquidity facility will offer loans of up to one year in length to financial intermediaries pledging US Treasuries, agency debt and mortgage-backed securities, and other qualifying assets as collateral. These assets will be valued at par. "The BTFP will be an additional source of liquidity against high-quality securities, eliminating an institution's need to quickly sell those securities in times of stress," which is what caused SVB's downfall.
In effect, the Fed Put is back, though it is aimed at backstopping the banks this time, which indirectly supports the stock market. The question is whether that will do the trick to stop a credit crunch and a stock market crash.
The jury is out, but so far so good:
(1) H.8 release. The table below shows selected assets and liabilities of all commercial banks in the US. The latest weekly data are from the Fed's H.8 release. The last column shows the changes in each item over the past three weeks from March 8 (just before the SVB debacle) through March 29. Total bank credit fell $172 .0 billion over this period led by a $219.2 billion drop in securities. Loans fell $38.5 billion. The drop in securities probably mostly reflected maturing issues that weren't rolled over. The $411.2 billion drop in deposits was offset by a $432.6 billion increase in borrowings. The weakness in loans was in commercial & industrial loans and commercial real estate loans. The good news: During the March 29 week, deposit outflows slowed somewhat and the level of borrowings declined.
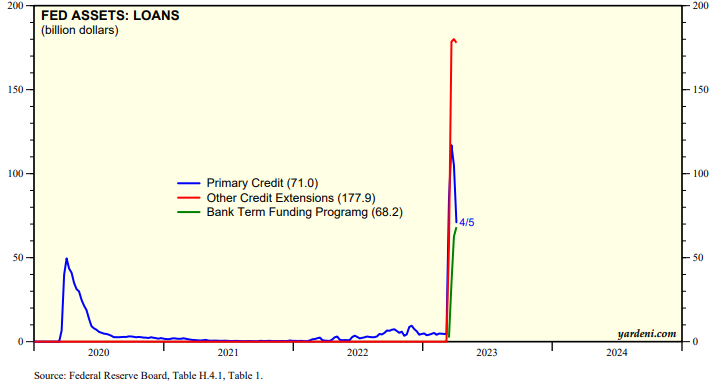
(2) H.4.1 release. According to the Fed's latest H.4.1 release, showing averages of daily figures through Wednesdays, loans by the Fed totaled $326.4 billion as of the week ended April 5, up $311.0 billion since the week ended March 1. That’s down by $31.6 billion versus the week before (chart). That’s a bit of a relief, but still disturbing to see that this category is reminiscent of the 2008 spike.
Over this same period, the H.4.1 release shows that “primary credit loans” (i.e., borrowing by banks from the discount window) rose by $66.4 billion to $71.0 billion, which was down $33.9 billion from the week before. Loans by the BTFP rose to $68.2 billion (chart).
“Other credit extensions” by the Fed jumped from zero before the SVB crisis to $177.9 billion during the April 5 week. This item consists of loans that were extended to depository institutions established by the FDIC, namely SVB and Signature Bank. The Federal Reserve Banks’ loans to these depository institutions are secured by collateral and the FDIC provides repayment guarantees.
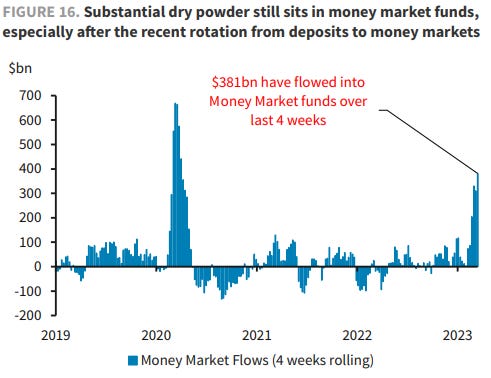
As we’re all becoming banking / credit crunch hunting experts, this next visual caught my eyes and is from Andreas Steno Larsen and shows,
… The issue is that extremely conservative decision making in banks credit departments follows emergency lending and a continued slow bleed of deposits. We have had the biggest nominal drop in the history of bank credit over a two-week period in the weeks concluding the month of March.
Even if this may be partially driven by pay-backs of emergency facilities, it cannot be construed as good news.
For somewhat MORE on banks and deposits, well THIS WEEKENDS hit had a few links and visuals which may be of some interest.
For somewhat MORE, Bloomberg overnight talks of banks deposits CAPPING yields (despite CPI)
… This Wednesday’s US inflation reading looms especially large after March payrolls came in stronger than expected at the end of last week. Anything other than a noticeably softer print — for headline and core CPI — would confirm for many that the Federal Reserve is going to hike interest rates at least one more time.
There is also another set of releases that investors will be watching, one that could ultimately outweigh the economic data. Banks will start rolling out quarterly earnings reports this week, just about a month after the collapse of Silicon Valley Bank spurred traders to speculate the Fed was done with hikes and would soon start cutting rates. Concerns linger about the health of the US banking sector as deposits drain away in the face of both stability and the usually lower interest rates on offer than from money-market funds. There’s plenty of potential for the inflation battle to get pushed to the sidelines again.
AND for our inner stock jockeys, a rather large British operation asks,
What is the Bull Case for Equities? Valuations are too optimistic relative to our base case for a shallow recession and $200 SPX EPS in 2023. However, what if markets stay willing to look through an earnings contraction of this magnitude? Do we ever revisit the lows? Ultimately, we think the bull case for equities, like valuations, is still a stretch.
We have been right on the direction of earnings but wrong on how far ahead the market has been willing to price in the eventual earnings recovery. Consensus FY23 has rationalized meaningfully over the last 12 months but revisions have stalled despite mounting headwinds for profitability: manufacturing demand is nearly down to COVID lows, services demand is slowing and credit is tightening. There is still plenty of runway to catch down to our $200 target. And yet, valuations have repriced higher, in the hope that we are close to the end of the earnings revisions cycle. We think there is still way to go before this rationalization is complete, making this recovery rally premature.
Investors may be looking through an earnings contraction in 2023 to a strong recovery next year,essentially in a bid to pay peak multiples on trough earnings. However, we are confident that NTM EPS cuts are far from done; consensus estimates look consistently too optimistic even a few months away, and a potential recession only increases the degree to which forward estimates overestimate actual earnings. Our analysis of historical instances when NTM EPS contracts by more than 5% (such as in the current cycle) indicates that equities typically bottom only when a majority of the eventual downward revisions are in, and assuming our $200 EPS target is the trough in this cycle, the majority of the EPS cuts are still ahead.
Markets may also be concerned that positioning will make it more punitive to be late than early once the trough is in (or near). Recall that equities were extraordinarily well-prepared for this bear market, with the trade-off being that the pain trade has been exaggerated to the upside. Equities have thus far leapfrogged an improbable list of pitfalls, and every cleared hurdle may serve as another reason to risk buying a head fake if it means not missing the first step. However, as we stated above, we think we still have a ways to go before seeing the trough. Valuations can remain irrational for a time but earnings cannot, and if the history of recessionary bear markets (particularly high-inflationary ones) is a guide, both sides of the P/E multiple remain exposed to asymmetric downside risks.
… Many were caught offside by the V-shaped recovery from COVID, the current business cycle has been the fastest on record, and equities have thus far shrugged off stubborn inflation, rapidly tightening monetary policy, and even a minor tail event in the banking crisis. In a bear market that is longer in tooth by the day, every cleared hurdle may serve as another reason to risk buying a head fake if it means not missing the first step (U.S. Equity Strategy: Food for Thought: Head Fake or First Step?, 10 Mar 2023). It may seem that FOMO cannot be overcome as long as markets are functioning properly and we avoid a true liquidity crisis or other panic selling event, particularly with light real exposure and dry powder acting as a positioning backstop.