Good morning / afternoon / evening (please choose which ever one which best describes when ever you are stumbling across this shorter than short note) …
First, HERE ARE a collection of narratives and few words from some of the popular kids on Global Wall Street. While MOST of the financial markets were closed on Good Friday, the NFP was released and with it, a handful of narratives have been updated to reflect a very limited bit of price action …
This is not a strong labor market. Its not even a great one. Case in point, payrolls increased about 30 percent this past quarter from the last but hours grew just over 15 percent at the same time. Many may not care to understand the significance of this yawning gap between jobs and work but the economy certainly does. The economy cares about work, not jobs.
Putting aside the JOBS report released Friday, there was also some banking information in the form OF,
ZH: Small Bank Deposits Plunged $275 Billion In March, There's Just One Thing...
Update (1700ET): Forgive our furrowed brow and generally government-data-questioning nature, BUT... One rather notable thing though which throws all of this 'transparency' into doubt...
According to the prior week's data, Small Banks saw a tiny $1.1 billion outflow (NSA), which prompted much rejoicing early on Monday when markets opened.
That tiny outflow was revised to a massive $47.5 billion outflow according to this week's data!
So just how much will this last week's data be revised next week?
* * *
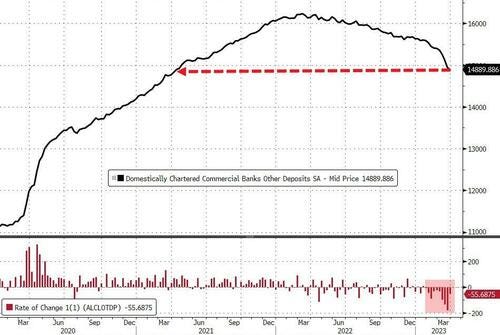
US commercial bank deposits (ex-large time deposits) fell for the 10th straight week (to the week-ending 3/29), down $55 billion to their aggregate lowest since April 2021...
Source: Bloomberg
Rather oddly, on a non-seasonally-adjusted basis, total US commercial bank deposits (ex-large time deposits) ROSE $54 billion last week...
Source: Bloomberg
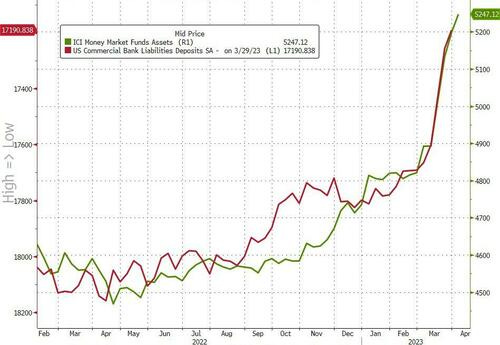
On the bright side, the pace of outflows has slowed to $55.7 billion (from around $180 billion the previous two weeks), but the outflows look set to continue as Money Market fund inflows kept rising this week (a week ahead of the deposit data)...
Source: Bloomberg
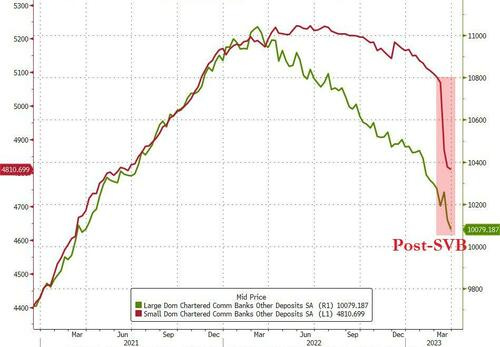
Both large and small banks saw outflows once again, with large banks seeing $48 billion in outflows (to the lowest since March 2021) and small banks seeing a modest $7.2 billion in outflows (to the lowest since June 2021)...
Source: Bloomberg
On a seasonally-adjusted basis, Small banks saw around $275 billion in outflows in March (which included the week running up to SVB's collapse) while large banks have seen $195 billion in outflows during that same period.
Last week saw outflows (SA) from large, small, and foreign banks
Large banks: -$39.9BN for week ended March 29, vs -$89.8BN last week
Small banks: -$44.8BN for week ended March 29, vs +$5.8BN last week
Foreign banks: -$26.4BN for week ended March 29, vs -$41.7BN last week
On a non-seasonally-adjusted basis, Small and Large banks saw inflows while foreign banks saw the 3rd straight week of outlows...
Large banks: $48.7BN for week ended March 29, vs -$92.2BN last week
Small banks: +$25.7BN for week ended March 29, vs $47.5BN last week
Foreign banks: -$32.1BN for week ended March 29, vs -$35.4BN last week
So with outflows continuing (and the spread between banks and TSY/MM fund yields), will banks start to compete for deposits? (Well not the biggest ones, for sure)...
“There are two key questions raised by the recent deposit turmoil,” Barclays Plc strategist Joseph Abate wrote in a note last week.
“How many deposits do banks ultimately lose to higher yielding money market funds? And how costly is it to replace this funding?”
Until now, when banks have lost deposits they haven’t had to compete aggressively so rates have lagged the Fed’s rate increases, and balances at government-only money fund balances had been flat since the hiking cycle began.
“But now that depositors have noticed, this dynamic is about to change,” Abate said.
And if the small ones start to 'compete' their profitability will collapse even further.
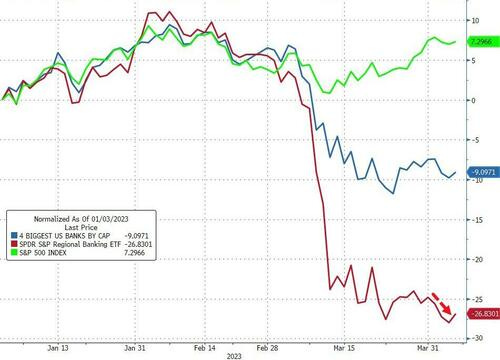
Which probably explains why regional banks just can't bounce...
Still think this bank-run is over?
It's easy to tell from here - as we detailed previously (and as far back as Nov) - as long as we are above the reserve constraint level for small banks, there is stability courtesy of the Fed's massive reserve injection.
It appears Small banks are moving back towards the critical level, and the closer we get to that level, the greater the risk of bank failures and Fed panic.
The H.8 Release from the Federal Reserve’s Board of Governors details aggregate balance sheet data (assets and liabilities) for all US commercial banks, and the data can be found in FRED. Our previous post on this topic covered total bank assets for large versus small commercial banks. Neither of these posts provides a comprehensive examination of the US banking sector, but we’re continuing to highlight a few key trends in light of recent developments.
This post (the 2nd of 3) examines recent trends in the securities held by large and small domestically chartered commercial banks: Securities comprise the second-largest category on the asset side of the balance sheet, with two subcategories.
Treasury and agency securities are obligations issued by the federal government (Treasury securities), US government agencies such as the Federal Housing Administration, and US government-sponsored enterprises such as the Federal National Mortgage Association (“Fannie Mae”).
“Other securities” are mortgage-backed securities not issued or guaranteed by the US government or other entities, such as those issued by states or political subdivisions.
In the latest reporting week (March 22, 2023), the value of Treasury and agency securities for US commercial banks totaled $4.15 trillion and Other securities totaled $1 trillion.
The FRED graph above plots Treasury and agency securities as a percent of total bank assets for (i) large and (ii) small commercial banks from the week ending January 7, 2015, to the week ending March 22, 2023. This 8-year period encompasses the previous FOMC tightening cycle (2015-2018), the pandemic recession in early 2020, and the current economic recovery and current FOMC tightening period since March 2022. The graph also includes the yield on 10-year Treasury notes, which is a common benchmark yield for longer-term loans such as 30-year fixed-rate residential mortgages.
At the beginning of 2015, large and small commercial banks held a roughly equivalent percentage of their assets in the form of Treasury and agency securities—about 15.5%. Since then, large banks have increased their holding of Treasury and agency securities to a little less than 24% of their total assets—though that percentage is down modestly from its peak of 26.3% on February 16, 2022.
Small banks, however, were reducing their holdings of Treasury and agency securities until just after the recession ended: Government securities as a percentage of assets fell to 12% in late May 2020. Thereafter, small banks began to increase their holdings of securities, which reached 17.1% in late August 2022. Since then, small banks, like large banks, have begun to reduce their holdings of government securities, so that the percentage of assets as of March 22 (15%) is now slightly less than the percentage that prevailed in January 2015 (15.5%). The recent reduction in securities holdings by banks is not surprising, given the recent rise in interest rates.
So, how do movements in interest rates affect bank holdings of securities? One of the fundamental relationships in finance is the inverse relationship between bond prices and interest rates. The price of a bond, and thus its yield (interest rate), is determined by a myriad of factors that influence both the supply of and the demand for bonds. One determinant of the demand for bonds is investors’ expectations of future inflation. All else equal, an increase in expected inflation means that the fixed payments promised by a bond’s issuer (e.g., the US government) will have a lower value than originally expected. In that case, the price of the bond will fall and the interest rate will increase. Similarly, if bond investors expect interest rates to rise—perhaps because of higher inflation and future actions by the Federal Reserve to tamp down inflation—bond prices are expected to fall, leading to the expectation of a capital loss. This also makes bonds less attractive. (See this On the Economy blog post.)
As the FRED graph above shows, small and large commercial banks were adding to their holdings of government securities during a period of rising interest rates (and higher inflation). In essence, banks were adding securities that were paying more in interest, which increased their interest earnings. However, the trade-off is that the market value of their bond portfolio was declining. This is not necessarily a problem if the bank intends to hold the security to maturity.
The peak in government securities holdings for large banks (as a percent of total assets) occurred in the week ending February 16, 2022 (26.3%), roughly a month before the FOMC increased its federal funds target rate, which commenced the current rate-tightening period. By contrast, small banks continued to add to their holdings of government securities; the peak (17%) did not occur until roughly six months later, the week ending August 24, 2022. Since then, as noted, securities as a percentage of assets have declined at large and small banks as interest rates have risen. Thus, there were realized or unrealized losses on commercial banks’ securities portfolios during the period of rising interest rates. According to the FDIC, total unrealized losses on securities that are available for sale and those held to maturity was about $620 billion at the end of 2022.
The third related post on this topic will examine recent trends in loans and leases and deposits. FRED users who are interested in monitoring the US commercial banking sector can do so by analyzing weekly trends in commercial banks’ balance sheets found in the H.8 data.
And now for something completely different … here then there are POSITIONS
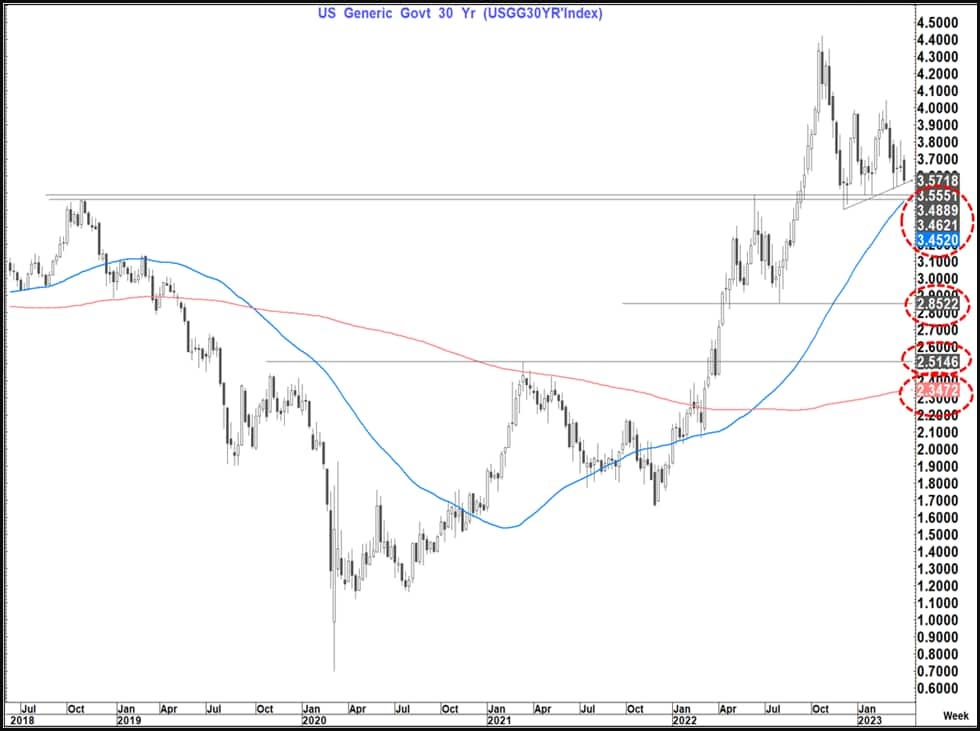
Hedgopia- Large specs net SHORTS in 10y futs UP ~32% WoW to a 5wk HIGH as 10yy drops 21bps,
AND for any / all (still)interested in trying to plan your trades and trade your plans in / around FUNduhMENTALs, here are a couple economic calendars and LINKS I used when I was closer to and IN ‘the game’.
First, this from the best in the strategy biz is a LINKthru TO this calendar,