(USTs bid, steeper on light volumes)while WE slept; basis traders; yields - from historical (1790) average TO, "Are Bond Yields Facing Historic Overbought Correction?"; foreign private BUYERS USTs
thebondbeat.substack.com
(USTs bid, steeper on light volumes)while WE slept; basis traders; yields - from historical (1790) average TO, "Are Bond Yields Facing Historic Overbought Correction?"; foreign private BUYERS USTs
(USTs bid, steeper on light volumes)while WE slept; basis traders; yields - from historical (1790) average TO, "Are Bond Yields Facing Historic Overbought Correction?"; foreign private BUYERS USTs
Good morning. USTs are bid and, best I reckon, thanks largely due to the UK ‘flation print impacting GILTS markets …
Bloomberg: 5 Things You Need to Know to Start Your Day
… Bost For Rate-Cut Bets Cooler-than-expected UK inflation data has bolstered bets that major central banks will start cutting rates next year. The UK’s headline inflation reading, which came in softer than estimates at 3.9%, boosted European stocks and bonds this morning, with the good mood spreading to US Treasuries and stock futures. This comes after Federal Reserve Bank of Richmond President Thomas Barkin suggested the US central bank would cut interest rates if recent progress on inflation continues. Markets are shrugging off recent attempts by central bankers to push back against speculation around impending rate cuts, with investors the most optimistic since the beginning of 2022, according to a Bank of America survey published yesterday.
… And this has injected some holiday-spirited (ie light volumes, light staffing, exaggerated price action) BID which has spilled over TO … USTs. Ahead of this afternoons 20yr auction (noted / VISUALIZED HERE yesterday).
These ‘holiday-spirited’ markets are music to the ears of the HFs (perceived as vultures and bad guys but truth is they are a necessary provider OF liquidity when needed) …
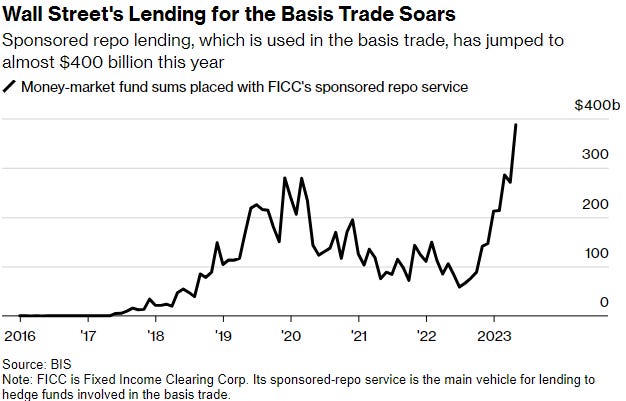
Bloomberg: The Hedge Fund Traders Dominating a Massive Bet on Bonds
A small bunch of hedge fund traders dominates the massive basis trade. They’ve made billions for their firms — and alarmed financial supervisors.
Jonathan Hoffman, John Bonello and Jonathan Tipermas share more than just similar first names. They’re the driving force behind a gigantic wager on government debt that’s been giving regulators sleepless nights.
They and their teams are top players in the “basis trade,” a bet by a few of the world’s biggest hedge funds that profits from the tiny price gaps between Treasuries and derivatives known as futures, people active in the market say. That makes them some of the most important individuals in finance today.
As part of a core group of 10 or so firms, they rely on vast sums of money borrowed from Wall Street banks — often 50 times what they invest themselves — to pump tens of billions of dollars into the trade and supercharge returns. So colossal are their bets that some say they’ve become central to the buying and selling of Treasuries, itself the cornerstone of global capital markets…
… While it’s difficult to tell how much of this is held by the core trader group, the wager has become more concentrated this year. Eight or fewer traders are behind almost half of all bets against two-year Treasury futures, compared with 29% a year ago, data from the Commodity Futures Trading Commission shows.
… Enabling all this is the group's abundant access to the magic ingredient that lets it happen: leverage. Wall Street giants such as JPMorgan Chase & Co. and Bank of America Corp. lend to them in massive volumes in exchange for fees.
Banks have only a fixed amount of leverage to dole out, so they tend to favor their best clients. Multi-strategy hedge funds such as Millennium, Citadel and ExodusPoint are a perfect match because they have other high-turnover businesses attractive to Wall Street lenders…
… “If we don’t allow regulated entities to make markets, then we set up this scenario, it’s evolution,” says Kaminski at AlphaSimplex, referring to the emergence of the basis traders on finance’s center stage. “And if they do it in a systemically important market, they’re naturally going to have that too-big-to-fail angle.”
… here is a snapshot OF USTs as of 705a:
… HEREis what this shop says be behind the price action overnight…
… WHILE YOU SLEPT Treasuries are higher with the curve bull steepening with the UK curve sharply bull steepening this morning after another below-estimates UK CPI release (see above). DXY is higher (+0.2%) while front WTI futures are higher too (+1.25%). Asian stocks were mixed, EU and UK share markets are mixed too while ES futures are showing -0.2% here at 6:55am. Our overnight US rates flows were seasonally muted with small fast$ selling seen after the UK CPI inspired pop. Overnight Treasury volume was ~70% of average across the curve.
… Early this afternoon, Treasury will offer up $13bn in re-opened 20-year bonds. Our next attachment looks at the Tsy 10s20s30s 'fly to get a bead on how 20yrs line up on curve. Treasury 20-year yields have fallen almost 60bp since the 20-year auction last month so there has been no outright rate concession, certainly. On curve, 20yrs have cheapened a touch over the past week and a half while sitting in the middle of a range (42bp to 50bp, roughly) that we'd expect into next year at least. One thought is that today's sleepy markets could offer a chance to grab a tail in 20yrs and to piece one's way into the 'fly close to the expected range highs/cheaps just mentioned? The desk will have the last word on 20's later this morning, as always.
… and for some MORE of the news you can use » The Morning Hark - 20 Dec 2023 and IGMs Press Picks (who CONTINUES to be sportin’ that new, fresh look) in effort to to help weed thru the noise (some of which can be found over here at Finviz).
Moving from some of the news to some of THE VIEWS you might be able to use… here’s SOME of what Global Wall St is sayin’ …
Barclays: November housing starts show early effects of easing mortgage rates (nothing happens either direction without some sorta consequence…)
Housing starts increased a surprisingly strong 14.8% m/m in November, a third month of growth after August's weak print. Housing permits declined 2.5% after rising in the previous month.
Citi: 2024 Outlook (year end BASE: 2s 3.70, 10s, 3.90 and bonds 4.10)
… When thinking about forecasts for 2024, it is worth contemplating what the distribution of Fed Funds for YE 2024 would look like because the 10y yield is highly correlated to Z4 (and Z5) SOFR rates. We revisit our Z4 distribution estimation based on different variations of the Taylor rule. We first discussed this approach in US Rates Weekly - Control is over-rated. The Cleveland Fed’s simple monetary policy rules tool lets us compare various specifications of the Taylor rule according to different parameters, including R* (natural rate of interest). In other words, we can estimate the “fair value” of Z4 based on various assumptions of R*, inflation and unemployment …
For a while now we’ve focused on the correlation between bond yields and equity prices, which after having been positive for a couple decades turned negative around the start of the Fed hiking cycle in 2022. (In returns-space, the bond-equity correlation flipped to positive.) As a result, bonds have been a less effective hedge and diversifier of risk and so should command higher term premia (see here).
Why did the correlation shift and what are its prospects going forward?
There’s a long and inconclusive literature on the drivers of the bond-equity correlation, but we’d highlight two interrelated fundamentals. First is the relative prevalence of aggregate supply vs. demand shocks. The former tend to drive yields and risk assets in opposite directions and as they become more prevalent (or are perceived as such), the overall yield-equity correlation should decline. Second is the monetary policy regime and the perceived central bank reaction to inflation shocks. The more aggressive the central bank is in responding to inflation shocks, the more yields should rise and equities fall in response to them.
This second mechanism has been particularly important this cycle. With inflation materially above the Fed’s 2-percent objective and heightened risks that inflation expectations could become unanchored, the FOMC has responded aggressively to inflation, and the market has priced that accordingly.
Today’s COTD presents evidence on this from the sensitivity of TIPS yields to CPI data. The chart plots the time-varying beta of the 10y TIPS yield to surprises in yearover-year core CPI inflation, using rolling 18m, 12m, and 6m regression windows. Surprises are measured relative to Bloomberg consensus and normalized so that the beta captures the typical daily change in the 10y TIPS yield in response to a onestandard deviation upside inflation surprise.
As the chart shows, after a long period of mildly negative betas, TIPS yields became very sensitive to inflation surprises in 2022, with the shorter-window estimates pointing to a roughly 10-15bp rise in response to a unit inflation surprise. Importantly, these measures don’t yet show signs of easing back, suggesting continued pressure on bond-equity correlations. However, this should eventually shift as inflation continues to fall and the Fed pivots to dialing back policy restraint, and we’ll be monitoring the betas for signals on correlations going forward.
The latest edition of the Fed's Summary of Economic Projections (SEP) showed a dovish shift down with respect to policy rate expectations for 2024 (see "December FOMC: Powell breaks out punchbowl early at the holiday party "). Relative to the September SEP's median forecast of 50bps of rate cuts in 2024, last week's version pointed to 75bps of policy easing next year. In our view, the significant downward adjustments in officials' core inflation forecasts – 2023 and 2024 fell by 50bps and 20bps, respectively – was likely the main factor behind the more dovish outlook (see "Decelerating inflation data drive dovish December surprise ").
In previous work, we attempted to identify the 2024 dots in the September SEP (see “Sufficiently restrictive” depends on the data"). In this piece, we update our assumptions for the 2024 dots and look at the implied forecast changes from September to December – in particular for the 2024 FOMC members. If our September / December identifications are correct, the latest edition of the dot plot may have marked a notable shift for some Committee members – in particular, Governor Waller and Chair Powell.
JEFF: Nov Housing Starts Soar 14.8%, but One Month's Data Does Not a Trend Make (never ‘annualize’ … an excellent point here NOT to jump to conclusion after a single point of data!)
■ Housing starts rose 14.8% m/m in November to a 1.560M unit SAAR, the highest since May. Starts collapsed during the summer, and they have stabilized in recent months, but the spike in November is unexpected as the high forecast in the BBG survey was 1.429M. ■ All housing data suffers from measurement difficulties due to high seasonality, high sensitivity to weather, and the presentation as an annualized number. So while the headline statistics are certainly encouraging, and suggest that a critically, chronically under-supplied market is about to find some relief, we are skeptical that we will see this strength persist. ■ For a while, starts have been dominated by multi-family projects rather than single-family, but November was different. Single-family rose 18% m/m, while multi-family starts rose 6.9%. ■ Residential construction activity has been hampered by high rates for construction loans, high wages for construction workers, and high costs for materials, as well as high prices, low inventories, and high borrowing costs presenting difficulties for buyers. The recent NAHB data suggests builder optimism is improving in response to mortgage rates having come down about 100 bps from the peak, but the November starts data is getting ahead of itself.
2023 will likely go down in history as a year of extreme speculation. However, we believe there are once-in-a-generation investment opportunities for 2024 resulting from that overly speculative myopia.
In our year ahead outlook, we outline 4 themes embedded in our portfolios for 2024 that cut through the speculation. Similar to the opportunities after the Technology Bubble, there seem to be plenty of attractive investments - they're just not in this year's favorite "Magnificent 7."
…Reviewing 2023 … Yet, the US economy has been stronger than anticipated, and corporate profits appear to be troughing. Chart 3 shows the Citi US Economic Surprise Index, which measures whether economic data has been better or worse than economists had forecasted. Higher figures indicate more positive surprises. This indicator can be volatile over short periods, but the Economic Surprise Index has been in a meaningful upward trend over the past year, reflecting that the US economy was generally stronger than was forecasted.
… With this backdrop, our portfolios enter 2024 with four embedded themes:
Nowcasts point to continued moderation in inflation, but resilient retail spending UBS Evidence Lab Nowcast expects the core CPI to increase 0.16% m/m in December, below the US Economics team's preliminary estimate of a 31 bp increase. Used car pricing and airfares are expected to drive the lower core prices this month, offset by stable new car pricing and lodging. Rents continue to increase M/M, but at stable rate vs. the first half of 2023. The Nowcast points to a headline CPI SA m/m decrease of 0.01% driven by continued lower energy prices this month. The US Economics team's preliminary estimate for headline CPI is a 24 bp increase. Retail spending, ex-autos and ex-gas is estimated to increase 0.21% M/M this month.
The Nowcast projects the ISM manufacturing composite index to increase to 49.3 from last month's 46.7. The Bloomberg consensus is 47.4. Additionally, the Nowcast projects continued firm levels of auto and light truck sales (SAAR). Nowcast also estimates nonfarm payrolls to continue to remain elevated at ~175k m/m but continuing to moderate in level each subsequent month. Finally, the Nowcast predicts industrial production to decrease -1.2% m/m in December. Private construction spending is projected to accelerate 2.35% m/m, led by better residential activity
UBS: 15 Essential Charts: Clear for Take-off or Bringing Forward Future Returns?
Powell’s victory lap pivots '24 gains into ’23 … We think the Fed’s pivot shifts returns from 2024 to 2023. Our end-’24 targets for US 10y yield (3.6%) and the S&P500 (4850) are now only 35 bps and 1.8% away, respectively. We are not changing these.
Positioning helps near term CTAs have now covered their shorts in both equities and bonds, but our model suggests they will further build their nascent long positions (Figure 1CTAs havecord sht,buwil keybuild ongs). Sentiment has swung aggressively bullish, with the AAII net bull to bear ratio at 87%ile of a 10y distribution (Figure 2The sntimbulsh, tparicon hasbelimtd). Our quant crowding factors suggest flows / volumes haven’t yet followed.
But risk premia & growth aren’t such as saw a Q1 equities rally in the past
… Figure 10: Impact of tightening yet to play out. Lower rates shouldn’t lift growth immediately in ’24
Given the net interest expense in the economy was still going down until Q3 ’23, it's clear that monetary policy is playing out with long lags. This should be just as true with regard to tighter policy since Mar ’22 as it was about loose policy prior to that. Even as the Fed cuts rates in 2024, taking the marginal yield lower, the average coupon being paid by consumers and businesses should be rising.
Residential Construction Turns Up as Mortgage Rates Turn Down
Summary November Gain in Both Single Family and Multifamily Starts Total housing starts bested consensus estimates and surged 14.8% to a 1.56 million-unit pace. November's gain was broad based, with single-family and multifamily starts rising sharply during the month. A modest rise in single-family permits and steep decline in multifamily permits takes some shine off the massive gain in starts. Unseasonably warm weather in November, which likely allowed more projects to get underway, may explain the divergence in starts and permits. That noted, the NAHB Housing Market Index improved for the first time in four months during December, with notable increases in the future sales and buyer traffic components. All told, the surprising pick-up in residential activity recently indicates that home builders are becoming more optimistic as mortgage rates trend lower and economic growth remains resilient.
Wells Fargo: Our Favorite Charts of 2023 (echo the Hemingway sentiment here…)
“Show the readers everything, tell them nothing.” ― Ernest Hemingway
Words and numbers are the tools of the trade in economics, and it is an occupational hazard of the dismal science to get carried away with both. In our finest hours though, we remember Hemingway’s imperative and develop a chart that does most of the talking for us. That is the premise of Our Favorite Charts of 2023. At the end of this report, you'll also find our Wells Fargo Economics Wrapped, which highlights our most-read reports of the year.
…Don't Fall into the Gap When income is not growing as fast as production, it can reflect labor market challenges, corporate profitability concerns or external trade dynamics. Right now the gap is as big as it has been since the 1940s.
In theory, Real GDP and Real GDI should be the same, though in practice they can differ because they are constructed using independent source data. GDP looks at the expenditure side of the economy, while GDI tallies the income side. Prior periods of disparity were also near the end of a Fed tightening cycle, periods of dollar strength and (at least in the case of the 2008 experience) a sharp narrowing in the trade deficit.
…Passive Aggression After three years of a negative real federal funds rate, monetary policy moved into restrictive territory in 2023. The last rate hike for this cycle is in, and we do not expect the Fed to cut until inflation is returning to 2% on a sustained basis. That means there will be a passive tightening as the real fed funds rate moves higher in coming months as inflation recedes, even as the FOMC remains on hold.
…Peak My Interest The cost to households of servicing debt as a share of their disposable income has been rising across many major economies throughout 2023, reaching its highest point since the aftermath of the Great Recession in several economies.
Rising debt and ballooning interest expense are only a problem if income is not rising as quickly. It is increasingly apparent that income is no longer keeping pace with the combination of both rising debt and rising financing cost.
… And from Global Wall Street inbox TO the WWW,
Bloomberg: 5 things to start your day (Europe edition on rate cut bets)
Even in a sea of bond gains, two-year Treasury yields are standing out as the only major tenor well above 4%, considering the number of rate cuts traders have rushed to price in for 2024. The gap suggests those bets have gone too far, especially when stacked against the Federal Reserve’s own rate projections and the general state of the US economy.
While Fed Chair Jerome Powell did give markets a nod toward rate cuts next year, traders — as they typically do — took that as a sign to turbocharge their bets for lower borrowing costs. In the past six months, they’ve added about three more quarter-point rate cuts to their expectations for 2024. That marks a stark contrast with just a 25-basis-point drop in two-year yields, the part of the curve that’s most sensitive to the interest-rate outlook.
The pricing looks odd compared with the Fed’s projection for 75 basis points of reductions next year. Even odder, when compared with data that has showed persistent housing inflation, as well as employment reports that indicate the labor market is moderating — not deteriorating.
While the Fed has laid out a soft-landing scenario that will allow them to slowly reduce rates, markets have rapidly priced rate cuts more consistent with a hard landing. That gap has led Bloomberg Opinion columnist Mohamed El-Erian to note that the central bank has a “real problem” with communication — a sentiment probably not lost on members of the rate-setting committee. Expect them to continue their pushback on excessive rate-cut bets into next year, particularly if economic data keeps supporting the case for a mild, not rapid, slowdown.
Kimble: Are Bond Yields Facing Historic Overbought Correction? (funny from just YESTERDAYwhen considering how bond yields are near HISTORIC — ie since 1790 — average to today when they are facing ‘historic’ overbought correction … context is key?)
The past few years have seen interest rates soar. But perhaps it’s a case of too far, too fast.
Today we look at interest rates in the form of treasury bond yields. And more specifically, the 30-year treasury bond yield.
As you can see, the 30-year bond yield has been in a downtrend since peaking in the early 1980’s. But the recent rally may have ended that.
Needless to say, yields have either burned too hot or too cold a few times over this stretch of time. So how do we measure this?
Well, when yields have been a great distance above or below the 200-week moving average, long-term inflection points come into play.
First, it was the early 80’s when yields got 60% above its 200-day MA. Then, it was the COVID meltdown at (1) when yields fell sharply to 60% below the MA. And now yields have popped 60% above the MA at (2).
And, once again, yields are beginning to fall. Is it time for yields (interest rates) to come back down to earth?
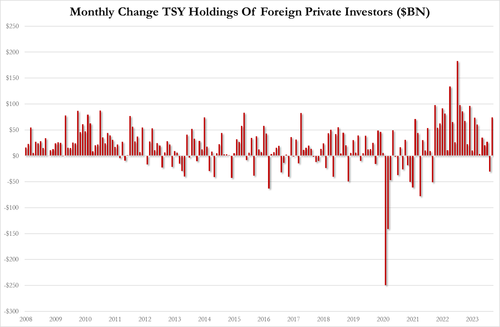
ZH: October Was The 2nd Biggest Month Of Foreign Selling Of US Stocks Ever, Officials Dump TSYs As Gold Reserves Soar
… While both private and official entities were sellers of stocks in October, Foreign Official entities were net sellers of US Treasuries...
..but Private entities were buyers of Treasuries...
Belgium and Luxembourg were the biggest sellers of US Treasuries (-$31.6BN and -$28.2BN respectively) and China was also a seller (-$8.5BN)
Combining China and Belgium's data (since Beijing is using Euroclear as custodian for many of its TSY holdings), we see that "China" sold over $40BN in TSYs in October - its second biggest-selling month since Nov 2016...
WolfST: Are Foreign Holders Finally Bailing Out of the Incredibly Ballooning US National Debt?
Good luck as you plan your trades and trade your plans and … THAT is all for now. Off to the day job…
To tag onto your Hemingway quote, a new fav of mine from Napoleon: To succeed in life, promise everything and deliver nothing. Seems to be the operating policy of many a government these days!


To tag onto your Hemingway quote, a new fav of mine from Napoleon: To succeed in life, promise everything and deliver nothing. Seems to be the operating policy of many a government these days!