With BoJ now in rear view mirror I’m looking ahead TO tomorrows 20yr auction because, well, frankly, I’m happy to say not much else going on out there here and now … AND I was impressed at some TLINES etched in since the last time I had a peek (not that often) …
AND with 20yy (just north of 4.25%) on my mind for NO apparent reason other than TOMORROWS auction AND that comes these days heading into XMAS and the new year (light staffing leading to exaggerated vol), we can HOPE there will be little in way of news and views forcing one and all to REwork forecasts for the year ahead.
Which were just created over the past month.
And re-worked over the past week.
Bloomberg: Wall Street Forced by Fed to Rethink 2024 Bond Yields
Rally unleashed by Dec. 13 policy shift saw rates outlook met
Revised forecasts for Treasury yields still span a wide range
… The median forecast of strategists at the world’s biggest financial institutions is now for the 10-year US Treasury yield, a benchmark for multiple markets, to fall to 3.98%. That’s hardly far from its level of 3.93% as of Monday’s close, but markedly lower than its yield before the Fed’s pivot: 4.20% — itself down from a 2023 high above 5%.
At the low end, TD Securities thinks the 10-year rate has scope to slump to 3% in a year from now, following 200 basis points of Fed rate cuts beginning in May. Goldman Sachs Group Inc. and Barclays, while capitulating on their views that rate cuts were unlikely before the fourth quarter of next year, forecast yields to end 2024 at 4% and 4.35% respectively.
“Whenever you see that disparate range of estimates, that’s when you know that a trend has come to an end and you’re about to embark on something new,” said Bryce Doty, whose team manages $9 billion in government bond funds at Sit Investment Associates. The Fed’s dovish pivot, Doty added, was “the bell going off telling you we’re at a turning point.” …
Thanks to the Fed and all the kings horses sent out this past week / end / yesterday to … ahem … clarify. Daly (2024 voter) …
Central bank must make sure ‘we don’t give people price stability but take away jobs,’ says San Francisco Fed president
… Daly said she thought interest-rate policy was in a “good place” to achieve that result. In a notable shift, she said the Fed’s focus now needed to turn toward paying attention to both sides of its mandate.
“There is more work to do, and at this point, that work includes not only focusing on bringing inflation down to 2%…but also recognizing that we want to continue to do this gently, with as few disruptions to the labor market as possible,” she said…
… Daly said rate cuts would be appropriate to prevent inflation-adjusted or “real” rates from rising by holding nominal rates steady as inflation declines. Allowing real rates to increase would create an elevated possibility “that we could overtighten quite easily, and so that’s what I’m mindful of,” said Daly, who will become a voter on the Fed’s rate-setting committee next year.
… Daly said it was too soon to speculate at which meetings the Fed might change its policy stance next year. “Right now, I’m really focused on how well things have evolved in 2023,” she said.
… A model maintained by the San Francisco Fed suggests two thirds of the decline in core inflation had been related to changes in demand. “To me, that’s a material development,” said Daly. “That means we have monetary policy working.”
Daly said it was possible inflation could show greater signs of persistence in the months ahead and that the economic outlook could shift in a way that would call for the Fed to keep rates higher for longer. On the other hand, inflation could decline more rapidly or the labor market could weaken more meaningfully than it has, justifying easier policy, she said.
… here is a snapshot OF USTs as of 705a:
… HEREis what this shop says be behind the price action overnight…
… WHILE YOU SLEPT Treasuries are modestly higher while the curve is a hair flatter as German bunds and JGB's outperform after the BOJ maintained their negative rate policy overnight (see above). DXY is little changed while front WTI futures are UNCHD this morning. Asian stocks were mostly higher, EU and UK share markets are UNCHD (UK) to higher while ES futures are showing +0.1% here at 6:50am. Our overnight US rates flows saw a mixed trade with some long-end buying noted amid dwindling client engagement. Overnight Treasury volume was surprisingly decent at 90% of average overall with 20yrs (200%) seeing the highest relative average turnover ahead of tomorrow's auction.
… and for some MORE of the news you can use » The Morning Hark - 19 Dec 2023 and IGMs Press Picks (who CONTINUES to be sportin’ that new, fresh look) in effort to to help weed thru the noise (some of which can be found over here at Finviz).
Moving from some of the news to some of THE VIEWS you might be able to use… here’s SOME of what Global Wall St is sayin’ …
Apollo: Fed Pivot Pushing the US Economy Back to No Landing Scenario
Last week, the Fed went from expecting another 25-basis point hike to now expecting 75-basis point cuts in 2024, and the chart below quantifies the impact of this 100-basis point pivot on the economy. At the same time, the market now expects 150 basis points in Fed cuts in 2024, and 10-year interest rates have declined by 100 basis points since they peaked at 5% in October.
The Fed pivot combined with a one standard deviation decline in VIX, a 60-basis point tightening in IG spreads since March, and a $20 decrease in oil prices since September will boost GDP growth by 1.5% over the coming quarters, see chart below.
The CBO estimates that potential growth in the US is 2%, so a 1.5% boost to GDP is significant. Stronger GDP growth will boost demand for housing, labor, airlines, hotels, restaurants, and goods, which ultimately will put renewed upward pressure on inflation.
The conclusion for markets is that the Fed pivot last week complicates the Fed’s goal of getting inflation back to 2%, and as we enter 2024, the pendulum will soon swing back from a dovish Fed to a more hawkish Fed.
The year-end rally got a boost from the dovish Fed Flip. Our analysis of prior Fed cuts indicates that it has indeed been a reliable buying signal for decades. It favors Tech and defensive sectors; large-cap over small; and Growth over Value. That said, we think the 'too high, too fast' rally is ripe for a breather in 1Q24.
… The rate sensitive Small cap stocks are now up by more than 21% from their recent lows as inflationary pressures ease, leading to Fed's recent pivot which has pulled down the 10y Treasury yields to levels below 4% for the first time in nearly five months. USD weakened last week by a modest -1.4% as Treasury yields fell across the spectrum, boosting returns of stocks with high international sales …
There are still two trading weeks left in 2023, but today is the last Monday trading day of the year since the market will be closed next Monday for the Christmas holiday.
Monday has easily been the best trading day of the week this year. The S&P has averaged a gain of 0.27% on Mondays in 2023 with gains 75.6% of the time. Since 1953 when the NYSE implemented the current five-day trading week, there has never been a year where the S&P closed higher on Mondays more often!
BNP US rates: Roadmap for Fed-sensitive ULC vols (truthfully only understood ‘bout every OTHER word here but … as holidays and years end grows closer, the sellside has said it’s piece — and revised it now a couple times :) so there should be less and less to say … in any case, hikes/cuts pricing caught MY attention … as the world turns…)
Fed-sensitive upper-left corner (ULC) vols have remained higher than they usually were before the onset of easing cycles since 2000.
Uncertainty about the timing of the first rate cut and deeper inversion at the front end of the curve are likely factors, but the path of inflation also remains key.
We expect choppy vols in the near term but a return to longer-term averages in the medium term.
The clearest risk scenario would be if rate cuts proved premature and had to be reversed quickly. That would likely see ULC vols rebound quickly and prolong the 2022-23 era of high volatility.
… Proximity to cuts: One possible driver of elevated ULC vols is uncertainty surrounding the time of the first rate cut. Markets had fully priced in a 25bp cut in March earlier last week. This has moderated to roughly 20bp, but market pricing still suggests a high probability of March for the first cut (Figure 2).
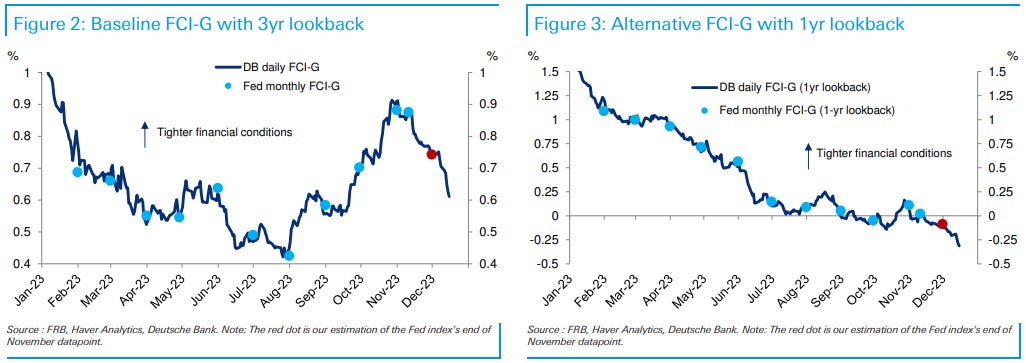
In the lead up to the November FOMC meeting, Fed officials highlighted how the significant tightening of financial conditions could substitute for needing to raise rates further and thus supported a careful approach to setting policy. Since that meeting, financial conditions have eased significantly.
Updating our daily version of the Fed staff's FCI, the recent easing in the baseline index unwound about two-thirds of the tightening seen since late July, while the alternative one-year index shows that financial conditions are actually three-tenths easier than they were at that time.
In theory, this easing should produce a more hawkish Fed, all else equal. However, Fed officials appear comfortable with the latest financial developments, mostly because they have coincided with weaker inflation readings. As we noted last week (see “Powell breaks out punchbowl early at the holiday party”), the context of financial conditions easing matters a lot for the Fed. If progress is being made on inflation, they are more willing to accept easier financial conditions. However, should future inflation data show a reversal of this progress, Fed officials could well look to retighten financial conditions.
Goldilocks BOJ MPM: Maintains Status Quo; Assessment of Economy/Prices Also Largely Unchanged
BOTTOM LINE: On December 18-19, the BOJ held its Monetary Policy Meeting (MPM) and maintained the status quo across all monetary policy parameters—yield curve control (YCC), asset purchase programs, and forward guidance.
Goldilocks: Top of Mind: 2023: 3 themes in charts (lots here but a couple of MY favorite charts which strike ME as funTERtaining)
… Long history of US 10-year Treasury yields - UST yields: higher, but near average
UBS: BoJ offered no surprise; market expectations were too high
BoJ stayed on hold as widely expected As we expected (see "BoJ preview: No need to rush"), the BoJ stayed on hold at today's policy meeting. All policy tools (Yield Curve control, including Negative Interest Rate policy at -0.1%; its conduct, including 1.0% reference upper bound of 10yr JGB yield; and asset purchases) and three forward guidances were unchanged. The decision was unanimous for all three points (YCC, its conduct, asset purchases).
The description of current state of economy and outlook was in line with what we saw in the October Outlook report. Worth noting is its positive view on private domestic demand, especially private consumption ("Private consumption has continued to increase moderately, despite being affected by price rises"), which fell two consecutive quarters of contraction in GDP report. The BoJ probably looks at its own Consumption Activity index, which rose Q3 and October (Figure 1). Business investment is also described as "has been on a moderate increasing trend" but the GDP based capex fell last two quarters as well (Figure 2). In any event, the BoJ is bullish on the assessment on the growth…
… What do we and others expect from here? In short, we and a majority of market economists/BoJ watchers expect a 10bp policy rate hike (end of NIRP) in April, while some are expecting earlier move on 23 January or 19 March. Our BoJ call is different from the majority beyond the first rate hike, and the 10yr yield upper bound. We expect a 25bp hike in July (then a pause until April 2025) but the majority expect only one 10bp rate hike. We expect the BoJ to maintain the reference of 10yr yield upper bound, but the majority appears to expect no such policy tool (more details in page 2).
The Bank of Japan, well known for its masterful inactivity on policy, was masterfully inactive on policy today. A change to yield curve control in the first quarter is possible if wage data supports such a move—it is wise never to get too excited about Bank of Japan action.
A number of Federal Reserve speakers have been "explaining" (which means "refuting") Fed Chair Powell's apparent dovish shift. The comments seem suspiciously coordinated. They don't mean rates will not be cut. They suggest markets should not get over-eager.
Several nations are forming a naval task force to protect commercial shipping from attack in the Red Sea. The oil company BP suspended sailings there yesterday, which had a modest impact on the oil price. While container shipping may be disrupted, weaker durable goods demand in Europe blunts the macroeconomic impact…
UBS: CTAs' Positioning and Flows - Biweekly Update
Time to catch a breath in equities, not in bonds CTAs have built long positions as fast as they have covered their shorts. Since our last update, they bought $30/40bln worth of global stocks, doubling their overall exposure, which now stands at its 70%ile of a 30+yr distribution. Inflows should moderate significantly from here (at $5/10bln), but not reverse. The average CTA signal (at +0.34 vs. max of +1.00) still suggests they have room to add, especially in EM/China equities.
In bonds, CTAs turned net long duration on the 7th of December. They are buying sizeable amounts across all markets at a record speed ($180/200mln Dv01 in just 7 weeks). Contrary to equities, we do not expect any slowdown in their buying programs…
… Levels to watch on UST 10y (TY) If we take the example of simulation 8, it shows the UST 10y would rally linearly from 3.91 to 3.52 (39bps rally, Figure 13UST 10yimulated Yilsand Figure 14UST 10yimulated Chngs(bp) over the next 2 weeks. After 7 business days, UST 10y should be at 3.63 (-27bps) and as a result, the signal would move from 0.00 to +0.25 (Figure 15UST 10yExpectd Signal, respont imulaed yis), i.e. a +0.25 change in signal (Figure 16UST 10yExpectd Changei Sl,nrespo timulaed yis). CTAs' position in UST 10y would increase from $+0.02 DV01mn to $+4.47 DV01mn (Figure 17UST 10yExpectd Posin($DV01 mn),irespon timulaed yis), i.e. a buying flow of $+4.44 DV01mn (Figure 18UST 10yExpectd Flows($DV01 mn),irespon timulaed yis). Extrapolating UST 10y change in signal to all bond futures, we get a total bond future flow of $+37.64 DV01mn (Figure 19Total BndFutre ExpctdFlows ($DV01mn) …
… I thought Powell would remain hawkish for yet another meeting, but not only did the Fed put more rate cuts into their Dot Plot, Powell actually communicated the Fed was starting to talk about rate cuts. This is a far different tone than Powell denying cuts as a consideration just a few short weeks back. This good news, combined with a very cool PPI report on Wednesday, led to an explosion in the markets—a rally I see as fully justified. View our timely reaction to the latest post-Fed meeting event replayhere…
… I was putting the odds of avoiding a recession next year at slightly better than 50/50, but post FOMC meeting the odds of skirting a recession had to improve to at least 2/3. While the significant fall in rates one could argue impacts higher duration growth stocks, the earnings impact from lower recession risk dominated the market trading…
… I expect the rally in equity markets to continue. The Dow already hit all-time highs. I expect the S&P 500 to follow and probably the NASDAQ. But we should see continued rotation to mid and small cap value stocks. There is also relief for the banks if rates are coming down faster. This is good for real estate. This is good for the struggling office sector as banks rollover loans.
The move in bonds has been extreme over the last 6 weeks and caused many to scramble for longer duration. I do not see more upside for bonds unless there is a recession. Clearly real softness in the economy could lead to 3% for the 10-year bond rate or lower. But I do not see us getting back to 1% rates of the early ‘20s.The inflation risk for longer term bonds and rising correlation between stocks and bonds leaves investors demanding more compensation for their fixed income holdings.My sense is the 10-year bond fluctuates between 3.5-4% with a future Fed funds rate eventually settling to 3%. For now, you can still earn well over 5% in short duration notes and that might provide a better hedge of key risks (a stubborn Fed) than the long duration bond which factored in cuts.
… And from Global Wall Street inbox TO the WWW,
Bloomberg: Risk-Asset Tailwinds Grow As Global Liquidity Ends Year On High
Authored by Simon White, Bloomberg macro strategist,
Global liquidity is ending the year on a very strong footing, supporting risk assets.
Liquidity conditions for most of this year have generally been favorable, but they have received a boost in recent weeks from the Federal Reserve and the PBOC, ensuring that the end of this year and the start of 2024 will be even more liquidity friendly.
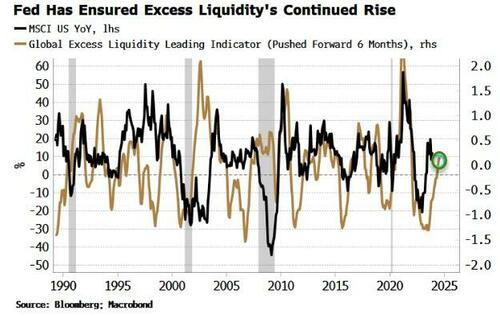
Global excess liquidity – the difference between real M1 growth and economic growth for the G10 in USD terms – was on the cusp of rolling over. However, the Fed’s abrupt dovish pivot last week will lift excess liquidity through a weaker dollar, as well as supporting global money growth by the green light it gave to an end to “higher for longer” for the major DM central banks.
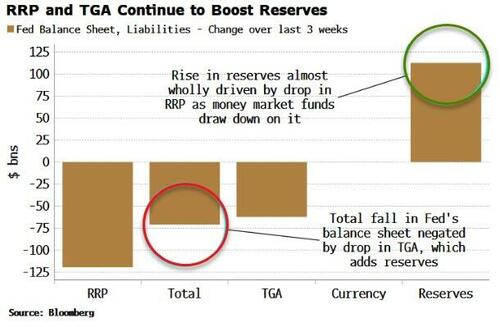
Moreover, in the US, reserves continue to rise. Despite quantitative tightening, reserves are higher than they were when QT started last year, with that rise accelerating in recent weeks. Reserves have increased over $100 billion in the last three weeks, driven almost wholly by a decline in the reverse repo (RRP) facility, as money market funds draw down on it to buy t-bills.
The fall in the Treasury’s account at the Fed of around $60 billion in the last three weeks has negated what would have been a ~$70 billion decline in reserves from QT.
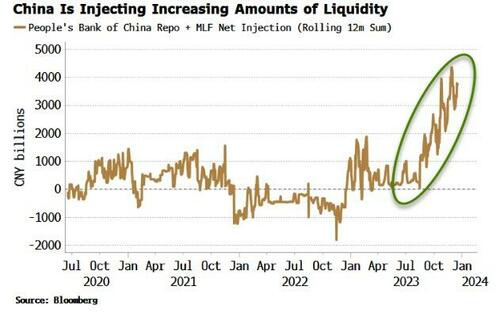
In China, liquidity is being added at an increasing rate. Net injections of liquidity by the PBOC from repo and the medium-term lending facility have risen sharply in recent months, and sit at just under CNY 4 trillion on a 12-month sum basis.
China’s data has been dismal. Inflation is negative and money growth has been weak, but the net injections of liquidity demonstrate policymakers are amping up the support for the economy.
Unusually, China has been a drag on global money growth over the last few years; unlike most of the last decade and a half where it has been a major driver of it. A re-acceleration in China’s money growth would radically upset the benign inflation environment foreseen by the Fed et al.
Either way, the global liquidity backdrop is strong at the moment, which will act as a solid tailwind for stocks and other risk assets into the end of this year and the next.
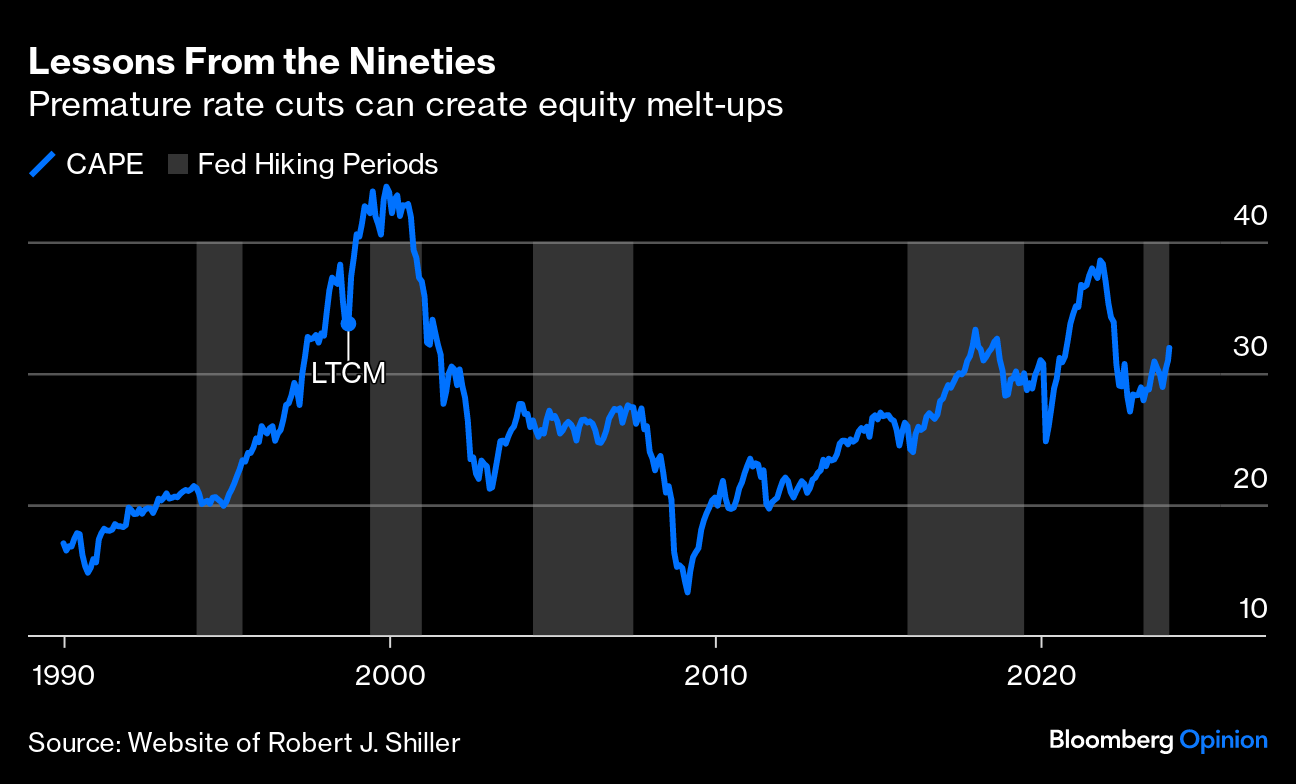
Bloomberg: Ghosts of Inflation Past haunt Fed's pivot party (boils down to a meme?)
…History Lessons The discussion has focused on the 1970s, when US inflation slipped out of control in a way that hasn’t happened before or since. Premature declarations of victory, both under Arthur Burns and later Paul Volcker early in his term, come in for much criticism. Cutting rates when inflation is trending downward but is still high proved disastrous, leading to the assumption that no Fed chief would ever want to risk being compared to Burns in their obituary.
Is it just possible that the risks of leaving rates too high for too long and taking the blame for an avoidable recession now bulk larger? That’s certainly the implication from this meme, from Forex Live, which might be the best commentary I’ve yet seen on last week’s FOMC meeting:
I’ve drawn attention to the ructions of 1998, when the Fed under Alan Greenspan decided to cut rates to re-liquify markets after they had almost ground to a halt following the Long-Term Capital Management debacle. That proved to be the starting point for the last stage of the melt-up, led by the dot-com stocks…
… In this chart, I’ve traced the cyclically adjusted price/earnings multiple for the S&P 500 against periods when the Fed was tightening. In each case, the shaded areas start with the first hike, and end with the first cut (so the current hiking episode isn’t over by this definition, even if there are to be no more hikes). It’s a complicated history:
In the mid-1990s, Greenspan handled things beautifully. Then, after one hike in the wake of his notorious “irrational exuberance” speech in late 1996, he lost the plot. The LTCMcut came when rates should have been rising. Cutting early and thereby avoiding the need to ease much more can work brilliantly. When I started covering Wall Street in 1996, Greenspan’s reputation was unassailable; regarded as a genius or “maestro,” both he and the institution commanded great respect. Unfortunately, Greenspan didn’t quit while he was ahead and pressed on until January 2006. (There might be a lesson in this for Powell, too.) By then, he’d made enough mistakes todeeply cloud his longer-term reputation. Powell may, on Mian’s argument, be betting that he can be 1995 Greenspan, not 1998 Greenspan. If so, markets could face difficulties when the cutting grinds to a halt earlier next year.
Of course, we need to be sure Powell really has his heart set on that, and has lost his fear of being Arthur Burns…
Sentiment most upbeat since early last year on Goldilocks bets
Central bank policy driving assets, not positioning: BofA
… The sentiment of global fund managers surveyed in December was the most upbeat since January 2022 on a Goldilocks environment — a steady economy that is not running too hot or too cold — as the case for next year, a team of strategists led by Michael Hartnett wrote in Tuesday note.
Against that backdrop, the poll showed investors are the most overweight on stocks since before the Fed started to hike interest rates, with cash allocations cut to a two-year low of 4.5% from 4.7%. Meanwhile, fund managers are the most overweight on bonds in 15 years. They are also the most bearish on commodities relative to bonds since March 2009.
“Policy, not positioning,” is the new tactical driver of asset prices, Hartnett said.
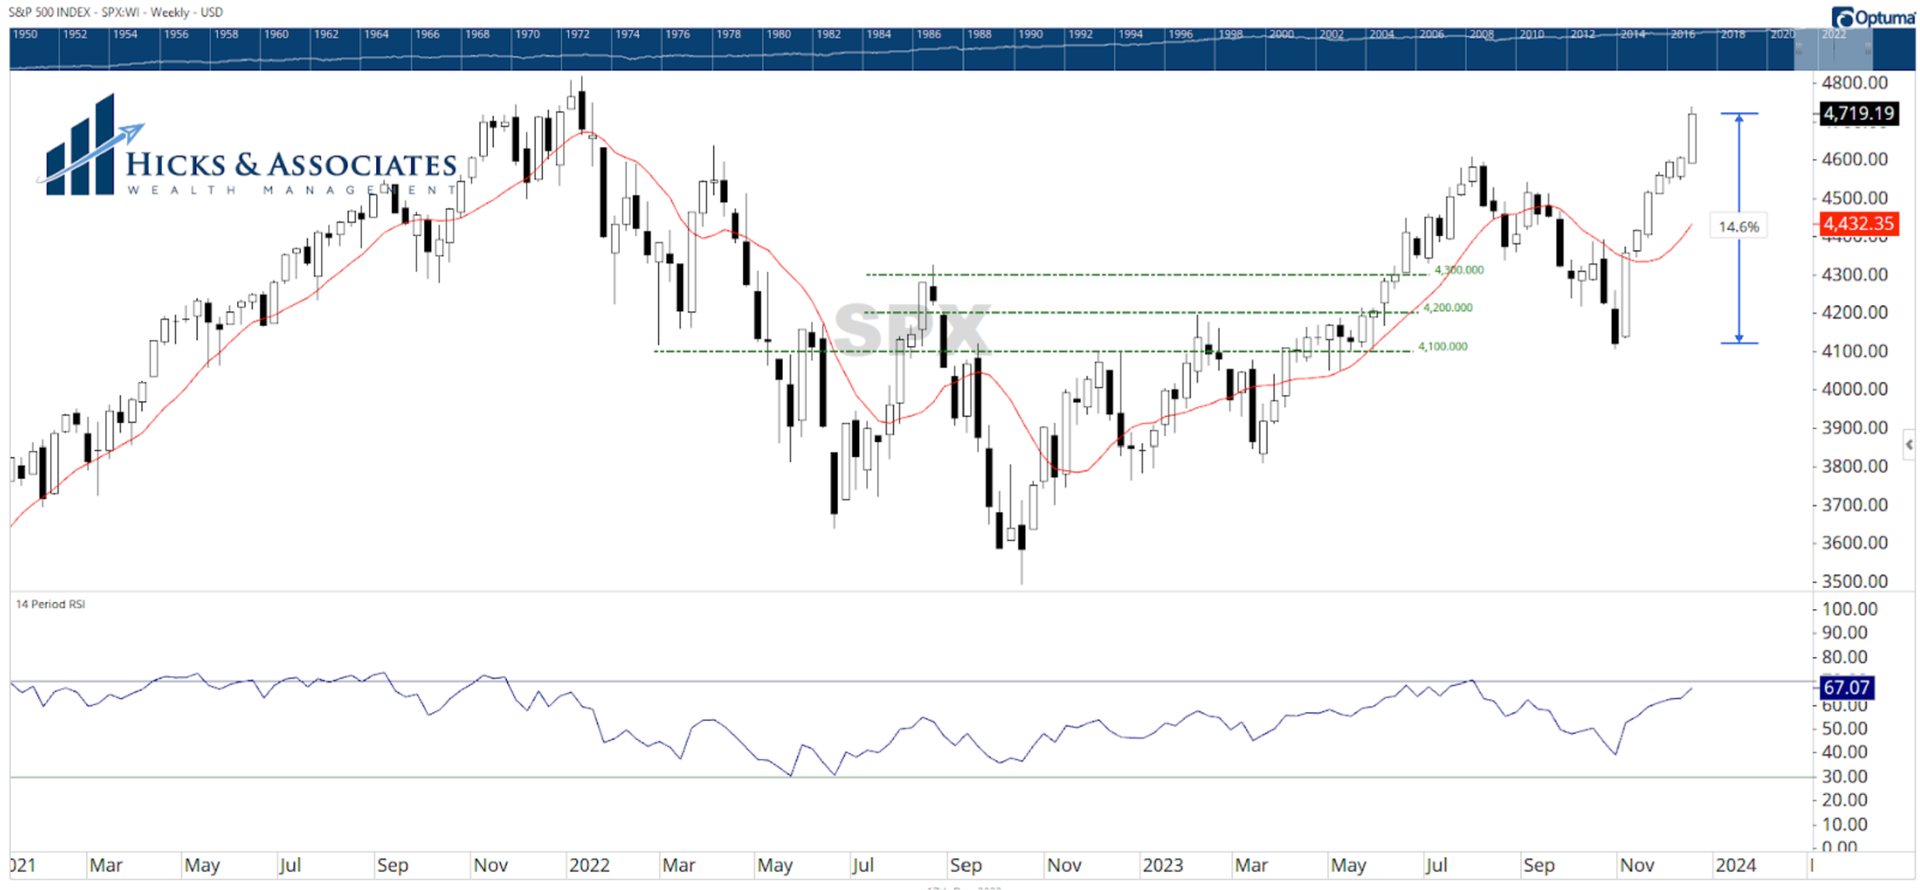
At the beginning of each week, our investment committee steps back and examines the big picture. This is what we refer to as our “Macro View”. In other words, we want to step back and examine the broader landscape before we start debating any portfolio changes in the week ahead.
Our first chart today is the weekly chart for the S&P 500; every candle represents a week. In examining the right side of the chart, where we all live, we very quickly see that the broad market has experienced a seven-week rally. While the rate of ascent slowed in weeks five and six, we have seen neither a pause nor a pullback over this seven-week time period.
If we examine the rest of the chart, we can see that it seems uncommon for such an extended period of white candles (representing upward moves) without any black candles (representing downward moves). As a result, simple logic tells us that we might be due for a pullback in the broader market. A look at the 14-period RSI confirms that the broad market is approaching overbought readings on this weekly chart. (If we were to examine a daily chart, and that 14-period RSI, we would see a reading of 78.19. A very overbought reading.)
Bonds appear to have entered a secular bear market. Even in the inflationary 1960s & 70s, however, UST10Y commonly reverted to its rising 200wma. From this perspective, a countertrend move could run much further than expected. Perhaps toward 3% or lower in 2024.
The S&P 500 equal-weighted index is near its all-time high and round-tripped from range lows to range highs in only seven weeks. And 90% of the index is above its 50-day moving average. These are strong breadth numbers, but they can often occur at short-term trading highs.
WolfST: Fed Members Fan Out to Douse Raging Rate-Cut Fires (well said)
And to my friends still IN the bond game … am curious which of these buttons you super heros are about to press
I appreciate your admitting to reading things that you don't at times fully comprehend. I'm nearly 5 yrs into my Alt-Fin reboot, and Highly relate to lacking comprehension; though my suffering has much decreased. Like I told my niece, keep at it, things begin to make sense over time.
I've had the same experience in skiing recently. I wasn't happy w/my Switch (backwards) skiing last wk. Then I practiced a LOT last Tuesday. By last Friday, I was skiing in Switch faster & longer than ever before. Nothing like real-time, measurable progress!
That J Pow meme is golden