(USTs being LED LOWER by Gilts on heels of firm EZ 'flation print all onLIGHT VOLUMES) while WE slept; Housing DOWN; Janice Eberly LIKES 'flation (is she short long bonds?)
Good morning … In the wake of yesterday’s FOMC minutes (choose your favorite excerpt about inflation fighting here), I’d ask if you are prepared or interested in bidding on 7yy Treasuries?
Momentum has been working off its overSOLD conditions and are now middle of the road — neither a bullish NOR bearish input. Yesterday’s 5yr liquidity event for a clue.
ZH: Solid Demand For 5Y Treasuries: Near Record Indirects Despite Small Tail
AND moving on … here is a snapshot OF USTs as of 707a:
… HEREis what another shop says be behind the price action overnight…
… WHILE YOU SLEPT Treasuries have been led a hair lower by the underperforming UK Gilt market with a record high print in euro area core inflation (see above) weighing on a day when Japan's on holiday. DXY is little changed while front WTI futures are higher (+1.2%). Asian stocks ex-Japan were mixed, EU and UK share markets are mix too (SX5E +0.5%, FTSE 100 -0.4%0 while ES futures are showing +0.5% here at 6:50am. Our London session US rates flows were limited to some further fast$ stop-outs in 5s30s curve steepeners with real$ continuing to pick away (buy) some of the un-loved and il liquid sectors of the curve. Overnight Treasury volume was very weak at ~50% of average overall.
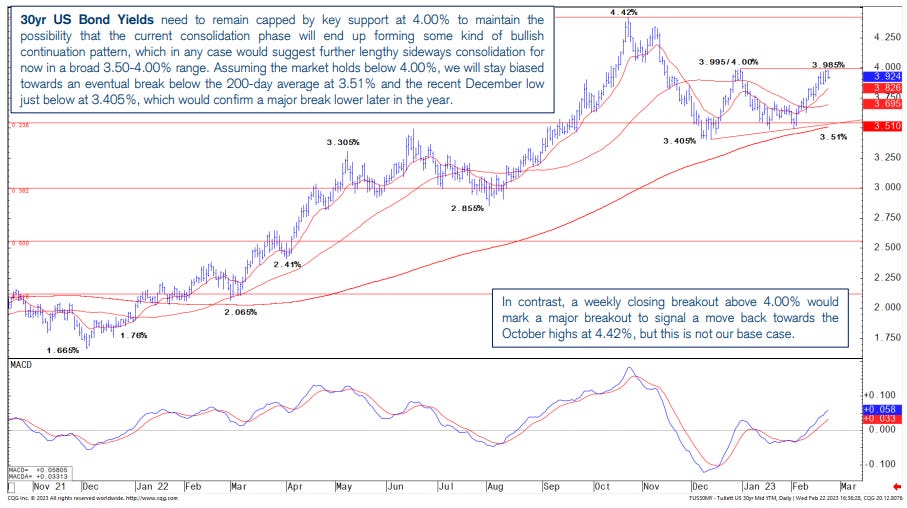
… Our first attachment shows the present day battle at support (3.985% area) for Treasury 30yr bonds. Locally 'oversold,' 30yrs have so far respected the support which is derived by the turn of the year move highs. We've shown this set-up before but in this update we've highlighted the next-support levels near 4.33% and then up at the move high from last fall at 4.42%. Weekly momentum (next attachment, see lower panel) hints that 3.985% should eventually get taken out but, as we're wont to say, the 3.985% level's a support until closed through. We should add that Treasury 2's, 5's and 10's have already breached their equivalent support levels in recent days.
… and for some MORE of the news you can use » IGMs Press Picks for today (23 FEB— and STILL SPORTING THAT NEW LOOK!!) to help weed thru the noise (some of which can be found over here at Finviz).
HERE is one for those with an interest in HOUSING (read: all of us),
REDFIN: U.S. Homeowners Have Lost $2.3 Trillion In Value Since June Peak
The Bay Area housing market has lost more value in percentage terms than anywhere else in the country amid sluggish demand. Florida continues to see large gains.
Home values are holding up better in the suburbs than in cities, which have seen an exodus of residents due to remote work.
Millennials, who are now in their prime homebuying years, have experienced larger value gains than other generations.
Asian homeowners have been disproportionately affected by home-value declines.
Values in areas with high flood and/or heat risk have held up better than values in areas with low risk, indicating that climate dangers aren’t priced in.
The total value of U.S. homes was $45.3 trillion at the end of 2022, down 4.9% ($2.3 trillion) from a record high of $47.7 trillion in June. That’s the largest June-to-December drop in percentage terms since 2008. While the total value of U.S. homes was up 6.5% from a year earlier in December, that’s the smallest year-over-year increase during any month since August 2020. This is according to an analysis of Redfin Estimates on more than 99 million U.S. residential properties.
From some of the news to some VIEWS you might be able to use. Global Wall St SAYS:
Paul Donovan addresses an elephant in the FOMC meeting minutes room,
The Federal Reserve minutes were anxious about the tightness of the labor market. The financial markets were anxious about the Fed’s anxiety. The weird thing is that US real wages have been breaking all records—and not in a good way. The year-over-year rate of real wage growth has been negative for 22 consecutive months. With such a collapse in living standards, the Fed’s relative focus on labor-led rather than profit-led inflation seems peculiar…
Peculiar, indeed … Unless, of course, their obsession would lead them to adopt a HIGHER INFLATION TARGET? I mention that as we’ve learned who may be nominated as new Vice Chair … via twitter,
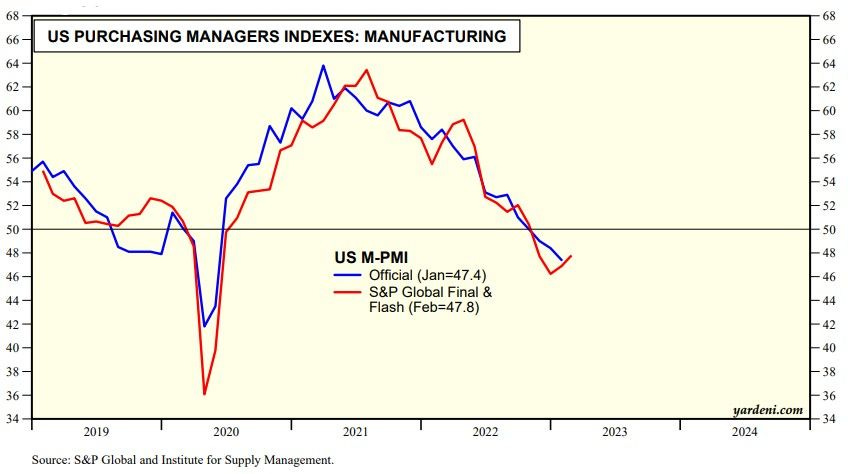
No boom, no bust. That describes yesterday's flash estimates for February's M-PMI and NM-PMI released by S&P Global. They both track the comparable series compiled by the Institute for Supply Management (ISM).
The flash M-PMI rose from 46.9 in January to 47.8 this month (chart). It suggests that the ISM's version of this index will uptick but remain below 50.0. The rolling recession that hit consumer goods manufacturers last year is probably starting to abate.
… From a technical perspective, government bond yields are finely balanced at key levels across regions and maturities, which we look to hold to maintain the rangebound environment that government bond yields have been in, roughly since December. Post a lengthy rangebound phase, we still expect yields to move lower later on in the year. However, we acknowledge that a synchronized breakout above these key levels would likely lead to another sharp repricing higher.
Firstly, the 10yr US Bond Yield is oscillating around its key December 3.91% high, with important psychological support at 4.00%. We look for this zone to hold for the development of an approximate ~3.30-4.00% range, which could persist all the way through Q2, ahead of an eventual move to 3.00% in the 2 nd half of the year. A clear break above 4.00% though would open up a retest of the October high at 4.325%, although this is not our base case.
The 30yr US Bond Yield is (just) holding below a particularly well-defined support at 3.995/4.00%, which is the December high and an important psychological barrier and we similarly look for this to continue holding.
Finally, a live look in to how debt ceiling chicken negotiations are going on The Hill right now,