(USTs are lower / STEEPER on light vols)while WE slept; USA still goin' strong; TIPS vs GOLD as 'flation hedge; longs doublin' down and some initiating new positions...
Good morning … the last week of August is likely to be a calm before the storm.
With many taking kids back to school and / or enjoying the last moments of summertime 2023 ‘down the shore’ or out at the Hamptons, the highlight of the week may very well be Jackson Hole (Friday, August 25th) …
Overnight (thanks to Harkster — more below), China did it AGAIN:
China trimmed more benchmark lending rates... 1yr Loan Prime Rate 3.45% vs est 3.4% and prev 3.55%.
Interestingly the 5yr Loan Prime Rate was not cut and stayed at 4.2% vs est 4.05%. 5yr is normally seen as a floor for mortgages, so this has certainly surprised and confused the street. Glass half full, indication something bigger to come, or glass half empty ... its pointless and we're in a doom loop so 10/15bps cuts do little... (stay nimble and let mr price speak).
Limited impact to broader assets with CNH weaker on London open (7.33) despite another fix sub 7.20. At eod the market wants fiscal, not minor cuts or managed balance reduction so another 5/10/15bps of trimming around the edges will not change the property mkt trend.
ALSO overnight, WSJs Nick Timiraos / WSJ had some words ahead of the bond markets open which caught my eyes,
Why the Era of Historically Low Interest Rates Could Be Over
Higher productivity and increased deficits could raise the ‘neutral’ rate of interest, limiting Fed cuts
By Nick Timiraos… Why the neutral rate might be rising
Analysts see three broad reasons neutral might go higher than before 2020.First, economic growth is now running well above Fed estimates of its long-run “potential” rate of around 2%, suggesting interest rates at their current level of 5.25% and 5.5% simply aren’t very restrictive…
… Second, swelling government deficits and investment in clean energy could increase the demand for savings, pushing neutral higher. Joseph Davis, chief global economist at Vanguard, estimates the real neutral rate has risen to 1.5% because of higher public debt…
… Third, retirees in industrial economies who had been saving for retirement might now be spending those savings. Productivity-boosting investment opportunities such as artificial intelligence could push up the neutral rate…
… Some economists reconcile the debate by differentiating between short-run and longer-run neutral. Temporary factors such as higher savings buffers from the pandemic and reduced sensitivity to higher rates from households and businesses that locked in lower borrowing costs could demand higher rates today to slow the economy.
But as savings run out and debts have to be refinanced at higher rates in the coming years, activity could slow—consistent with a neutral rate lower than it is now.
That in mind, I’ll turn away from a MONTHLY LOOK at 10yy (weekend) and focus on an HOURLY look at long bonds which are UP ~5bps on the day SO FAR and taking a peak at (slightly NORTH of)October CHEAPS (4.42%),
AND a daily look with recent price action highlighted and we’ll call this next one, ‘BREAKING BADLY’,
… While rates CONTINUE along with current TREND (not the equity markets or long bond BULLS friend), I would note momentum REMAINS extreme (and overSOLD) and can do so longer than I might ever remain solvent … weak hands here for sure BUT becoming bearish of long bonds here and now would strike me as, well, NOT splendid timing … Time at a price then shall be the only determinant and while we wait … here is a snapshot OF USTs as of 705a:
… HERE is what this shop says be behind the price action overnight…
… WHILE YOU SLEPT
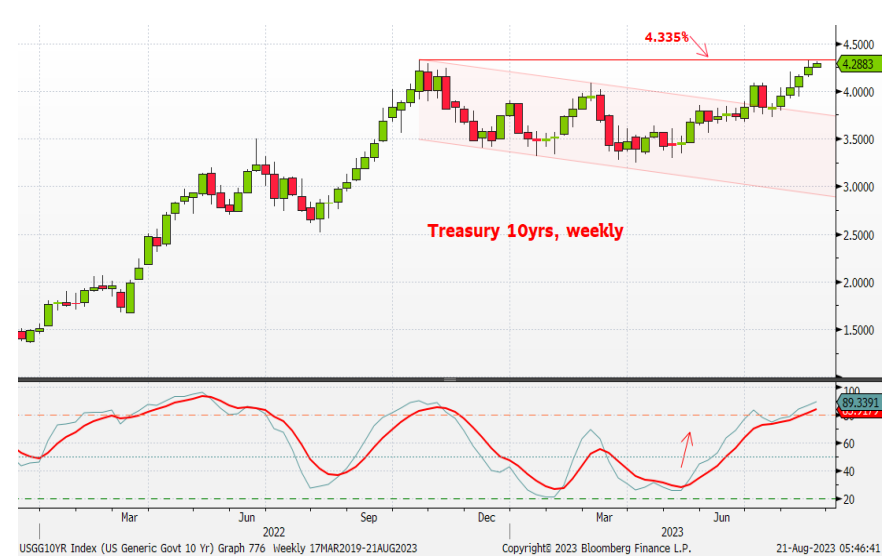
Treasuries are lower and the curve is steeper after a 'risk-on' overnight session. China's expected rate cuts disappointed (see above) while German PPI fell -6% YoY. DXY is modestly lower (-0.1%) while front WTI futures are higher (+1.1%). Asian stocks were mixed away from China (SHCOMP -1.24%, Hang Seng -1.8%), EU and UK share markets are all in the green (SX5E +1%) while ES futures are showing +0.45% here at 6:20am. Our overnight US rates flow saw a surprisingly quiet Asian trade despite another leg lower/steeper in Treasuries. In London's AM hours, client flows were again limited with better net selling/paying noted (HF's plus asset managers and banks too). Overnight Treasury volume was ~70% of average overall.… On duration, Treasury 10yr yields continue to press up against major range support derived by their move high (4.335%) established last fall. 10's are predictably 'oversold' on a medium-term basis (see lower panel) but there is scant evidence of an impending rally at this stage. Either way, the 4.335% area remains your major support level for this key benchmark.
… and for some MORE of the news you can use » The Morning Hark - 21 Aug 2023 and IGMs Press Picks in effort to to help weed thru the noise (some of which can be found over here at Finviz).
From some of the news to some of THE VIEWS you might be able to use… here’s SOME MORE of what Global Wall St is sayin’ and these are in addition TO what were noted over the weekend…
ABNAmro - Global Monthly - A softer landing – but still a landing (think GLOBALLY … and act locally … here’s rundown of entire view point…)
The major economies diverged in the first half of 2023, but overall, activity continued to expand, and inflation fell further back – albeit still well above central bank targets. Unexpected strength in the US has led us to drop our call for recession. We still expect tight monetary policy to drive a US slowdown later this year, and to continue to weigh on the eurozone. Even with rate cuts next year, tight monetary policy is likely to limit any post-slowdown rebound. Spotlight: Will we face gas shortages in Europe next winter? We take stock of the energy crisis. Regional updates: We expect prolonged weakness in the eurozone to eventually push inflation lower, while in the Netherlands we expect only modest growth following the technical recession in H1. In the US, bank lending standards are not quite as tight as we thought, but will still drive a slowdown. China's reopening rebound continues to fade, and headwinds have intensified.
ABNAmro - US - Still going strong (…and here’s what they are thinkin’ ‘bout USofA. Specifically thinking Fed’s DONE and March CUTS…)
In the US, bank lending standards are not quite as tight as we thought, but will still drive a slowdown
The US economy has exhibited remarkable resilience over the past half year. We no longer expect a recession, but still expect a slowdown, which eventually will bring inflation back to 2%
The Fed’s latest Senior Loan Officer Opinion Survey suggests bank lending standards may not be quite as tight as they seemed. This may help explain part of the recent resilience in the economy
We continue to think interest rates have peaked, with rate cuts to start next March
MS - Global Economic Briefing: The Weekly Worldview: Still Scaling Mountains? - A Jackson Hole Preview (inquiring minds wanna know … Seth happy to throw the dart for us all and here’s what HE thinks he thinks…)
This week is the Jackson Hole meeting, coming on the heels of the Fed minutes … what's in store?
Next week is the Fed’s annual Jackson Hole conference on monetary policy. The title this year is “Structural Shifts in the Global Economy.” While Fed Chairs have sometimes moved markets at Jackson Hole, I suspect Powell will not signal a major shift. Rather, I suspect he will try to: keep a hawkish tone; reiterate commitment to 2 percent inflation; reinforce the “higher for longer” theme; but refrain from giving explicit near-term guidance.
The title of the symposium suggests some discussion of the neutral rate of interest, also called r*. Conceptually, if the policy rate is above r*, then monetary policy is slowing the economy, and if the policy is below r*, it is stimulating the economy. More generally, r* should have implications for debt sustainability, the level of the yield curve, and other asset prices. But in the best of times, estimating r* is hard; in a post-Covid world, it is doubly so.
MS - Sunday Start | What's Next in Global Macro: Risks of a Debt-Deflation Loop in China (given another rate CUT overnight … thought this worth at least noting)
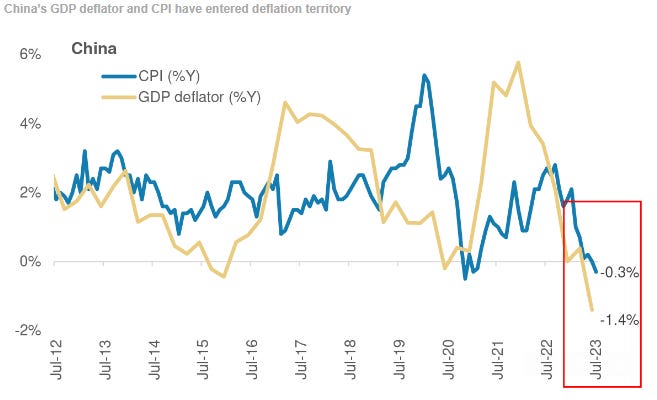
China is facing risks from the 3Ds of Debt, Demographics and Deflation. China’s debt/GDP ratio has risen sharply, by ~30pp since Covid to 300% of GDP in 1Q23. Long-term demographic trends are crimping the labor force and thereby potential economic growth. Deflationary pressures are widespread in the economy, exacerbated by deleveraging in the property sector and local government financing vehicles, which together account for ~70% of GDP; the GDP deflator fell to -1.4%Y in 2Q23, despite higher-than-target inflation in the rest of the world.
For now, demographics are predetermined, so to understand how Beijing policymakers might delever the economy without pushing it into a debt-deflation loop, we analyzed past deleveraging episodes in other economies around the world …
… Our base case remains that China avoids a debt-deflation loop. But if not, China’s economy would face a prolonged period with rising debt/GDP ratios despite slowing debt growth. Persistent deflation would weigh on nominal GDP growth, slowing corporate revenue growth and making all debt service harder. Declining corporate profits would push the private sector to cut back on investment and slow wage growth. With weaker consumption and especially investment growth, the decades-long rise in Chinese per capita income in USD terms would stagnate.
Late last year, we were bullish on China’s growth prospects, but warned that the spillovers to the rest of the world would be limited. The reverse is not true: if China slips into a debt-deflation loop, it would be a disinflationary force for the rest of the world via trade, commodity prices and currency movements. Weakening in investment would hurt demand for exports from China’s key trading partners, with Asia and Europe most exposed. And China’s exports of manufactured goods, especially if accompanied by a significant currency depreciation, would spread disinflation globally.
The key to China's macro outlook is its fiscal policy over the coming weeks and months. Until we get a significant easing in fiscal policy, the economy is likely to lose momentum and raise the risks of a debt-deflation loop.
UBSs Paul Donovan - UBS Morning audio comment: More deflation (catchy title)
China cut its one year loan prime rate, but less than markets had anticipated. For those bewildered by the plethora of policy tweaks in China, it is best to look at the bigger picture. China is easing policy, but the focus may be on supporting rather than stimulating consumption—lowering costs for existing borrowers more than encouraging stronger credit growth.
German July producer price inflation is expected to record year-over-year deflation. Remember this measure says as much about the level of prices a year ago as it does about the level of prices today, but the general trend is for reduced inflation pressures.
Central bank policy is in focus ahead of this week’s Federal Reserve Jackson Hole summer camp. Will we get profound insights into economic philosophy from Fed Chair Powell or ECB President Lagarde, between intervals of roasting marshmallows on the camp fire? It seems unlikely.
China is reported to want to establish an emerging market multinational group to rival the G7. Aside from questioning whether large multinational gatherings serve any purpose (would anyone care if the G20 were abolished?), there is a larger challenge. Structural upheaval in the global economy will encourage scapegoat economics, prejudice politics, and economic nationalism. That increasingly challenges collaboration.
AND for those technically minded and visual learners out there, this first item (AllStarCharts) inspired by BBG story where some are DOUBLING DOWN on longs,
Bloomberg - Bond Bulls at JPMorgan, Allianz Keep Piling Into a Bet Gone Bad
And with THAT in mind,
AllStarCharts - The biggest question I have right now (questions but no answers? well, surprisingly enough there ARE some answers offered — listen to what they say and WATCH what they do? … nibble nibble …)
Are we all just going to assume that these consolidations in interest rates are about to resolve higher?
Seems like everyone around me considers this breakout to be foregone conclusion:
I don’t quite see it that way.
You know what happens when you Assume: You make an Ass of U and Me.
I don’t assume anything.
I need to see it first.
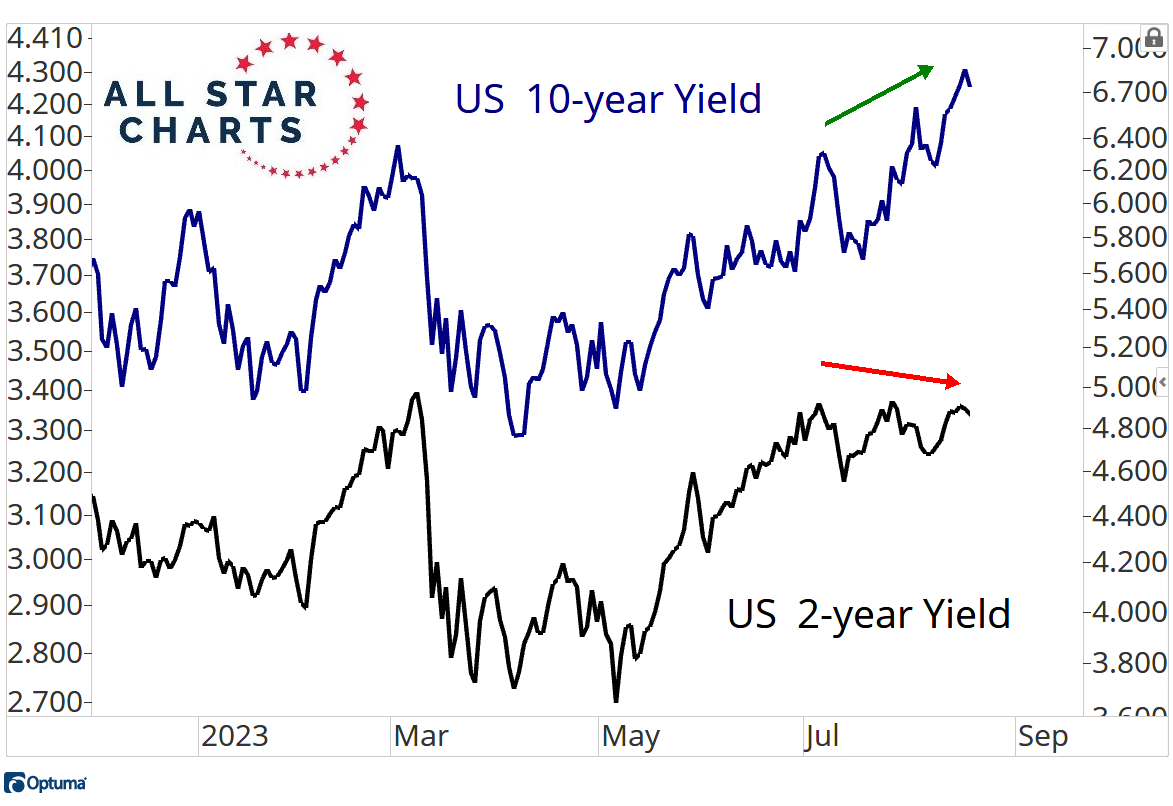
Meanwhile, how about the 2yr yield rolling over already while all eyes are focused on the 10yr yield making new highs?
2s have been a great leading indicator.
Is that going to change now?
I don’t know. I don’t think so.
And since I definitely don’t know what the market is going to do next, all I can do is look for clues and try to ask the right questions.
That’s what I’m doing here.
Are interest rates definitely about to break out?
Or is now finally the time to buy bonds?
I started to nibble a bit on Friday. Let’s see what kind of follow through, if any, we get this week, before adding to positions.
As far as the stock market is concerned, nothing could be better for the S&P500 than the bond market stopping its collapse.
With bonds falling, renewed pressure is being put on Tech stocks…
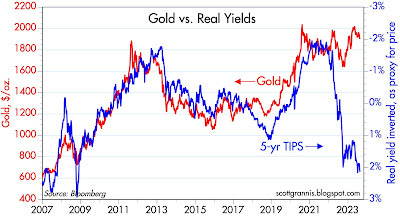
Calafia Beach Pundit (Scott Granis) - TIPS vs Gold: which is the better inflation hedge? (I’m just grateful he didn’t add BITC into the mix … my fear of the known)
TIPS and gold are widely considered to be classic inflation hedges, but they couldn't be more different. TIPS (Treasury Inflation Protected Securities) look far more attractive than gold these days, since they are not only an inflation hedge but also a deflation hedge and a hedge against an economic slowdown or recession.
… Gold is expensive. Chart #1 shows the inflation-adjusted price of gold from 1913 through today. Gold was worth about $19/oz back in 1913; in today's dollars that would be about $600/oz as shown in the chart. From an historical perspective, gold is pretty expensive. Today it is only about 20% below its all-time high in today's dollar terms (~$2400/oz in 1980), and it's up some 580% from its all-time low (~$280/oz in 1970). Over the past 110 years, gold in today's dollars has averaged about $780/oz. It'w worth 140% more than that today.
Chart #2
Chart #3
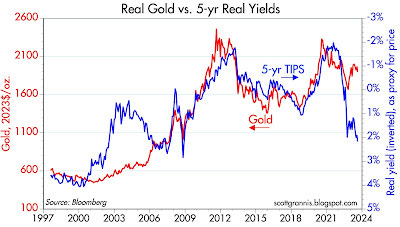
Real yields tend to track gold prices. As Charts #2 and #3 show, TIPS and gold prices tend to move together—but not all of the time. Chart #2 compares the prices of 5-yr TIPS (using the inverse of their real yield as a proxy for their price) to the prices of gold in today's dollars. Chart #3 uses a shorter time frame and nominal gold prices instead of real gold prices. Chart #2 starts in 1997 because that's when TIPS were first introduced…
… TIPS are cheap, given the high level of real yields which in turn are driven by tight Fed policy. The Fed is tight because they want inflation to fall. But as I've been pointing out for the past several months, inflation is falling and is very likely to continue to fall; by some measures it's fallen well into the range that should make the Fed happy. The Fed and the market seem to be overlooking this key fact, but sooner or later it will become blindingly obvious that inflation has been tamed. That should prompt the Fed to ease, and real yields to fall, thus boosting TIPS prices…
… Conclusion: Gold is exposed to the threat of high real rates and the likelihood that inflation will soon fall to the Fed's target, if not lower. TIPS are a deflation and recession hedge because either event will force the Fed to ease, thus lowering real rates and boosting TIPS prices. TIPS are an attractive and guaranteed inflation hedge since they offer a government-guaranteed real yield in addition to having their principal continuously adjusted for inflation.
Interesting food for thought … Meanwhile, equity futures are BID and so, a ‘toon from a couple weeks ago which may come back en vogue if/when rates start to matter again … which they are NOT yet but,
Market Bulls Struggle In August, Bears Rejoice As Stock Rally Takes A Summer Break!
AND on THAT note, until RATES start to matter again, well … THAT is all for now. Off to the day job…





Going to quote Rabobank's Mike Every (who doesn't post in ZH nearly as often as he once did), (paraphrasing): war, defense, and infrastructure spending equals-higher rates for Longer. And less ZIRP, QE, MMT". Speaking of Inflation, silvers overtaken gold of late. Some argue silver's an 'inflation' indicator like Dr. Copper now. Whether industrial or monetary, always good to have some Silver, imo. For the Werewolves if nothing else lol!
PS-I nibbled on some longer duration US Gov debt in my 401K myself last wk lol! And Lance at RIA doubled his long bond exposure, and is looking to add more!