(USTs are lower on STRONG volumes)while WE slept; China news was MIXED while Goldilocks predicts, well, a Goldilocks economic outcome while others are less 'optimistic'
Good morning … some ‘GOOD’ news while US markets were closed for the holiday,
Reuters: China's Country Garden dodges another default in relief for property sector
ZH: Chinese Property Stocks Soar After Latest Beijing Support, Country Garden Debt Deal
AND some less ‘good’ news,
CNN: China’s services activity falls in August to its lowest level in eight months
S&P Global: China PMI signals further slowdown in August, prices edge higherService sector revival continues to fade
The deteriorating performance was fuelled by a further weakening of growth in the service sector, which suffered a further significant loss of pace in August to register the smallest monthly increase in activity since the recovery began in January. In contrast to the resultant modest expansion seen in August, the service sector's growth earlier in the year had been among the strongest recorded by the survey over the past decade. Although new orders for services continued to rise, the August gain was the second-smallest recorded over the past seven months to hint at weakening demand growth.There was a somewhat more encouraging picture in manufacturing, where output returned to growth after a brief slide into contraction in July. The overall expansion of factory output nonetheless remained subdued. New orders received by factories likewise returned to modest growth, though export order continued to fall to act as an ongoing drag on the goods-producing sector, resulting in yet another disappointingly subdued overall order book performance.
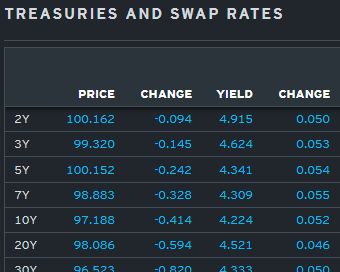
And so … here is a snapshot OF USTs as of 655a:
… HERE is what this shop says be behind the price action overnight…
… WHILE YOU SLEPT
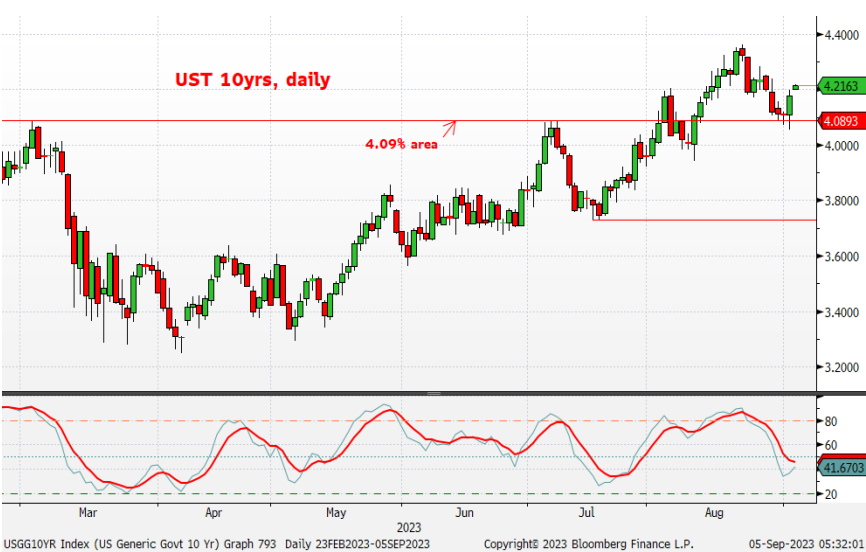
Treasuries are lower with the curve steeper out to the 7yr point this morning after a busy overnight session of data releases and events (see bullets above). DXY is higher (+0.35%) while front WTI futures are lower (-0.5%). Asian stocks saw Chinese shares give back some of Monday's stimulus-fueled gains (CSI 300 -0.74%), EU and UK share markets are mixed this morning while ES futures are showing -0.1% here at 6:45am. Our overnight US rates flows saw mixed flows (intermediates out to bonds) and below-average (~80%) volumes during Asian hours. We also saw better paying interest in the belly from real$ names with fast$ better sellers of belly spreads and active in the 'flys too (better payers of 2s5s10s and receivers of 5s10s30s). Overnight Treasury volume was decent at ~120% of average overall- hinting of a pick-up in flows during London's AM hours.… First, on Friday Treasury 10yr yields made a third straight daily attempt to push and hold below their 4.09% area resistance area, failing to breakout yet again while rejecting the resistance level by last week's close. The 4.09% level was the March move high and also July's high yield print- so it's an important former range high that 10's appear reluctant to hurdle back below at this stage.
… and for some MORE of the news you can use » The Morning Hark - 05 Sept 2023 and IGMs Press Picks (who CONTINUES to be sportin’ that new, fresh look) in effort to to help weed thru the noise (some of which can be found over here at Finviz).
From some of the news to some of THE SELLSIDE VIEWS you might be able to use… here’s SOME MORE of what Global Wall St is sayin’ and these are in addition TO what were noted over the weekend…
ABNAmro - China - Services-manufacturing gap closes (news o/n matters)
China Macro: Manufacturing PMIs improve in August. The gap between services and manufacturing is closing…
… The biggest positive surprise came from Caixin’s PMI, which rose by almost two full points to 51.0 (July: 49.2, consensus: 49.0). The official manufacturing PMI published by NBS also came in stronger than expected, but at 49.7 (July: 49.3, consensus: 49.2) remained slightly below the neutral 50 mark separating expansion from contraction. The PMI survey from NBS is larger than Caixin’s one (samples of around 3200 and 650 firms, respectively), and has a stronger focus on the larger state-owned firms, whereas Caixin’s survey focuses more on private and export-oriented firms.
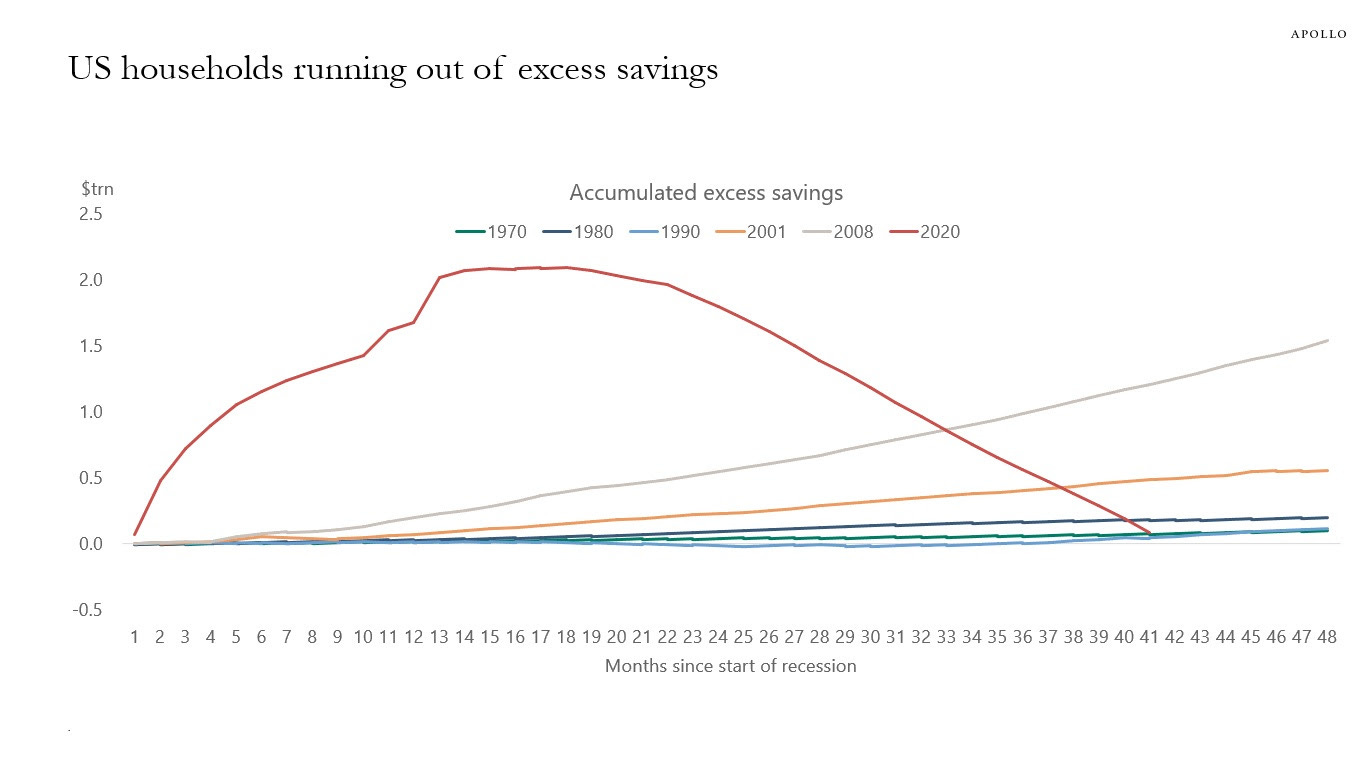
Apollo - Households Running Out of Pandemic Savings (Ruh roh, RelRoy)
We have updated our estimates of how much excess savings households have left using the Fed’s methodology, and the conclusion is that consumers are almost out of pandemic savings, see chart below.
DB - Thematic Research - Mapping Markets: How the economy looks increasingly late-cycle (hard landing, then it is?)
Markets put in a strong performance last week, mainly thanks to growing hopes about a soft landing for the economy.
But the problem is, if various growth and labour market indicators keep weakening, then something that looks like a potential soft landing will eventually turn into a hard landing.
Indeed, despite all the positive headlines, several data releases from the US and Europe were consistent with late-cycle dynamics and a growing likelihood of a near-term recession…
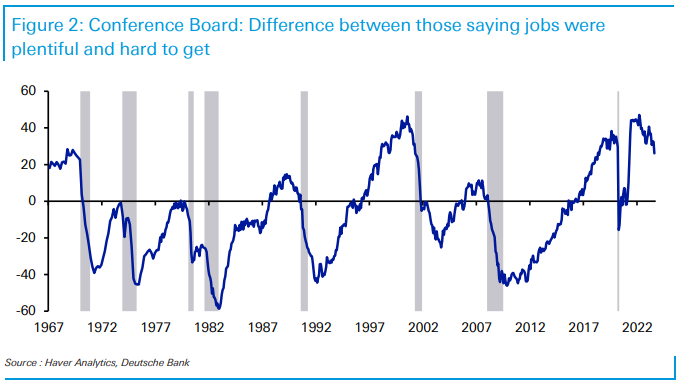
… 2. Data from the Conference Board showed the difference between those saying jobs are “plentiful” and “hard to get” turned down even further, in a manner consistent with previous recessions.
As the chart shows, normally the pattern is this measure peaks at the end of the cycle, before turning down into the recession. It has now clearly peaked and is turning down. Admittedly, it started from an all-time high in March 2022, but the speed of the downturn over recent months is concerning when it comes to the state of the economy.
… Conclusion
It would be great if the economy could avoid a hard landing, but it seems prudent to avoid any celebrations just yet. After all, if the economy does experience a hard landing, we would expect to see the leading indicators turn down in exactly the way that the above charts show. Remember as well that all of variables discussed were released in the last week alone, and they are consistently echoing other prerecession periods.Goldilocks - US Daily: Updating Our CPI Forecasts to Reflect Changes to the Health Insurance Methodology (this is NOT the report everyone will be talkin’ about round the virtual water cooler but…)
The Bureau of Labor Statistics (BLS) recently announced changes to its methodology for measuring the cost of health insurance. Under the new methodology we expect the health insurance component to swing from -4% per month to +1% per month starting in October before slowing to 0% per month starting in April 2024.
The BLS is implementing two main changes that address separate issues with the current methodology. First, the BLS is switching from a one-year moving average of the underlying data to a two-year moving average in order to dampen its volatility. Second, the BLS is switching from an annual version of the main underlying data to a semiannual version in order to reduce the lag between the underlying data and the CPI index by six months.
Our PCE inflation forecasts are not impacted by the methodological changes to CPI health insurance, as the PCE price index uses different source data to measure health insurance costs.
Goldilocks - Global Views: Soft Landing Summer (this is THE report folks are gonna be talkin’ about but…)
We have further reduced our 12-month US recession probability back to 15%, from 20% previously. This change reflects continued encouraging inflation news, a favorable real income outlook, and the decline in the jobs-workers gap to just above its pre-pandemic level. The Fed and its DM peers are set to cut rates by less than markets expect, both because the neutral rate should settle above the post-GFC norm and because activity remains resilient. In contrast, China faces both short- and long-term challenges from its property market and demographic outlook. While a "sudden stop" remains unlikely, we see risks of a more persistent Japan-style slowdown.
Goldilocks - US Economics Analyst: The US Consumer: Still Strong in 2024 (this is NOT the report we will be talkin’ about but…)
GDP growth has outperformed in 2023 on the back of strong consumer spending, itself driven by an acceleration in real income growth to around 4% (Q4/Q4 basis; GS forecast). Whether spending continues to grow at a robust pace depends heavily on the income outlook, so in this US Economics Analyst we update our income forecasts and argue that the US consumer will likely outperform again in 2024.
Several of the drivers of income growth in 2023 are likely to repeat in 2024. Continued job gains and positive real wage growth should continue to boost real income, and household interest income should increase as yields on interest bearing assets rise to reflect past rate increases. And while transfer income faces a headwind from declining Medicaid coverage following the end of pandemic-related eligibility expansion, the spending impact from coverage loss will likely be modest.
After incorporating these drivers into our forecast, we expect real income will grow by 3% in 2024 on a Q4/Q4 basis. While this pace of income growth would normally imply 2-3% real spending growth, the spending response will likely be smaller than normal because some drivers—namely rising interest income—will mostly benefit higher-income households that have a lower propensity to spend. Indeed, we forecast almost 4% real income growth for households in the top income quintile, vs. 1½% in the bottom quintile…
… Taken together, we expect that income growth will remain a tailwind to spending in 2024, albeit a smaller one than in 2023. Provided that job and real wage growth don’t significantly underperform our forecasts, we expect that the US consumer will outperform consensus expectations, and forecast 1.9% real spending growth in 2024 in both yoy (vs. 0.9% consensus) and Q4/Q4 (vs. +1.2%) terms.
… indeed, there are a few preliminary signs that rising interest expenses are creating some stress on household finances. Delinquency rates on subprime auto loans—which are primarily held by lower-income borrowers—have overshot their pre-pandemic levels, although delinquency rates on prime auto loans and credit cards—which are held more broadly and therefore more indicative of financial pressures on the broader US consumer—remain below their pre-pandemic levels.
Morgan Stanley - Sunday Start | What's Next in Global Macro: It's All About Price (here Mike Wilson laid out case for his weekly ‘kickstart’)
In a world of price momentum, opinions about the fundamentals are often driven by the direction of price. Some of this is due to the view that markets are "all-knowing" and often the best leading indicator for the fundamentals. After all, stocks are discounting machines; they tell us what is likely to happen in the future rather than what is happening today. The old adage "buy the rumor, sell the news" is another way to think about this relationship. Using this philosophy, the move higher in stocks this year has provided the confidence for many to turn fundamentally bullish from what was an overly bearish consensus backdrop in early January. The entire move in the major US equity averages this year has been the result of higher valuations. However, with forward P/Es reaching 20x on the S&P 500 last month, stocks are not only anticipating higher earnings and growth, but now also require it, in our view. The other reason why price momentum works has little to do with the fundamental outlook. Price momentum often leads asset managers and individuals to chase or sell the momentum itself. It’s human nature to want to go with the trend, whether up or down. Think back to last fall when negative price momentum forced many investors to sell at exactly the wrong time. This is how lows, and highs, are made...
… Equity prices have rebounded sharply in the past week, led once again by growth stocks. With softer economic data weighing on Treasury yields, stock market participants seem willing to bid valuations back up on the view that the late-cycle environment is being extended once again. With inadequate evidence to affirm or contradict that view, price remains the governing factor for many investors’ conclusions about where we are in the cycle. Bottom line, price momentum is a key driver of sentiment, especially in a late-cycle environment, when uncertainty about the outcome is high. We continue to recommend a more defensive growth posture in one’s portfolio given that growth fears or financial stress could return at any moment in a late-cycle environment, particularly as we enter September.
Underlying price action is not supportive of the expected growth re-acceleration
Morgan Stanley - US Equity Strategy: Weekly Warm-up: It's All About Price—Part 2 (… and he continues…)
Late in the cycle when the data is conflicting, sentiment can be influenced by stock prices more than usual. We think the pendulum swung too far this summer and that a risk-off complexion is likely with us in September. We recommend defensive growth; within cyclicals, we prefer Industrials.
Yardeni - Market Call: September Isn't Always A Bad Month For Stocks (of course not)
September is the Rodney Dangerfield of the 12 months; it gets no respect because it has been the worst month for stocks on average since 1928 (chart). However, it has been up 45% of the time since then with a solid average gain of 3.2%. Even if the market is down this month, September is a good month for picking apples and it could be a good month for picking stocks.
… AND a couple / few things from the intertubes which caught MY eyes since I’ve stepped away for couple days,
Bloomberg (via ZH): US Stock-Bond Ratio Poised To Keep Downward Bias (I spy with my little eyes, bonds with slight edge?)
Authored by Simon White, Bloomberg macro strategist,
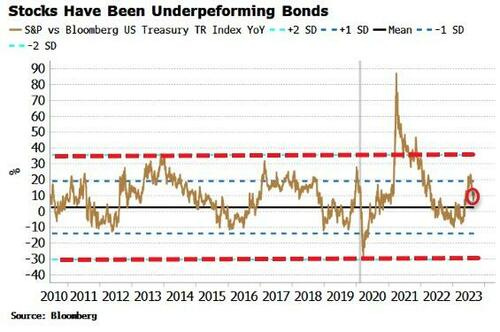
The growth in the US stock-bond ratio is poised to keep falling, but yields on nominal and inflation bonds both bouncing from very oversold levels are likely to be choppy.
It’s generally a frustrating time after big moves as markets take time to settle down, and a new clear, tradeable trend becomes apparent. We are in one of those periods now, but yields should have an overall downwards bias, enough to keep pressure on the stock-bond ratio.
I highlighted a couple of weeks ago that stocks were on the overbought side versus bonds, and we may see a reversal. Since then the annual change of the stock-bond ratio has fallen from its one standard-deviation level.
Equities have run into some resistance around the 4500 level on the S&P. Countervailing forces from rising recession risks and a Fed still drumming the “higher for longer” mantra will conspire to keep equities in a range until the logjam is broken.
Bonds, though, may have a slight edge as they bounce from very oversold levels.
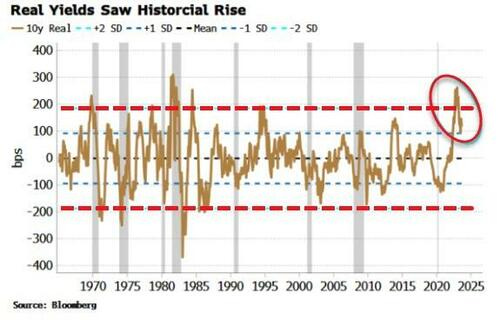
Real yields’ rise at the beginning of 2023 was close to the sharpest they had experienced in over 50 years. Their annual rate of change subsequently fell, but then has bounced again over the last few weeks.
Historically when moves have been very extreme it can lead to periods of choppiness in the breaks of the overall normalization trend. And even though real yields are less overbought, they are still stretched to the upside, meaning in the medium term they should have a downwards bias.
It’s similar for nominal yields. They are less overbought than they were, and face choppiness, but they should have an overall downwards bias in the longer term.
Moreover, as volatility settles down, +4% yields will look increasingly attractive to many buyers – leveraged and unleveraged – especially if recession risks are perceived to be rising (even though investors should not assume the usual investment rules apply in inflationary recessions).
HedgOpia - 10-Year T-Yield Retreats From Dual Resistance, Bond Bears, Sitting Smug On Tons Of Shorts, Face Squeeze Risks
The 10-year yield retreated last month from a potentially crucial spot. The supply-demand dynamics are in favor of bond bears, but this is also a well-known fact, hence may already be in the price. They at the same time are sitting on boatloads of shorts, facing squeeze risks.
The 10-year treasury yield failed an important test last month. In three of the four sessions through August 22, rates crossed 4.3 percent – both intraday and close – with an intraday tag of 4.36 percent on the 22nd…
In the futures market, non-commercials similarly are stuffed in net shorts in 10-year note futures to the gills. In the latest week, which is as of last Tuesday, they held 805,553 contracts, which is merely 5.6 percent from the record high 850,421 registered in the week to May 30 this year (Chart 6).
Most recently, these traders have shown aggression since the week to July 25 when they held 623,771 net shorts; the 10-year yielded 3.91 percent in that session, subsequently rallying to the afore-mentioned 4.36 percent by August 22. So, in the aggregate, they have done well. But, since that high, rates have come down.
Non-commercials’ mettle will be tested once four percent is breached on the 10-year. Odds favor they will begin to cover/cash in profit once this unfolds.
Hope you had a nice holiday LONG weekend and a GREAT summer … is it just ME or did summer fly by and end with a BANG not unlike that of the RU cannon at Sunday afternoons game … after EVERY. SINGLE. SCORE … like this one where the kick was UP … and, GOOD …
making the score 24 - 0 and … what a great day for a BIG10 game!! A butt in every one of the 45k+ seats!! AND …
AND … THAT is all for now. Off to the day job…






Having just got my GoPro going in May, nice camerawork bud-field level I luv it! The left coast out here is where College Football goes off to die (PAC-!2 looking at YOU!), unless you're USC/UCLA and can escape to the Big 10 Conference!
Any chance that's a 'Head & shoulders' pattern on that Hedgopia Chart 1 of the 10 yr? I recognize that'd be a Beattljuice sized head LOL always loved that movie! I was 16 now I'm 52 ouch!