weekly observations (week of Sept 5th); NFP recaps and victory laps; "Inflation Is Still a Problem" -Slok; "Not since 1787” (BAML)
Good morning / afternoon / evening - please choose whichever one which best describes when ever it may be that YOU are stumbling across this weekends note…
First UP lets deal with a couple / few things NFP related, from the world wide web, and as I go through all of this I’ve got to say I may have more questions than answers.
There seems to have been something for everyone … a MIXED report, then, will allow one to visit whichever ‘narrative marketplace’ one wants.
Personally, I’m stuck on watching ‘flation (EARL) and having a hard time seeing the Fed as DONE and appreciate all those who vehemently believe that is the case.
In fact, I’ll likely spend as much / more time reading those items which I may not fully appreciate so that I can more refine a view.
In the meanwhile, I’m going to be stuck on CHARTS and while 10s seem to be a ‘SCREAMIN’ BUY’ to some (all opinions are created equally but the ‘SCREAMIN’ BUY’er’s opinions are more equal than others) and yet … they struggle.
DAILY momentum appears to be overBOUGHT while WEEKLY momentum is just the opposite — overSOLD — and at the same time, prior ‘triangulated’ TLINES continue to exude some influence (perhaps only on MY thinking and view) … If / when 10yy break back down convincingly, well, I’ll be much more impressed … for now, we’re going to need MORE than a MIXED NFP report.
On that note, a few items from the intertubes,
Academy Securities (via ZH) - "If Anything, The Data Is Almost Weak Enough To Spur Recession Fears..." (interesting … as the narrative has turned — meet the NEW narrative, same as the OLD where bad is back to good?)
If not Goldilocks, this report should help treasury yields go lower (nice short squeeze opportunity) which in turn, should push risk assets higher.
Barely any jobs created, but jobs nonetheless.
The Establishment survey had 187k jobs, but that came with downward revisions of 110k, so a mediocre total of 77k jobs – too few to make the Fed hawkish and enough that we don’t have to price in recession risk – yet.
The Unemployment Rate went higher for all the right reasons.
The Household survey actually added 222k jobs, but unemployment went from 3.5% to 3.8% because the labor participation rate went to 62.8% from 62.6%. That is the highest since the pandemic and is the first time since the pandemic that we have higher labor participation rates than we did in much of 2018!
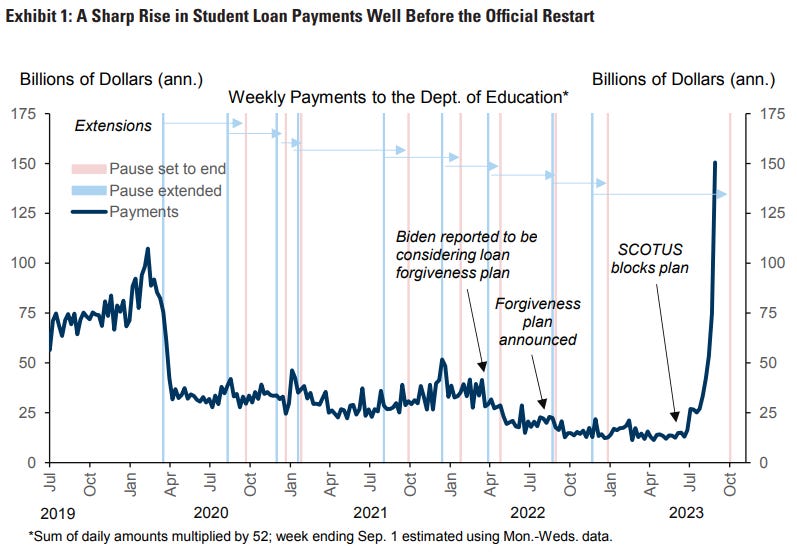
Maybe the impact of student loan payments restarting won’t be a slowing economy, but more people seeking jobs? (ironically just as they become more difficult to find).
Average earnings dropped back down to a manageable 0.2% for the month (despite headline after headline of the strong position labor is in during wage negotiations)
Average hours ticked up slightly, to 34.4, which is good in that it is ticking back up, but it is still well below what we saw in 2021 and early 2022.
I’m biased, as I’m currently long bonds and long risk, but I think today’s number is perfect for that and think we could squeeze nicely into a new month!
If anything, the data is almost weak enough to spur recession fears, but I don’t think there is enough in here for that, and the reality is the Fed must be jumping up and down with joy about the unemployment rate – not just that it moved higher, but that it moved higher for all the right reasons!
BigPicture - Unemployment Up 0.3% = Fed on Hold (for now? some fightin’ words from Barry, though, IMO … i’m just jealous cuz MY crystal ball still not back from dry cleaners … )
The Fed is done….
BondDadBlog - August jobs report: deceleration shows up in spades (so, bad news remains good? askin’ for a friend)
CalculatedRISK - August Employment Report: 187 thousand Jobs, 3.8% Unemployment Rate (for some of the data without the ZH snark/spin)
CalculatedRISK - Comments on August Employment Report
Discipline Funds - The Labor Market – Goldilocks or Golden Guillotine?… Speaking of wages – the clear downtrend in wages continued in this report with average hourly earnings coming in at 4.5%. This is still way too high for the Fed’s comfort, but this data tends to lag pretty substantially as wages are “sticky”. The recent data from the JOLTS report showed a large decline in quits and that tends to lead wages. We expect wages to continue their downtrend towards 3% over the coming year.
FirstTrust - Data Watch - Nonfarm Payrolls Increased 187,000 in August
Continued improvement in the labor market, but with plenty of ammunition for the Federal Reserve to skip a rate hike in September…The Fed is probably looking for wage growth to slow to 3.0 - 3.5% before they get comfortable with a 2.0% inflation forecast. The Fed is now very likely to skip September, but we think markets are underestimating the odds of a (potentially last) rate hike in November. We expect continued job growth for the next few months, but also foresee a weakening and recessionary labor market starting late this year or in early 2024.
Wells Fargo - August Employment: More than a Participation Trophy (but then, you read the note here and seems to ME like … just that. EVERYONE wins, EVERYONE gets a trophy … here we are back to 7U rec soccer when I thought those days had left me)
… With the labor market more clearly moving back into balance, further Fed rate hikes seem unlikely in our view. However, with the labor market still tight and wage growth elevated, we expect rate cuts remains a ways off…
WolfST: Labor Force Spikes, Wage Pressures Stuck at High Levels, Job Market Sorts Out the Distortions from the Pandemic
ZeroHEDGE - Unemployment Rate Unexpectedly Surges As BLS Revises Payrolls For Every Month In 2023 Sharply Lower (hmmm, maybe Barry is right and, so then is BMOs Ian Lyngen — 10s a SCREAMIN’ BUY?)
ZeroHEDGE - Inside Today's Disastrous Jobs Report: 670K Full-Time Jobs Lost In 2 Months Vs 1 Million Part-Time Surge; Worst Unadjusted August Payrolls Since Great Recession (worst EVER … per this writeup, bonds are a SCREAMING BUY? askin’ for a friend…)
… Ok I’ll move on AND right TO the reason many / most are here … some WEEKLY NARRATIVES where I’d note a couple / few things which stood out to ME this weekend … A couple / few NFP recaps and victory laps … AND
BAMLs Flow Show, “Not since 1787” (USTs on course for 3rd consecutive loss…)
Barclays rates weekly, data show SOME easing labor mkts BUT payroll proxy posts strong gains SO … stay SHORT 2s
BMO - NFP +187k, UNR +0.3 pp, -110k revisions - TSY rally (and weekly note suggests getting LONG 10s cuz, you know, they are ‘SCREAMIN’ BUY’)
…Monetary policy implications are relatively straight forward -- it just got a lot harder to justify a hike in Q4. September is off the table; even if there is a modest upside surprise in the August CPI series. For now, we're content to chase the rally in Treasuries ahead of the long weekend. While SIMFA might disagree, we're recommending an early close. From here, ISM at 10am will mark the final fundamental input for the week as investors ready for Labor Day.
JEFF - August Employment QuickTake: Solid Payrolls Despite Yellow BK; Unemployment Up for Good Reasons (SOLID … URATE up for all the right reasons and …)
… The wage data is on the softside. Hours worked increased 0.1, which put some downward pressure on AHE. AHE rose 0.237% m/m, so it may have rounded up to 0.3 ppts if it were for the workweek. But this is splitting hairs, wage growth slowed a little bit this month following a string of 0.4% increases in 3 of the prior 4 months…
… Household Survey: The household survey showed an increase in the unemployment rate to the highest level since January 2022, 0.3% to 3.8%. This comes as 736K people entered the labor force; 222K entered with a job, and 514K came in looking for one. This is very encouraging in terms of finding some slack in the labor force to cool wages, but it is hard to see how much more participation can increase from here given demographic trends.
Goldilocks note on STUDENT LOAN REPAYMENTS worth a look (you tell ME how this visual represents a ‘soft landing’ or a good outcome for Fed, the Hobbit and Biden?)
… Interest Rate Watch: What Is the Yield Curve Saying about Recession?
… Another approach is to look at curve shape in the shorter part of the yield curve. The logic for using this method is relatively straightforward and was perhaps laid out best by Chair Powell back in March 2022. Powell said "there's good research by staff in the Federal Reserve system that really says to look at the short – the first 18 months of the yield curve...It makes sense. Because if it's inverted, that means the Fed's going to cut, which means the economy is weak."
… Perhaps the FOMC will be able to execute a soft landing, gradually reducing the federal funds rate back to a more neutral level over the next couple of years amid a still expanding U.S. economy. More likely, in our view, is that a recession will prevail in 2024.
Moving along and away FROM highly sought after and often paywalled and Global Wall Street narratives TO a(nother) few other things widely available and maybe as useful from the WWW
AllStarCharts - Bonds Pull Back (weren’t these guys repeatedly trying to buy got burned one too many times — hey, i feel ya, been there done that — and now … saying … they told us so? NOPE, even better … despite all the good price action, they still don’t like buyin … likely going to wait for even MORE bullish price action when most institutional bond jockeys will likely be ready to SELL to the ASC team … FANtastic … )
US Treasuries have stopped falling – for the moment.
But it’s a mixed bag.
Short setups for long-duration bonds remain in play despite pullbacks underway, while the shorter end of the curve never managed to break down.
It’s messy.
So, let’s run through
the US
Treasury futures for an updated read on the bond market.
First up is the 30-year T-bond:
The 30-year has broken below a shelf of former lows at approximately 123. It’s a short as long as it’s below that level with a measured target of 113’15.
But the 30-year is finding support at last year’s lows, bouncing higher toward our line in the sand.
Pullbacks such as this are common. And last year’s low marks a logical area for buyers to support price.
Nevertheless, the breakdown remains intact as momentum holds within a bearish regime after recently hitting oversold conditions.
Moving down the curve…
The 10-year T-note doesn’t exhibit an overly bearish outlook:
Price is back above a shelf of former lows and our breakdown level.
A pullback of this nature could be nothing more than a hard retest (a close back within the pattern in question) that leads to a re-completion of the bearish consolidation.
On the other hand, it could also become a failed breakdown, resulting in a speedy upside reversal.
It’s important to note that momentum remains within a bearish regime but failed to post an oversold reading on the most recent leg lower.
If you want to short the 10-year, it must trade below 110’13. It’s off-limits until then.
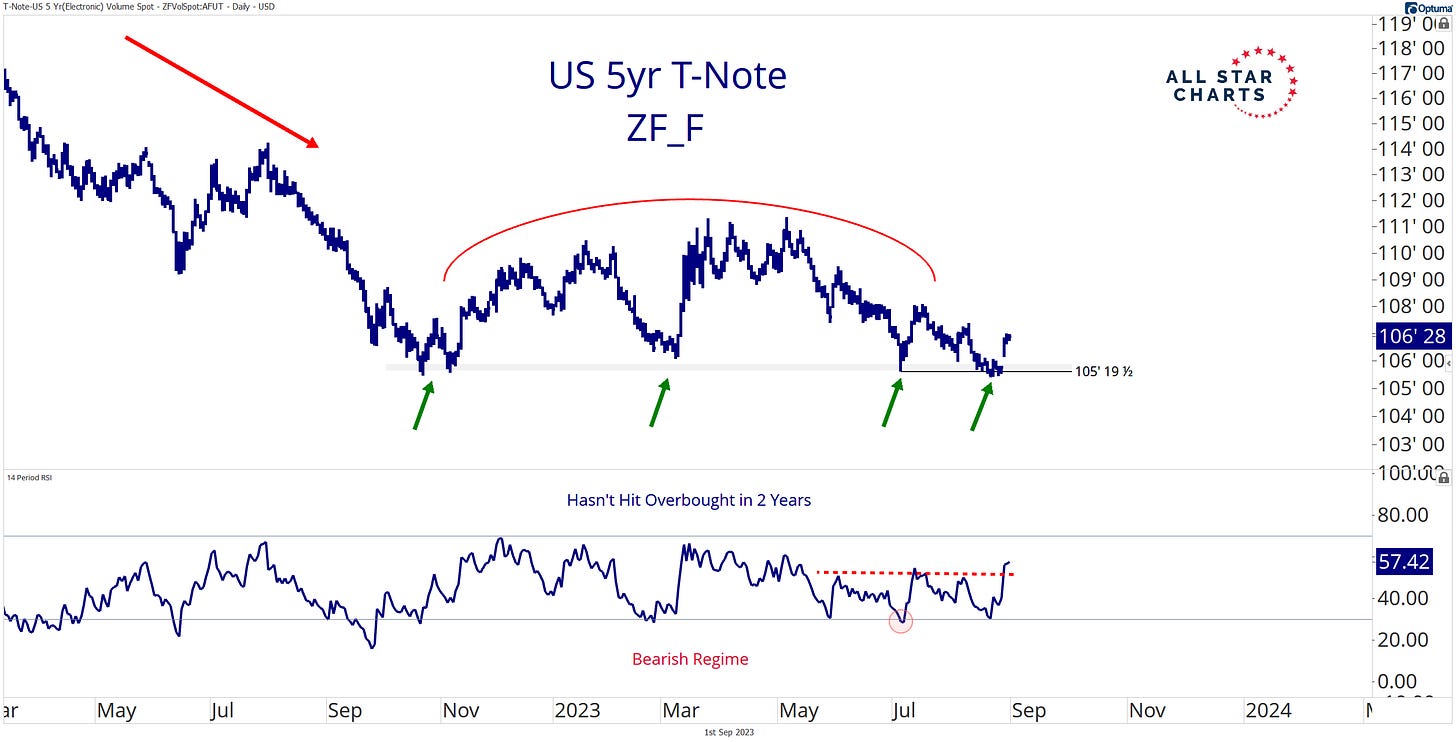
And a decisive breakdown never occurred for the five-year T-note.
In fact, no downside resolution has taken place of any sort:
The five-year continues to hold above the 105’20 level. As long as that’s the case, I find it impossible to carry a short position.
Yes, momentum hasn’t hit overbought in over two years. But I trade price, not the 14-day RSI.
I also prefer shorting the longer end of the curve as it leads shorter-duration bonds to the downside.
This won’t stop me from monitoring these bonds for confirmation of the sell signal for the longer-duration bonds.
Interestingly, last week’s sell signal for the two-year T-note didn’t amount to much:
Instead of following through to the downside, the two-year almost immediately reversed higher.
And while momentum remains in a bearish regime (a common thread across the curve), the 14-day RSI is posting its highest reading since March.
As we move across the curve, the 30-year is the only short bond trade still in play.
Bulls have reclaimed the breakdown level in the 10-year. The five-year holds above support. And the two-year has posted a potential failed breakdown (though it wasn’t much of a break to begin with).
Regardless, I still don’t like buying bonds at these levels, at least not until bullish data points appear on the charts.
I’d rather lean in the direction of the 30-year T-bond and wait for bearish confirmation from shorter-duration notes.
AllStarCharts - Ready For Higher Oil Prices??? (are YOU and is the Fed ready?)
Oil prices just went out at their highest monthly close since last October. That was almost a year ago.
The trend for Crude Oil has turned up.
Here's all that former resistance from 2018 turning into support more recently:
And just think, Energy stocks haven't even broken out yet.
We're still watching the undercard.
The real trend hasn't even gotten started.
Here's the S&P Energy Index still stuck below its highs from 2008.
Yes 2008!
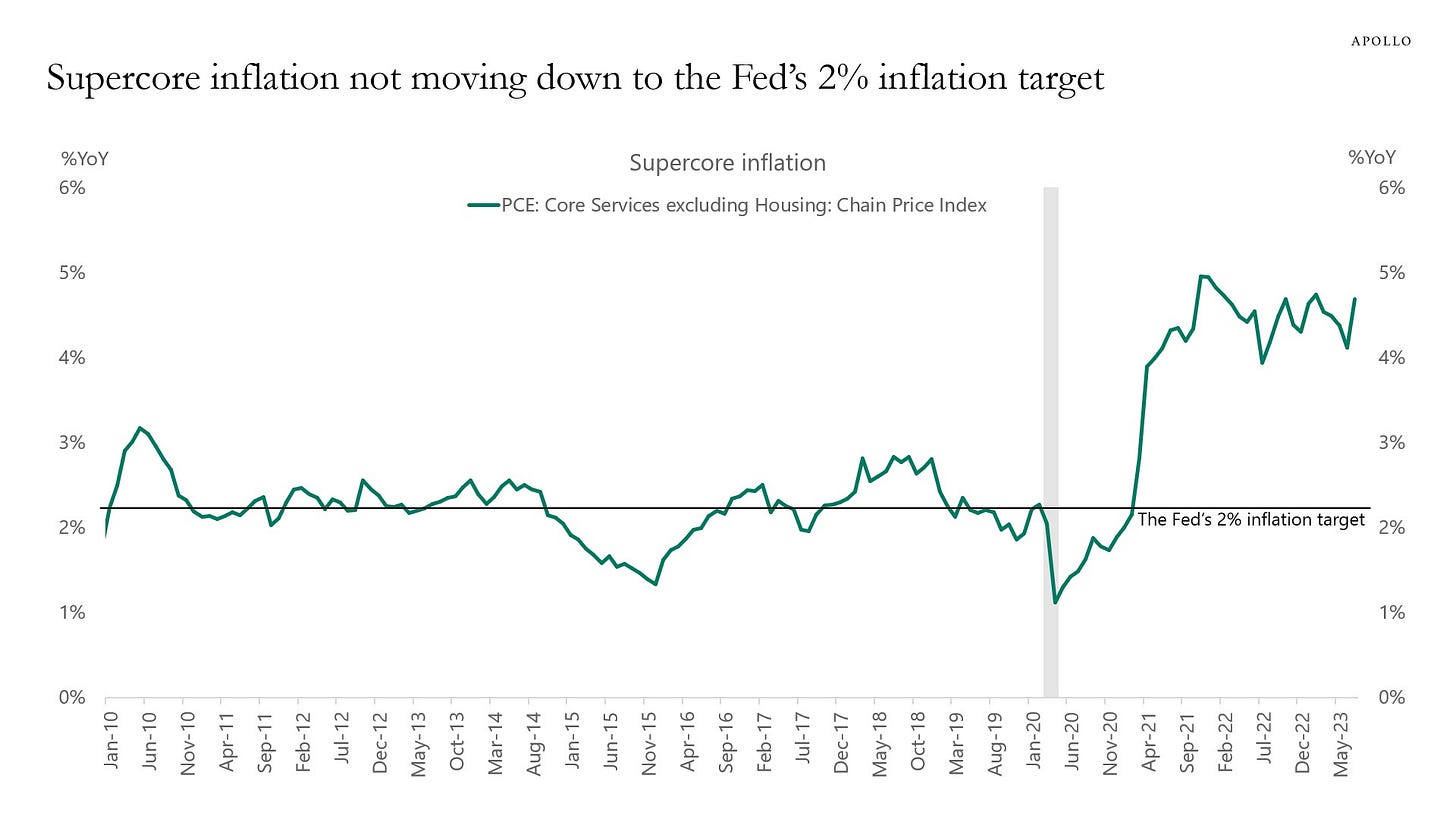
Apollo - Inflation Is Still a Problem (see above note on EARL?)
Markets think the inflation problem has been solved. But that is the wrong conclusion.
The chart below shows that supercore inflation, which is the Fed’s preferred measure of inflation because it excludes housing, is sticky at 4.5% and not showing any signs of moving down to the Fed’s 2% inflation target. In fact, supercore inflation increased in July because of strong inflation in financial services, transportation, food services, amusement parks, and sports.
The bottom line is that inflation is still a problem, and equity markets, credit markets, and rates markets are underestimating how much additional slowing is still needed in the service sector to get inflation under control.
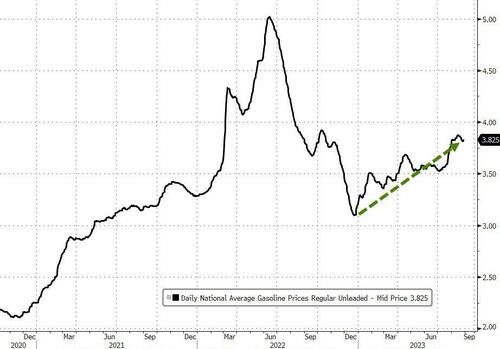
ZeroHEDGE - Labor Day Weekend Gasoline Prices Highest In Over A Decade (see AllStarCharts chart of EARL just above … or don’t, shield yer eyes, ain’t pretty)
While we are sure that the Biden administration will loudly proclaim their victory by crowing that pump prices for gasoline are down over 20% from the highs last summer (June), they may be a little less forthcoming about the fact that gas prices are also up over 23% year-to-date...
Calafia Beach Pundit - Of concern: jobs growth is slowing
I spend a good part of most days following the news and key economic and financial market indicators. When I see Fed governors quoted as saying things like "the labor market is still strong," or "inflation is still too high," I begin to wonder if they even bother to look at the numbers themselves. I suspect they don't devote nearly as much time and effort as I do. Which is disconcerting, to say the least…
… Jobs today are growing at about the same rate as they did in the years just prior to Covid, and they show every sign of continuing to decelerate. This is by no standard "too strong." It's more like average-getting-worse. Today's jobs growth is sufficient to deliver real GDP growth of 3% at best, but more likely something equal to or less than the 2.1% rate we have seen since mid-2009—years that featured decidedly sub-par growth from an historical perspective.
How can a Fed governor look at these numbers and think that the economy is too strong? If anything, these growth numbers should prompt concerns that the Fed has already tightened too much. Especially when you consider, as I did in my previous post, that inflation has already fallen to 2% by some measures.
LPL - September Spoiler? (reads to ME like a note of ‘its different this time’ cuz, you know, technicals …)
Key Takeaways:
The S&P 500 snapped a five-month winning streak in August. The drawdown last month was orderly, which we view as a good sign for the health of this bull market.
With the soft-landing scenario gaining traction, and interest rates backing off their recent highs, buyers stepped back into the market right near support from the August 2022 highs. Technical progress has continued since, leaving 4,600 as the next major hurdle for the S&P 500 to clear.
While the S&P 500’s monthly winning streak is over, upside momentum may continue. After the end of a five-month winning streak, the market has continued higher over the next six months, generating an average gain of 7.3%.
Beware of September, historically the worst month for the broader market. However, we have found that seasonal weakness is less pronounced for stocks when the S&P 500 is trading above its 200-day moving average.
… S&P 500 Technical Setup—On the Rebound
TheMoneyIllusion - We’ve never had a soft landing (Scott Sumner of Bentley — my alma mata … never had him as prof but he’s one of the good ones at Bentley and in general)
The media often discusses previous “soft landings” experienced by the US, citing examples such as the rate increases of 1994. Don’t believe them. Interest rates are not the economy. The US economy has never had a soft landing (although other countries have them–for instance the UK in the early 2000s.)
… Will this be our first soft landing? Who knows? The macroeconomy is basically impossible to predict. I suspect that July 2018 to July 2021 would have been America’s first soft landing, if not for Covid. (Sorry Trump, you don’t get credit for “If only”!! But Jay Powell gets two shots at it.) …
… AND for any / all (still)interested in trying to plan your trades and trade your plans in / around FUNduhMENTALs, here are a couple economic calendars and LINKS I used when I was closer to and IN ‘the game’.
First, this from the best in the strategy biz is a LINK thru TO this calendar,
Wells FARGOs version, if you prefer …
… and lets NOT forget EconOday links (among the best available and most useful IMO), GLOBALLY HERE and as far as US domestically (only) HERE …
Finally, as this long weekend’s note mercifully comes to a close (like the end of this CSU game), one final link as lots of other college football happening … In fact, we’re heading out tomorrow to catch Rutgers v Northwestern tomorrow afternoon and so this one may be worth a share
Wells Fargo - The Economics of College Football: 2023 Edition
Change Arrives for the NCAA and Many State Economies
The 2023-24 college football season kicks off in earnest this weekend. The 87 games over Labor Day weekend will be met with much fanfare and provide fans the opportunity to meet uncertainty with understanding as the winds of change blow over college football. This summer, another round of conference realignment was announced for the 2024-2025 season. A number of teams will be on the move, resulting in a leaner Pac-12 and another expansion to the Big Ten, Big 12 and SEC next year.Generally speaking, the regions where college football is most prevalent are undergoing a bit of change themselves. Most of the preseason top ten ranked football programs are located in the Southeast or Midwest, two regions that are benefiting from a revival in manufacturing thanks to new public and private investment in semiconductor and electric vehicle production. Of course, college football is an economic force in and of itself and many areas benefit from the increase in spending that comes along each season from game attendance and tourism. Outside of football, higher-educational institutions continue to play a significant role in the economies where they are located despite battling demographic shifts and the knock-on effects of the pandemic.
THAT is all for now. Enjoy whatever is left of YOUR weekend …


Excellent work !!!
NFP data looks too Perfect.........beware of Gov't Data(ie. China)
FED has to be close to finished. One more, at most......if not Done.
FED should be happy....
Soft Landing looks possible, perhaps probable.....