(USTs are lower, belly leading rates on heels of strong German data and EZ supply)while WE slept; 'most damaging day for bonds of the year'; what, ME worry (Dutta)?
Good morning … A funny thing happened on the way to trying to be convinced NOT to fret whatever the (hawkish)message from YESTERDAY’S FOMC MINUTES …
ZH: FOMC Minutes Show "Almost All" Fed Members See More Rate-Hikes In 2023, See "Mild Recession" In H2
With more rate HIKES in mind and yields ticking HIGHER across the board, clearly I’ve got to unsharpen my crayon to THEN redraw some TLINES and as I’m doing that, I thought I’d shake things up a bit and look at TIPS YIELDS (expected REAL rate AFTER the flation… appears to be breakin’ badly (ie HIGHER) … My capabilities are limited but once again, thanks TO TradingView for this one,
NOT taking too much of a ‘technical’ signal from stochastics but rather noting the tick higher and being on the verge of breakin’ badly … WHY it matters?
John Authers: Blood in the streets is an overrated buying signal
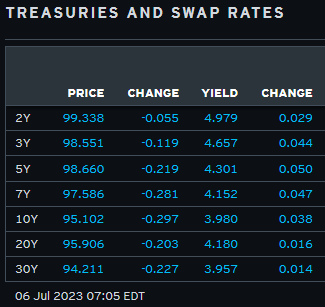
… Yields on US Treasuries climbed, with the yield on policy-sensitive two-year Treasuries inching up to 4.94%, while the 10-year advanced to 3.93%. They have been on a relentless march higher since the May FOMC meeting, with the “market sharply penciling out rate cuts and increasing the pricing for the trough rate to 3.5% as investors pencil in higher odds of a soft landing,” said Gennadiy Goldberg, head of US rates strategy at TD Securities. The yield on 10-year Treasury Inflation-Protected Securities — the effective expected “real” rate after inflation — has hovered near the peak it set last fall, and is now at an eight-month high:
Ahead though, there might just be more good news for the Fed on the inflation front in the next few months, said Omair Sharif of Inflation Insights. And if core inflation does come out softer between next week and September’s Federal Open Market Committee meeting, then the odds of a September hike are low. But that would move the spotlight on to the next month. To Jason Pride, chief of investment strategy and research at Glenmede, a pattern is emerging among policymakers:
They’re setting themselves up for 25 basis points every other meeting, which is effectively 12.5 basis points every meeting, until they feel that they’re done. This is a Fed that’s basically saying, ‘Inflation’s coming down, trajectory looks right from a headline perspective, but we still have residual worries and therefore we’re going continue to press.’ If they felt like this was done and clear, they would’ve stopped. Period.
If the Fed is truly determined to tamp down inflation, the next question is whether an economic downturn will happen. The staff still forecast a mild, two-quarter recession starting in the fourth quarter of this year, a view that some, like Wall Street veteran Ed Yardeni, contest. But to Ed Hyman, founder and chairman of Evercore ISI, “the yield curve works” and it’s been inverted for a while.
Investors will now watch Friday’s June employment report for any sign of a cooling labor market. It’s clearer than ever that the Fed will need some really strong evidence of this to dissuade them from more rate hikes.
AND too much thinking on NOT nearly enough coffee and so … here is a snapshot OF USTs as of 705a:
… HEREis what this shop says be behind the price action overnight…
… WHILE YOU SLEPT Treasuries are lower with the belly leading rates higher (see attachments and discussion) this morning after strong German factory orders (+6.4% MoM in May) and long-end supply from Spain and France- as Gilts once again pace a Tsy and Bund selloff. DXY is lower (-0.3%) while front WTI futures are modestly higher (+0.25%). Asian stocks fell (Hang Seng -3%), EU and UK share markets are all in the red (SX5E -1.5%, FTSE 100 -1.35%) while ES futures are showing -0.45% here at 6:50am. Our overnight US rates flows saw client activity that was counter the price action with real$ buying seen in intermediates during an active Asian session. In London's AM hours we also saw better buying interest from real$, centered around the 10-year point. Overnight Treasury volume was very solid at ~200% of average with 5's and 10's (325% of ave each) seeing brisk turnover overnight…
… what was clear to this observer was that yesterday may have been one of the single most damaging days for bonds of the year- from a technical perspective. Perhaps second only to May 4th- the day the regional bank ETF (KRE) traced out a bullish Island Reversal at the move low. In the around 2 months since that low in the ETF, 2yr yields are ~115bp higher, 10yr yields are 60bp higher and 30yr yields are ~25bp higher.
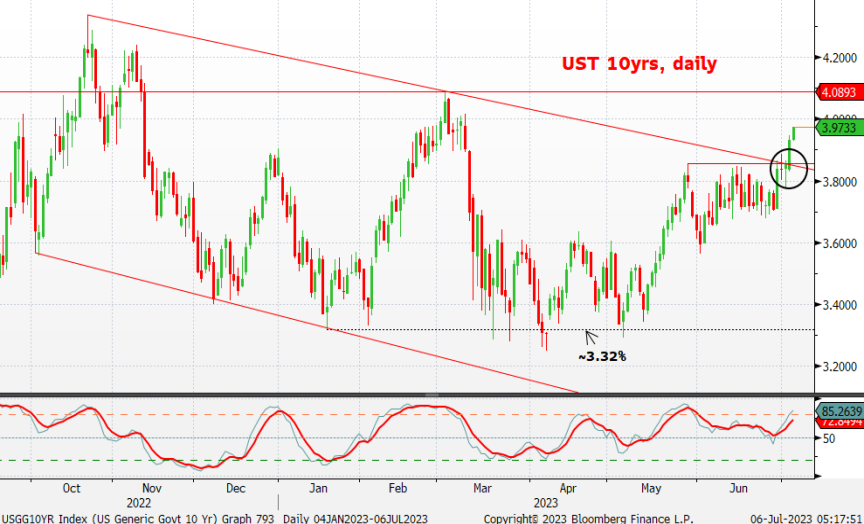
Let's look at some of that damage from yesterday/overnight and we'll take a stab at potential next-stops for key US rates benchmarks. Our first attachment this morning looks at the daily chart of Treasury 10yrs. Here you can see how yesterday's close did two things: 1) yields closed above a well-defined range in place since late May and 2) broke a bull trendline/channel top in place since October's move high in 10yr yields. We show how both lines (the bull trend and the range highs) intersected at ~3.86% and that's now behind us. *We should mention that Tsy 5yrs are taking out their equivalent bull trend this morning*. Anyway, it would appear that a next-stop for 10yr yields may be their 2023 highs from March at ~4.09%.
… and for some MORE of the news you can use » IGMs Press Picks for today (6 July) to help weed thru the noise (some of which can be found over here at Finviz).
From some of the news to some of THE VIEWS you might be able to use… here’s what Global Wall St is sayin’ …
First UP, as the wait for Lacy Hunt / HIMCO latest missive just getting started, a few words from the next generation of this quality thinker … Eric with NFP preview
EPB Macro: What You Should Look For In This Week’s Jobs Report
The fate of the next Federal Reserve decision will be decided on Friday.
If the monthly Nonfarm Payrolls number is “strong,” then another rate hike should be expected, bringing the upper end of the Fed policy range to 5.5%. However, if the monthly jobs number is “weak,” then the FOMC will probably stay on “pause.”
The chart below shows that the 3-month average of monthly job gains is slightly less than 300,000, a robust pace of job creation by most assessments.
We all know employment is a highly lagging indicator, and thus changing interest rates based on any given monthly number is far from optimal policy, but there is quite a bit of information within the report if the data is processed carefully…
… Summary So what should you look for in this week’s jobs report?
While the Fed and the overall market will have a knee-jerk reaction to the headline number, it’s worth paying attention to the story that emerges from the economic cycle sequence.
You should break the jobs report into several buckets based on the level of Cyclicality.
If we see more weakness in the Cyclical Employment baskets, we know with a higher level of confidence that recessionary conditions are biting, and there is grave business cycle risk imminently ahead.
However, if the Cyclical Employment sectors do not show an increasing pace of deterioration, then that could certainly prolong the onset of the recession.
In either case, a comprehensive overview of Leading Indicators suggests that completely avoiding a recession is historically improbable, but the story from the economy’s most Cyclical sectors will help understand the question of timing.
Moving along TO a note from large German bank strategist offering some context on yesterday’s moves
… With the US back from their holiday, it wasn't a great day for 60/40 portfolios as bonds and equities mostly declined in unison. The most notable sell-offs were in US Treasuries (10yr UST +7.7bps) and with a 6.6bps steepening of the US curve, Gilts (10yr +7.8bps), and a -0.73% decline in the Stoxx 600.
The sell-off in 10yr Treasuries (+7.7bps) helped them hit a post-SVB high of 3.93%. Yields edged higher all day until the Fed minutes were released towards the latter part of the trading session. At that point the sell-off seemed to stall. Real yields led the move, with the 5yr real yield (+7.0bps) closing above 2% for the first time since 2008, highlighting that policy and yields are getting more restrictive. The frontend was more resilient with the 2yr yield only +0.9bps higher. Fed futures are indicating 33bps of hikes through the November meeting with an 85% likelihood of a hike in 3 weeks’ time at the July meeting. Meanwhile in early Asian trading, yields on the 10yr USTs (+2.18bps) continue to move upwards, trading at 3.95% as we go to print…
This same shop looking at a somewhat bigger picture than just yesterday,
DB: If a recession were six months away, would markets and data tell you?
f a US recession is coming, should we already know from markets and data right now?
To help answer this question, this chart book looks at how various assets and data have performed leading up to previous recessions through history, and compares that to what’s happened over the last couple of years. DB’s house view is for a US recession starting in Q4 2023, though that could potentially get pushed back into Q1 2024. So these charts assume we’re six months away from a recession, and benchmarks today against that point in previous cycles.
Elsewhere, we look at how US inflation is turning down, and discuss whether strong markets this year include a liquidity and bubble component.
We then provide a selection of interesting market slides covering the premise that central bank policy is only likely to get tighter with inflation falling, whether commercial real estate is set for the third-biggest fall in 70 years of data, and DB’s current estimates as to when US excess savings will be eroded…
… 10yr Treasury yields tend to move slightly higher as we get closer to a recession. There’s nothing anomalous in this cycle at the moment.
With this idea and thought provoking exercise and run through charts attempting to flesh out IF we were 6m ahead of recession, would markets be signalling it … This next note from Prof OPTIMISM Siegel’s latest,
… The Fed appears to be relying on the old Phillips curve idea, which suggests that a strong economy leads to more inflation. However, the numbers in commodity markets and oil markets do not indicate elevated inflation.
But the market is responding to the strong economic data over fear of the Fed’s ongoing war on growth, as the momentum in the tech sector remains quite strong. Earlier in the year, any hint at a tighter stance on policy and the market shuddered but now it is brushing that off. We will see how long that can last.
The housing market is showing signs of stabilization with yet a third month in a row of higher prices in the Case-Shiller housing indexes, although existing home sales remain low. Housing affordability has decreased significantly, with home prices up 40% while average mortgage costs increased by 65%. This collapse in affordability makes it difficult for buyers to finance a home purchase with a mortgage, so the stabilizing in prices likely comes from cash deals.
I believe we still have elevated risks of a downturn in the second half of the year due to potential negative shocks. We have the Supreme Court's decision on student loans that will crimp spending and a potential UPS strike in the short run.
The market is currently prioritizing the strong economy over fear of the Fed. I think momentum and fear of missing out on gains can take the market higher over the short run. It could end by taking us towards an overvalued level. But in the second half of the year, we will be watching for weak employment reports and other negative shocks that could alter the strong current tones in sentiment. However, value stocks are already positioned for a mild recession, and their valuations are persuasive in the long run.
But then … as ZH tagline — ripped from Fight Club — notes,
On a long enough timeline the survival rate for everyone drops to zero
SO … stocks are maybe NOT so persuasive? How then about BONDS? A different take from that aforementioned large German shop,
DB: How the 10y - fed funds "leash" is playing with the USD
US bond yields are on a tear higher, with the 10y through to its highest levels since early March and through its trendline from the October high last year. The 5y yield is also up to the highest levels since early March, but has yet to break its trendline from October that technicians would see as a confirming signal for the 10y yield break higher.In terms of the factors pulling the belly and back-end yields higher, blame it on the very front end of the curve. We have noted from early in this hiking cycle that one has to go back over 40 years for the 10y yield minus fed funds to consistently trade through negative 150bps as per figure 1 below.
The more the fed funds terminal rate treads in the direction of more than one more 25bp rate hike (currently priced for 33bps of cumulative hikes), the more the backend is pulled up by what can be thought of as "a leash" that will see 10s - fed funds not easily invert by more than 150bps. This negative 150bps constraint is probably because both the carry costs of back-end longs become prohibitive, and the yield pick-up at the front-end is particularly attractive. One crucial point here is that if the Fed dots are correct, a 10y yield more consistently trading above 4% would be expected…
Its MATH then. Maybe even SCIENCE … and while it’s never different this time, I cannot help but think of consequences … nothing happens without a consequence, right? Looking into one aspect which has been very well ‘advertised’ and tossed about,
WolfStreet.com: CRE Nightmare for CMBS Holders: Office Mortgage Delinquency Rate Has Biggest Six-Month Spike Ever. It’s just the Beginning
… Office mortgages that had been packaged into CMBS went through a horrendous default cycle following the Financial Crisis, with the delinquency rate topping out at over 10% in 2012/2013.
But this current six-month 2.9-percentage-point spike from 1.6% to 4.5% is the fastest six-month spike in Trepp’s data going back to 2000.
So this is going to be interesting because we’re just at the beginning of a massive structural change – not a temporary blip – that is impacting office towers; turns out, companies have figured out they won’t ever need this vast amount of vacant office space…
… Even lower interest rates won’t make vacant or half-vacant office towers economically viable. Markets, if allowed to do the dirty work, are good at pricing those situations, and providing a low cost-base for developers with an appetite for risk to redevelop those properties, at the expense of existing investors.
Another version of the NOTHING WITHOUT CONSEQUENCE to be considered,
MS: Student Loan Restart – Implications Across Retail
The 3+ year-long moratorium on federal student loans will come to an end soon. Our US Economics & Consumer Finance teams size the impact on consumer spending broadly, & we consider the implications across both Softlines & Hardlines Retail…
US Economics: The more than three year long moratorium on federal student loans will come to an end soon, with interest payments expected to resume October 1. This would impact the 26.6 million borrowers who have federal student loans in forbearance totalling $1.1tn or $41k/borrower. If all borrowers in forbearance were to restart interest payments of $200 to $300/month, this will total $5.3bn to $8bn in interest payments monthly, or $64-$96bn/annually - equivalent to 0.3%-0.5% of disposable income. Our economists estimate the hit to disposable income from the end of the student loan moratorium and increase in debt service costs lowers real PCE this year by 8-12bp and real GDP by 6-9bp. The largest impact will occur in October, when spending levels shift lower to incorporate higher debt service costs.
US Consumer Finance: We expect the combination of student loan payments restarting in October + no loan forgiveness to be a headwind for delinquencies, as consumers divert cash flow servicing other forms of debt (credit card, auto, etc.) to their student loans. This could accelerate delinquency rates, which are now above 2019 levels and increasing at the fastest pace in ~15 years. However, new Biden administration initiatives could lower tail risk for low/middle income consumers: 1) 12-month "on ramp" grace period means borrowers will not be penalized/moved into delinquency if they fail to pay, though interest still accrues; 2) New "SAVE" income-driven repayment fully goes into effect July 2024, lowering payments owed by undergraduate borrowers if they adopt this new IDR plan.
With all these consequences still out and about in the dialogue, a look in at yesterday’s FOMC minutes which we were led to believe weren’t worth much more than a hill of beans (DB: Do the minutes matter?)
Bloomberg BNP US June FOMC minutes: Policymakers steer toward further moderation in the pace of tightening
KEY MESSAGES
The June FOMC minutes strongly signaled the Fed’s intention to further moderate the pace of policy tightening – i.e., something less than 25bp per meeting.
In a sign that the committee is approaching the terminal rate, the minutes appeared to downplay recent strength in both economic activity and the labor market, instead emphasizing uncertainty around monetary lags and the credit impulse.
We think the minutes’ focus on credit conditions reinforces our view for one more 25bp hike in July.
The risk is that economic resilience could support committee hawks’ desire for additional hikes beyond July, but we continue to think materially weaker conditions will ultimately dissuade policymakers from further action.
Goldilocks: FOMC Minutes Highlight Slower Pace of Hiking
BOTTOM LINE: The minutes to the June FOMC meeting noted that “almost all” participants judged that keeping the federal funds rate unchanged was “appropriate or acceptable,” while “some” participants either preferred or “could have supported” a 25bp hike in June. “Many” participants judged that “a further moderation in the pace of policy firming was appropriate” to allow the Committee to gather more information on the “effects of cumulative tightening” and “assess their implications for policy.” The Fed staff continued to expect the economy to enter “a mild recession,” although it now saw the possibility of the economy avoiding a recession as “almost as likely as the mild-recession baseline.” Participants noted that “banking stresses had receded and conditions in the banking sector were much improved since early March,” although they continued to expect tighter credit conditions to “weigh further on economic activity.” Participants again characterized inflation as “unacceptably high” and stressed that declines in core inflation measures had been slower than expected.
ZH: FOMC Minutes Show "Almost All" Fed Members See More Rate-Hikes In 2023, See "Mild Recession" In H2
And from these minutes which show ‘almost ALL’ favor MORE HIKES right back to THE question remains on hearts and minds of stratEgerists everywhere,
Leading indicators suggest that some key components of core inflation are set to decline in the months ahead. As a result, our top down analysis suggested that there are downside risks to the FOMC's SEP core PCE forecast for Q4-23 (3.9% vs. our estimated range of 3.3-3.9%).
This leaves the labour market as the likely binding constraint that will determine the timing of the Fed's easing cycle. On current trends, the private sector quit rate should decline to 2.4-2.5% in Q4 2023. Historically, this would be consistent with an unemployment rate above 4%. This creates upside risks to the FOMC's SEP unemployment rate forecast for Q4-23 (4.1%).
Given elevated spot inflation and the inherent uncertainty around any forecast, risk management considerations should lead the Fed to be reactive rather than pre-emptive before considering a shift in monetary policy. Thus, if the upside risks to the unemployment rate and downside risks to inflation are confirmed in Q4-23, the Fed could start its easing cycle in Q1-24.
From a market perspective, our SOFR 6m fwd 2s10s steepener is currently close to its indicative stop. Given the above analysis, we will wait for the labour market data to be released later this week before deciding on the trade.
There you have it … time and date stamp to watch — Q1 24 for rate cuts but in the meanwhile, the roller coaster of thoughts and emotions continues as
… Bond yields are climbing across major developed markets, as economies remain resilient and central banks signal they will keep raising their cash rates to tame inflation. (As ever, this excludes Japan’s central bank which remains uber-dovish in its conviction that cost pressures there will prove transitory). As a result a range of nations are seeing their 10-year rates head toward the multi-year highs reached in September-October 2022.
New Zealand’s 10-year yields jumped 5 basis points to 4.72%, poised for the highest closing level since early 2014. UK Gilts came close overnight to busting through their 2022 highs after much stronger than expected wage and inflation data spurred bets on more aggressive moves from the Bank of England. Benchmark Treasuries are heading the same way, though they are still under the yields reached in March before the banking crisis broke out. It is looking very much like last year’s peaks won’t turn out to be the highest seen in this cycle. That would be a logical outcome when you consider that the September 2022 meltdown that drove yields so high was driven by then UK leader Liz Truss’s tax-cut plans — a one-off, highly idiosyncratic event. Peaks created by persistent inflation and central banks responding to it would make more sense.
On THAT note where yields are heading back TO March HIGHS — yields attained just before the banking crisis broke out — I’d like to try and end on an optimistic note. Here are some sage words from the FACE OF OPTIMISM on Global Wall Street.
Insider: The economy's doomsday clock has been reset Wall Street's fearmongers were totally wrong about a recession Neil Dutta Jul 5, 2023, 5:29 AM EDT
Growth pessimists seem to lack logical consistency in their views. Their arguments are constantly contradicting: "Growth is holding up, which means the Fed must hike interest rates even more, which is bad for stocks." "Actually, growth is weak, and the Fed has already hiked interest rates too much, which is bad for the economy and stocks." Another concern about the market is that the stock-market rally is the result of only a few companies, which is a bad sign. But in 2022, the stock market was selling off while breadth — a measure of companies whose stocks are moving higher — was better, but this was also bad. Most recently, economic doomsayers argued that defaulting on the debt would be bad, but once the debt limit was resolved and the Treasury General Account was refilled, it was also bad because that meant the issuance of new Treasury debt would attract investors away from stocks.
It's starting to make my head hurt! At some point, rational people have to put their hands up and say, "You are wrong."
There is opportunity in this intransigence, however. If the consensus continues to have a tough time letting go of the recession forecast, that means stocks have room to grind higher as forecasts continue getting revised up and investors slowly come around to the potential of the economy's continued improvement.
But by the time analysts start to come around, the damage will have been done. The recession calls have put the idea of a slowdown at the top of investors' minds for over a year, and people who sold or got defensive with their portfolios will have missed out on strong market gains this year. The economists and forecasters who banged the doom drum may take a reputational hit, but that's nothing compared to the financial confusion they've caused for average investors.
My broader point is simple. The near-term recession risks are fading rapidly. There will be no recession in the next six months, and it's increasingly likely that we won't see one in the next year, either.
Cut. Print. BEAUTIFUL. In other words, What, Me Worry?
I’d very much like to see / compare / contrast Eric, Neil and Lacy’s views all in one place … a veritable steel cage match of intellect — perhaps one of the podcasters out there will pick up on the idea and make that sorta magic happen.


Thanks for your post! From your experience, what will be the optimal time and conditions for the short TIPS positions?
The IGMs Press Picks link is still for June 28
Love the posts though. Keep up the good work and thanks for sharing