(USTs are lower ahead of SUPPLY and DESPITE China data and all on LIGHT VOLUMES)while WE slept; "Global liquidity* has risen despite QT"; IF pause THEN CUTS(?)
Good morning … unless of course you continued to hold out some hope for Chinese ‘flation to kick back in as a result OF a robust global manufacturing economy,
SCMP: China's deflation worries rise in May as consumer prices remain low, producer price fall extends
China's consumer price index (CPI) rose by 0.2 per cent in May, year on year, while the producer price index (PPI) fell by 4.6 per cent last month.
Concerns have been increasing over weak domestic demand and economic uncertainty
On the other hand …. IF you are an FOMC to PAUSE next week P&L person, well, then, GOOD morning indeed?! …
Furthermore, for those who got long 10yy for example, at triangulated support, well, INITIAL CLAIMS, “…In terms of the bad news, in the US, the weekly jobless claims were at their highest since October 2021…” -DBs Jim EARLY MORNIN Reid
An update on RATES where i’ve just taken out another fat yellow crayon (thanks to TradingView) and redrawn a TLINE in effort to highlight next ‘line in the’ triangulated sand. 30yy
ABOVE the TLINE ‘support’ would suggest more inflation, a faster economy and below the (bottom)TLINE would then mean the opposite and ultimately DEMAND for duration … I’d note there’s simply NO signal from momentum (stochastics, bottom panel) SO one should then ‘play the range’ best one can … and as you do, here is a snapshot OF USTs as of 705a:
… HEREis what this shop says be behind the price action overnight…
… WHILE YOU SLEPT Treasuries are lower this morning ahead of a huge and concentrated Tsy supply slate (see text below) and despite another downside miss in China's factory gate prices. DXY is higher (+0.2%) while front WTI futures are little changed. Asian stocks were mostly higher (NKY +2%), EU and UK share markets are modestly lower while ES futures are showing -0.1% here at 6:55am. Our overnight US rates flows saw a quiet, sideways trade during Asian and London AM hours with our desks reporting slightly better selling on balance. Overnight Treasury volume was very weak at ~65% of average overall…
… At the other end of the curve, Treasury 30yrs remain near their longer-term range support that begins near 3.985% (drawn in) and extends up to 4.045% (March 2nd's rejected high). One thought is that if 30yrs continue to respect this key range support band... any damage to the front end from upcoming events may be limited given how flat/inverted the curve is. On the other hand, close 30yr yields above 4.00% and we see little of the way of support for 30yrs until around 4.34%- the November highs.
AND I’m pausing a moment as I’m grateful the folks behind WHILE YOU SLEPT are still gainfully employed and producing content …
ZH: Citi Dismantles Popular CitiFX Commentary And Analysis Team
To those who left and those who remain and been reassigned, THANK YOU for sharing insights over the years. I look forward to stumbling upon your work into the future and best of luck … and for some MORE of the news you can use » IGMs Press Picks for today (9 JUNE) to help weed thru the noise (some of which can be found over here at Finviz).
From some of the news to some of THE VIEWS you might be able to use… here’s what Global Wall St is sayin’ …
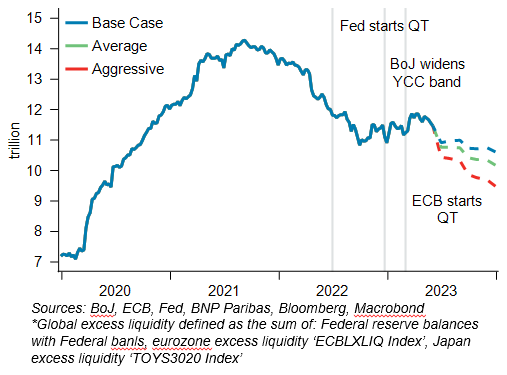
Global excess liquidity has risen by USD640bn since end-Q3 2022. This is unsustainable in a QT regime, in our view. We believe liquidity dynamics are set to shift significantly in the coming months.
Our base case is that liquidity will fall 6–9% by end-September and 7–11% by the year end. In a more extreme – but still plausible – scenario, the fall could be as large as 16%.
Liquidity contractions impact assets with a lag. There are direct and second-round effects. We find it takes around 10 weeks for the full impact to be absorbed. A 10% contraction in global liquidity corresponds to:
A 4% decline in equities and 20bp widening in IG credit. Sensitivities have been rising and since 2020, the number is as high as 12% for SPX.
Higher yields (13bp in 10y) and a steeper curve, although risky asset weakness eventually offsets the initial sell-off.
2% appreciation in the USD vs. low-beta and a 4% appreciation in the USD vs. high-beta.
Global liquidity* has risen despite QT
This same shop then offers a look at some asset markets relationship
Rate risks: Next week’s CPI release and FOMC meeting are key catalysts for US equity beta, but also for factor and sector rotation. The BNP US economics team is looking for the FOMC to skip a hike at the June meeting, before re-engaging for a final hike in July. However, we think the June decision will be a close call. For rates, that translates into upside risks to US yields across the curve over the coming months, given the Fed’s apparent willingness to tighten further against the backdrop of a slow-to-materialize downturn. The still-in-play Fed will likely keep the shape of the curve sticky at inverted levels in this process, meaning a somewhat parallel shift higher in yields under our near-term baseline. As and when signs of growth weakness accumulate sufficiently to allow the market to relinquish risk of additional Fed hikes (likely later in the year), we do expect lower yields, but seen mainly at the front end of the curve. A genuine hard landing could justify a broader move across the curve, but under our central case for growth, we don’t see a particularly strong rationale for a material move lower in long-end yields….
AND for any casual readers who prefer STOCKS to bonds,
Just how narrow has the YTD rally been? Our analysis of S&P 500 performance over the last 20+ years shows that 2023 has been an outlier in terms of the concentration of returns, with the top 5 largest stocks accounting for nearly 3/4 of the index's gains.
Global bond yields declined around the US regional banks stress but have picked up again since May. In contrast to last year, equities have performed well, albeit with narrow breadth – equity/bond yield correlations have turned positive, even for the longer duration Nasdaq. This has resulted in equities turning more expensive vs. bonds and further declines in equity risk premia.
The continued resilience of the US economy, coupled with the resolution of US debt ceiling concerns, can at least in part explain the continued compression in risk premia. Besides the short-term relaxation on growth risks, we think optimism on the potential growth impacts of AI has also helped equities digest higher rates. Market-implied LT growth levels have increased since the COVID-19 crisis and have picked up further recently: while widespread AI adoption could boost productivity and support higher LT growth, there is also risk of near-term disappointment.
We remain relatively N in our asset allocation (OW cash/commodities, N equity/credit, UW bonds) and broadly up-in-quality. While the current late-cycle backdrop might limit cyclical upside, continued inflation normalization with resilient growth and AI optimism could continue to support risky assets.
… US equities have generally performed well despite rising yields, especially the longer duration Nasdaq, which materially underperformed last year (Exhibit 1)
… From here, our economists estimate that widespread AI adoption could boost productivity growth by 1.5pp per year over the next decade, which on our US equity strategists’ estimate would translate into 5.4% CAGR EPS for the S&P 500 in a central scenario over the next 20 years. While there might be more scope for repricing of LT growth, the risk of eventual disappointment also increases – further increases in bond yields could eventually weigh on longer duration stocks…
And finally, back TO bonds, a few words / visuals from Bloomberg ahead of next weeks CPI and FOMC and on heels of this past weeks hawkish surprises from Canada and the RBA …
The Federal Reserve’s next move after an anticipated pause is more likely to be a cut than a hike due to already restrictive rates, falling inflation and a recessionary economy.
Pause talk is in the air – with the market pricing in only a ~30% chance of a rate rise at next week’s Fed meeting – before further hikes. But the world, and the Fed, could look sufficiently different even by late summer that the risk calculus starts to favor looser monetary policy.
There are three main factors that could alter the Fed’s decision-making framework and prompt it to step back from its hiking cycle after a hiatus:
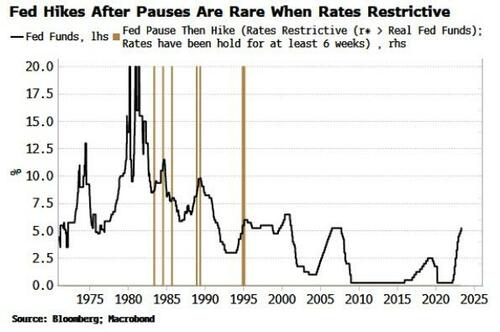
The Fed very rarely raises rates again after pausing when policy is already restrictive
Inflation will keep falling in the coming months, while labor-cost pressures are being revised significantly lower
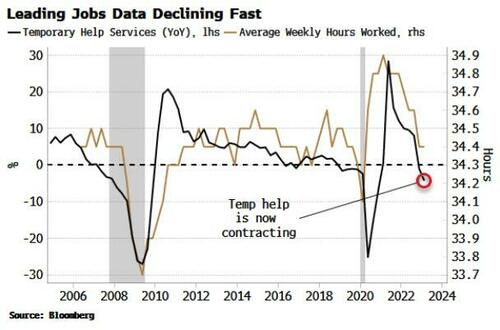
The jobs market is weakening fast
It might be a surprise, but it’s rare indeed for the Fed to re-tighten policy after pausing. It’s even rarer for it to do so when rates are already restrictive.
Moreover, as the chart below shows, the instances of this in the early 80s occurred when rates were in a longer-term downtrend, unlike today. It would thus be almost unprecedented (albeit not impossible) for the Fed to raise rates again after pausing.
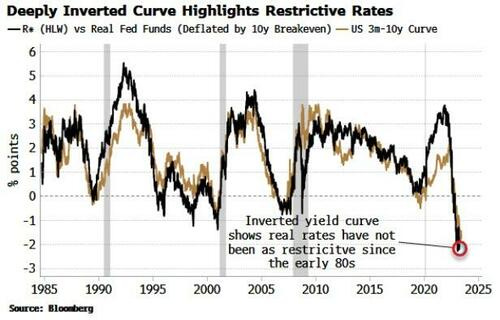
By several measures, rates are already very restrictive. Real policy rates are about to be above r*, the estimate of neutral. It’s an imperfect measurement with many assumptions. But inflation-fixing swaps see the real Fed rate at 2%-2.5% through summer, well enough above the latest r* estimate of about 0.6% to indicate policy is indeed restrictive.
This is underscored by the yield curve’s inversion, which is giving us a transparent read on how restrictive rates are. The 3m-10y curve is almost a facsimile of the degree of restriction in the real policy rate.
It’s no wonder some banks went under. The heavily inverted curve is a barometer of rate stress building up in the system, and a reminder that other unexpected grenades could go off and upend the Fed’s current outlook.
The inflation backdrop will also look very different in the coming months, with headline CPI set to fall to near 3%, according to fixing swaps. Core CPI should also keep falling for now, based on leading indicators.
The Fed is focused on wage growth for inflationary signs. But real wages are either still negative or barely positive, depending on what measure of compensation you use.
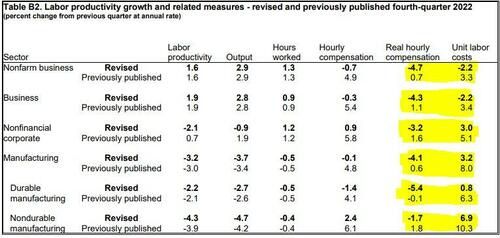
Furthermore, wage pressures are not nearly as high as they were thought to be. Last week’s release of employment data saw significant downward revisions to real hourly compensation and unit labor costs for the last quarter of 2022, as seen in the last two columns in the table below.
Source: BLS
The jobs situation may look very different soon too. Remember that unemployment is one of the most lagging indicators. Typically, the labor market looks in reasonable shape when a recession is already underway. It’s also not unusual to see some unexpectedly high payrolls numbers at this time (even if they may well be subsequently revised much lower).
It’s prudent instead to focus on the most forward-looking employment indicators. Two of these are temporary help and average weekly hours worked. Employers are likely to cull temp workers and cut full-time employees’ hours before they move to sacking people. This is also why more lagging measures of employment tend to hold up until after the recession has begun.
Both temp help and hours worked are falling quickly. The jobs situation – and therefore the Fed’s risk-reward for hiking rates again – could look sizably different in the coming months, especially as a near-term recession looks exceedingly likely.
The megacap-styled elephant in the room is the stock market. Can the Fed cut rates when there is a veritable buying frenzy in a few corners of the market?
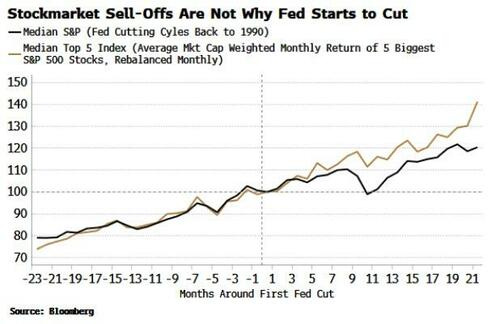
You might expect the market to bounces the Fed into a rate cut by selling off first. But that’s not what has happened on average over the last 30 years. As the chart below shows, the S&P tends to rally into the first Fed cut of the cycle.
Moreover, the chart also shows this is the same for the largest stocks, which are driving today’s market higher. The Top 5 Index rallies into the first rate cut and continues to do so afterward.
Canada and Australia’s recent rate hikes are adding a dose of uncertainty to the Fed’s outlook. This may add more volatility to anticipated policy rather than policy itself.
Nevertheless, the Fed will have an increasing number of off-ramps allowing it to refrain from further hikes. And the longer it does so, the more the backdrop will favor policy loosening. The pause that refreshes may end up being the prelude to a cut.


I just can't see Interest Rate cuts this year...
For, me the most likely scenario is Unchanged, at current levels , for the Fed...