Good morning … Clearly the likes of Chuck Shoo-merrrr and K McCarthy have learned from watching Schoolhouse Rocks How A Bill Becomes A Law and the bill will move TO Biden’s desk for signature SO that ‘relief’ trade kicking in … Before we learned of this late last night, a bit of GOOD news yesterday helped give bonds a bid (?)
ZH: US Manufacturing Surveys Signal "Renewed Deterioration Of Business Conditions" In May, Orders/Prices Plunge
… With overall macro data serially surprising to the downside in May, it is no surprise that expectations were for sub-50 (contractionary) prints for ISM & PMI Manufacturiung surveys this morning.
Manufacturing PMI slipped from its flash 48.5 level to 48.4 final in May, down from 50.2 in April (the 6th month below 50 of the last 7)
ISM Manufacturing also disappointed, falling from 47.1 to 46.9 (below 47.0 exp) - the 7th straight month below 50…
… The good news - prices paid plunged back into contraction.
The bad news - new orders plunged to their biggest contraction since COVID lockdowns...
AND as far as that BID goes … not sure how much further it could / should / would go ahead of NFP — data to determine the WHAT NEXT, as always — but then, there is that big short (2s, spoos) and so, 2s? Or is there (see below for more)? … here is a snapshot OF USTs as of 705a:
… HEREis what this shop says be behind the price action overnight…
… WHILE YOU SLEPT Treasuries are a hair lower and the curve slightly steeper after the debt limit bill cleared Congress and went on to Biden's desk for signature. As NFP looms in just minutes, DXY is modestly lower (-0.15%) while front WTI futures have extended recent gains (+1.6%). Asian stocks rallied strongly (Hang Seng +4%), EU and UK share markets are all higher (SX5E +1.2%, SX7E +1.55%) while ES futures are showing +0.5% here at 6:45am. Our overnight US rates flows saw a super slow session during Asian hours that featured better selling in intermediates from real$. Aussie bonds were a drag on Treasuries after Australia's minimum wage was hiked by 5.75% from July 1 RTRS. Overnight Treasury volume was weak at ~65% of average.
… Our last picture this morning looks at the daily chart of front ultras (WN). Like the 5yr real rate chart, the ranges/channel are quite clear here too with the low in WN's last week kissing the channel bottom with daily momentum now swinging back bullishly. So the long-end looks in great technical shape after cash bonds found solid support/inflows last week near 4.0%. Back to ~145.00 WN's go?
#GotWNs? … and for some MORE of the news you can use » IGMs Press Picks for today (2 JUNE) to help weed thru the noise (some of which can be found over here at Finviz).
From some of the news to some of THE VIEWS you might be able to use… here’s what Global Wall St is sayin’ …
Before I jump in TO the inbox AND ahead of NFP, all we’ve got is YESTERDAYS PAUSE story from WSJs Fed Whisper’er written before ADP,
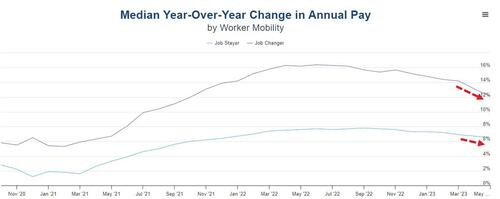
ZH: ADP Reports Bigger Than Expected Jobs Gains, Slowing Wage Growth
… ADP's Neel Richardson comments that:
"This is the second month we've seen a full percentage point decline in pay growth for job changers. Pay growth is slowing substantially, and wage-driven inflation may be less of a concern for the economy despite robust hiring."
Last month brought a broad-based slowdown in pay increases. Job changers saw a gain of 12.1 percent, down a full percentage point from April. For job stayers, the increase was 6.5 percent in May, down from 6.7 percent.
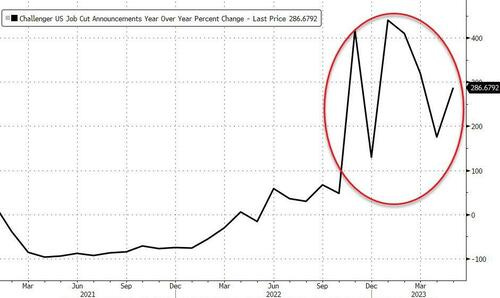
Finally, we note that Challenger Grey showed layoffs rising at 287% YoY...
So a mixed bag for Fed-watchers - jobs hot (bad), wages cooling (good).
AND SO … the economic INKBLOT tests will continue with Global Wall Street certainly taking victory laps no matter WHAT this mornings NFP data says and so I’ll almost move along TO the inbox but first, something from Bloomberg via ZH
ZH: Outside Of AI, Stocks Are Beginning To Flag A Recession Authored by Simon White, Bloomberg macro strategist,
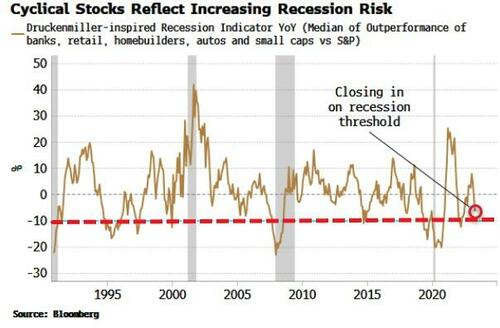
The huge outperformance of AI stocks is obscuring the increasingly recessionary message coming from an indicator based on cyclical stocks inspired by investor Stan Druckenmiller. Equity indices are now wholly reliant on AI-hype persisting and compensating for the decline in cyclical sectors.
AI ebullience is supercharging the market. But this is masking the increasingly voluble message from cyclical stocks. Druckenmiller once said “the inside of the stock market is the best economist I know”.
Based on previous comments he has made, we can build a “Druckenmiller indicator” of highly cyclical sectors such as housing, autos and retail.
As the chart below shows, this indicator has been turning down and is closing in on a zone that has previously preceded a recession.
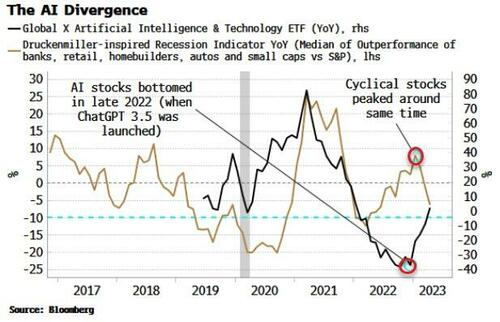
But you might not know it given the steroidal impetus from AI stocks. If we add an AI ETF to the last few years of the above chart, shown below, we can see the regime change in AI began in early 2022, when AI stocks kept falling despite the rise in cyclical sectors.
Semiconductor firms especially were getting bogged down in the US’s clampdown on semis’ technology and know-how going to China, while tech firms in general suffered from being high duration in an elevated-inflation environment.
But late last year, OpenAI publicly launched Chat GPT 3.5 in a “Sputnik moment” that shook rivals and galvanized a race to catch up. AI stocks bottomed and accelerated higher, while cyclical stocks started to turn down, reflecting the weakening pulse of the broad economy.
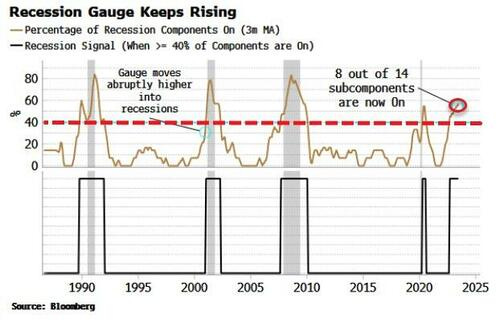
The Druckenmiller indicator is not standalone given it has had false positives in the past. Instead it should be used with a broad range of recession indicators, as encapsulated by the Recession Gauge shown in the chart below.
This, along with the deterioration in the Druckenmiller indicator, is consistent with the US economy entering a recession in the very near future (if it is not already in one).
Listen, when I see something of a DRUCKENMILLER indicator, well, it is / should be reason enough to pause and read … he is one of the best in the biz … And from one of the best in biz to … well, another FORECAST REVISION (on heels of YESTERDAYS updated FED call
Incorporating updated information, we have revised our forecast for May nonfarm payrolls to 210K from 200K.
Please note, our forecasts for the May unemployment rate and average hourly earnings (MoM) remain the same at 3.5% and 0.3%, respectively.
Sending this out yesterday to the world … lemme pause and ask — is this useful? Do we feel better about THIS dart throw as opposed to previous / others??
Since Wells was kind enough to share their thoughts, here are some more which may / may NOT impact this mornings NFP
Wells: ISM: Just About Every Measure of Activity Slowing... Except Hiring
Today's May ISM shows the fastest rate hikes in a generation are slowing just about everything in the manufacturing sector except the pace of hiring. For the Fed, falling prices and slowing activity without denting the labor market could diminish some urgency on their part to tighten further.
PCE inflation edged higher in April for both headline and core, as core services inflation remained firm. Updating our suite of statistical models, we find that our trend inflation measures remain mostly stable at historically elevated levels around 3.3-3.5%. Lack of progress on taming inflation, including evidence of remaining broad-based and persistent inflation pressures, are the key reasons some Fed officials continue to favor more hikes rather than pausing the tightening cycle (See Tilting toward a time out on the tightening campaign).
As Fed officials have indicated in the past, there are concerns that an extended period of high inflation could lead to an unanchoring of inflation expectation that ultimately makes taming inflation more difficult. Indeed, our recent analysis suggests that market measures of long-run inflation expectations have been on the rise recently, especially relative to fundamental drivers like oil prices (See Markets sense the inflation "clock is running"). At the moment, our baseline is that the Fed remains on hold, but there are clear risks of at least one more rate increase this cycle.
Measures of broad-based inflation remain elevated
This chart speaking PAUSE OR SKIP? I’m clearly reading it wrong … In any case, this same shop also offers a much more shorter-term view of the worlds,
A stronger than expected May labor market report should be greeted with only moderately positive USD gains, unless the data is strong enough that it encourages FOMC centrists to favor a hike. It probably needs the probability of a June hike back near 70% to push EUR/USD back to the recent cycle low at 1.0630 and press USD/JPY close to Y141. EM FX weakness will be concentrated on the weakest EM pairs, like USD/ZAR.
Weak USD data will very likely not be soft enough to do much damage to global growth expectations, and won't help the USD versus the high beta EM. Instead, a weak employment report is USD negative against both G10 and liquid EM FX, and since it will get the market thinking 'peak rates' (again) it will get some 'peak USD' participation too, taking EUR/USD to the low 1.08s. Note that a 10bp reduction of US 10y yields, has been worth close to 1.5 big figures on USD/JPY.
Gold has a higher beta than all the major currencies off US short and long-term rates, and is the best buy on weak US data. Within EM, the BRL has the highest beta, and with better sentiment, is well placed to take advantage of softer US data.
One last note made in Germany and which maybe MORE consequential as the Senate has passed the bill and so we’ll still be dealin’ with the ceilin’ but in a different way,
DB: Life after debt ceiling : TGA rebuild, bill supply outlook, and liquidity reshuffling
We discuss expectations for the Treasury General Account (TGA) and bill supply following the debt ceiling resolution. Rising bill supply and more attractive bill yields should lead investors to allocate out of the Fed's ON RRP and foreign repo pool; as a result, the associated drop in reserves should be considerably less than the TGA rebuild.
We also provide our latest thoughts around Fed QT and reserve scarcity. Ultimately, as reserves fall from abundant to ample levels, money market rates should move higher, leading to a reshuffling of excess Fed liquidity out of ON RRP and into bank reserves. We continue to anticipate that QT will end when the Fed begins cutting rates early next year.
Reserves could fall to $2.5 trillion by year-end 2023 in our baseline
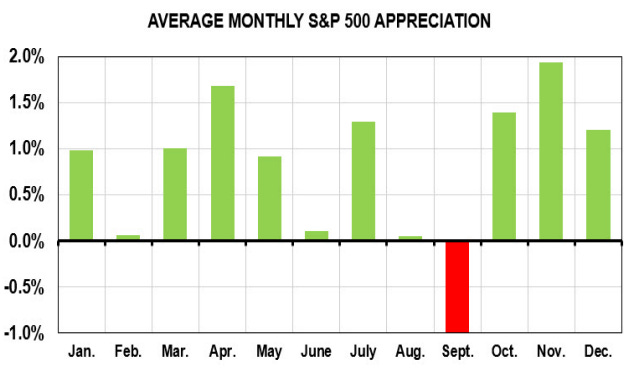
AND on STOCKS… YESTERDAY I mentioned some commentary on the JUNE SWOON (with a dose of technicals thrown in) and this mornings version is
June is not one of the better months for stocks, according to our analysis of market returns since 1980. On average, equity investors in June barely eke out a 0.1% positive return for the month -- better than only the weakest months of February, August, and September. The winning percentage is 61%, higher than only the 3Q summer months. We note that market returns in June have exceeded 5% only twice in the past 37 years: a 5.4% increase in 1999 and a 6.9% gain in 2019. Clunkers? We have seen a few, including 2008 (-8.6%), 2002 (-7.2%), 2010 (-6.1%), and 1991 (-4.8%). Last year, the S&P 500 skidded 8.4% in the month of June, while inflation was taking off. June typically is a quiet month for earnings, as the second quarter draws to a close. But don't be surprised by fireworks on the economic and inflation fronts. Tomorrow, the nonfarm payrolls report will be watched closely to determine the strength of the employment and, thus, consumer segments of the economy. Our forecast is for a solid 175,000 new jobs. The Federal Reserve meets and is expected by the market to raise the federal funds rate another 25 basis points. But our view is that they will stand pat. Inflation data released mid-month should indicate that pricing pressures continue to ease from the peak established a year ago. That slowdown in inflation has spurred a year-to-date rally in stocks of almost 10%. We'll see whether these returns can withstand the June jinx.
Swoon or JINX … yer choice, I suppose but the message (of some sorta impending markets doom remains and so, next trending question … #GotBONDS?)
Don’t wanna turn back to bonds? Ok, a couple last items on STOCKS,
StockTradersAlmanac: NASDAQ and Russell 2000 Lead June Pre-Election Strength
Over the last 21 years, June has been a rather lackluster month. DJIA, S&P 500 and Russell 1000 have all recorded average losses in the month. Russell 2000 has fared better with a modest average gain. Historically the month has opened respectably, advancing on the first and second trading days.
From there the market then drifted sideways and lower into negative territory just ahead of mid-month. Here the market rallied to create a nice mid-month bulge that quickly evaporated and returned to losses. The brisk, post, mid-month drop is typically followed by a month end rally led by technology and small caps.
Historical performance in pre-election years has been much stronger with all five indexes finishing with average gains. June’s overall pattern in pre-election is similar to the last 21-years pattern with a brief, shallow pullback after a solid start.
In pre-election years the mid-month rally has been much more robust beginning around the sixth trading day and lasting until the fifteenth. Followed by another modest retreat and rally into the end of Q2.
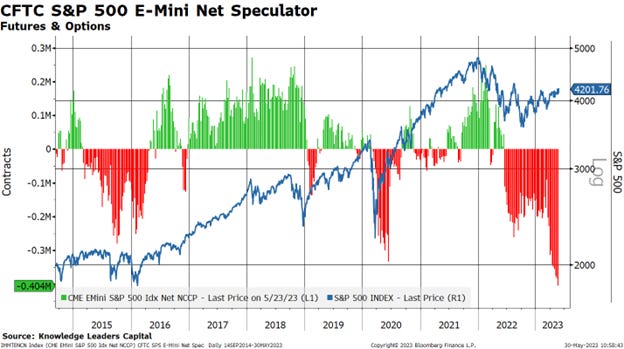
Last year's abnormally light equity positioning has essentially reversed. With less room for further institutional buying, we think the next leg higher for equities will be more dependent on fundamentals, leaving risk/reward skewed to the downside.
Figure 1. Hedge funds are long equities again, so positioning should consequently be less of a tailwind for stocks.
AND pivoting from Global Wall St inbox TO the www — one MUST begin with latest from Eric and,
EPB New Article: The Driving Force Behind the Current Economic Cycle
… In this report we show why the economy remains at imminent recession risk, which key sectors are keeping the economy afloat, and why the jobless claims data will be our most reliable signal moving forward…
… unfortunately for me, the report is behind the paywall but the 6min VIDEO worth a look.
There is also this one from May 30th,
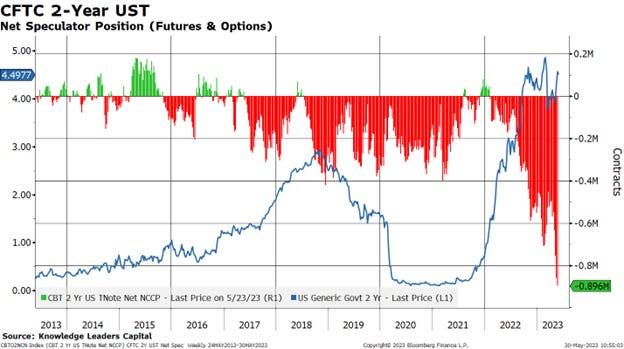
Knowledge Leaders: Warming to Duration
Leading into the weekend, where the debt ceiling had not been settled, markets were exhibiting very interesting positioning. To start, US Treasuries across the maturity spectrum were hugely out of favor. Net speculator positioning in options and futures were as short as they have every been. The charts below show the 2-year, 5-year and 10-year US Treasury.
…Hopefully, a successful debt ceiling deal brings some risk-taking back into the markets. At present, all money flows are going into money market funds, which is good news and bad news. The bad news of course is that these are money flows not going into risky assets. The good news is that, should the inflation fever break convincingly and US Treasury rates roll over, there is a tremendous amount of money that will be looking for higher returns.
While early indications seem to suggest that spending will be curbed in the next few years relative to the baseline by about $50 billion, while at the same time the US Treasury may issue a flood of US Treasury bills to rebuild its coffers, perhaps the more attractive play right now is the medium-to-longer dated US Treasuries.
From money markets TO considering of DURATION in mind, #GotCATTLE?
AllStarCharts: Interest Rates: Don’t Fight the Trend
US interest rates have churned within a tight range for months.
Remember: Sideways is a trend.
While intermarket evidence suggests a breakdown in yields, they simply refuse to roll over.
It makes perfect sense when we zoom out…
Rates are in a well-defined structural uptrend!
Check out the US 30-year Treasury yield overlaid with live cattle futures:
They look almost identical as both exhibit the classic base-on-base formation – one upside resolution followed by another.
To be clear, I’m not proposing a grand thesis regarding a strong positive correlation between long-duration rates and live cattle futures, or what the next directional move in live cattle and rates mean for AI stocks (though I haven’t dismissed the idea).
Instead, I’m simply observing the trend that began in early 2020.
I chose to place live cattle futures on the chart for effect – a reminder.
Key Technical Themes: The past week has seen European Equity markets come under renewed pressure again after again rejecting key resistances. With the volume picture starting to deteriorate noticeably and with weekly momentum seen negative and we maintain our view of looking for a top around current levels and a more concerted move lower…
… 10yr US Inflation Breakevens are coming under pressure again and we stay bearish for a retest and eventual break of key support at 208bps to confirm a large bearish “descending triangle”…
… and we stay bullish 10yr US Yields viewing the recent bounce as corrective and temporary and we look for a retest of the YTD lows at 3.29/265%.
… Bigger picture though, we still expect yields to move lower in the 2nd half of the year and maintain our core 3.00% objective, especially as both Real Yields and Inflation Breakevens look as though they are forming negative patterns (i.e. both BEs and RYs have the potential to move lower over the medium-term in our view)...
Interesting charts (and a new look for this weekly package … ) AND … THAT is all for now. Off to the day job…HOPE to have something over weekend. Good luck with NFP!