Good morning … Last night WSJs Fed Whisperer out with a FED PAUSE story,
WSJ (Timiraos):Fed Prepares to Skip June Rate Rise but Hike Later Officials would slow increases to assess more data on the economy and bank lending
Federal Reserve officials signaled they are increasingly likely to hold interest rates steady at their June meeting before preparing to raise them again later this summer.
Ok then. SO it would appear we are seeing / hearing what we WANNA hear (pause, skip, whatever) and whistling past the … never mind. Moving along where overnight,
CNBC: Debt ceiling bill passes in the House, advances to the Senate days ahead of default deadline … The Fiscal Responsibility Act passed 314-117, with support from both Democrats and Republicans.
Not shocking. Let us see how the Senate handles it (likely to pass) and move along.
IF, on the other hand, you are looking for surprises, well, Euro zone inflation falls more than expected to 6.1% as core pressures ease (CNBC). Here’s a snapshot (and summary)via Nordea
… HEREis what this shop says be behind the price action overnight…
… WHILE YOU SLEPT Treasuries are modestly lower with the curve flatter after the debt ceiling bill passed the House (link above) while China's manufacturing PMI rebounded back into expansion. Containing the sell-off were downside misses in Eurozone CPI (also linked above). DXY is lower (-0.25%) while front WTI futures are too (-0.8%). Asian stocks were little changed (SHCOMP) to higher (Nikkei +0.84%), EU and UK share markets are all higher (SX5E +0.95%) while ES futures are showing +0.2% here at 7am. Our overnight US rates flows saw better real$ buying (intermediates mostly) as prices sagged during Asian hours on the passing of the debt ceiling in the House. Our Tokyo desk noted that this morning's session was one of the more active sessions of the past few months. Overnight Treasury volume was about average overall (the London session appeared more subdued than that in Asia's hours) with 3yrs (140%) seeing the highest relative average turnover this morning.
Treasury 10yrs, daily: Held trend/channel support last week near 3.83%; still working off a deep 'oversold' conditions after that successful test of support. The former range highs (~3.642%) acting as a minor near-term resistance as prices correct higher. Bullish short-term bias still.
… and for some MORE of the news you can use » IGMs Press Picks for today (1 JUNE) to help weed thru the noise (some of which can be found over here at Finviz).
From some of the news to some of THE VIEWS you might be able to use… here’s what Global Wall St is sayin’ …
First up from ZH (which ultimately does reflect some of what Global Wall St is saying / thinking and doing so without THE filter, if you will),
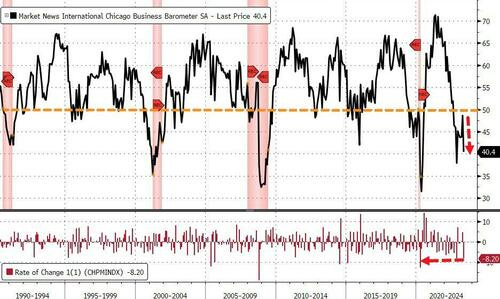
ZH: Chicago PMI Unexpectedly Plummets, Longest 'Contraction' Streak Since Lehman
AND on JOLTS
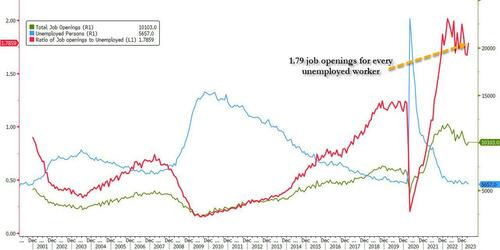
ZH: US Job Openings Unexpectedly Soar Above Highest Estimate Even As Number Of Quits Tumble
… Said otherwise, after dropping to just 1.64 job openings for every unemployed worker, the lowest since Nov 2021, in April there were 1.79 openings for every worker, a sharp spike back to levels that the Fed does not want to see.
To be sure, none of the above data are credible for reasons we have discussed before but the simplest one is because the response rate of the JOLTS survey is stuck at a record low 31%. Which means that only those who actually have job openings to report do so, while two-thirds of employers are either non-responsive or their mail is quietly lost in the mail…
So perhaps the data DOES lend some credability to a pause, which then refreshes. Perhaps something (else) will break and give rate CUT bets a new lease on life.
Now from the snark to the ACTUAL inbox … I think it’s best to start with an updated (ie CHANGED) FED CALL from large British bank,
With the accumulation of data indicating a continued tightness in the labor market, resiliency in consumer demand and signals from recent Fed communications, we expect the FOMC to proceed with two additional 25bp hikes in coming meetings, bringing the target range to 5.50-5.75% by the end of the year.
… In our view, the stronger-than-anticipated activity, labor market and inflation, as well as the smaller-than-expected tightening in lending conditions observed so far, reveal that monetary policy is not as restrictive as we and many FOMC participants had been expecting. At this point, we assess that the FOMC may have to increase the path for the funds rate by 50bp, bringing the target range to 5.50-5.75% at the end of the year, in order to bring inflation back on track toward the 2% target. To the extent that households and firms are expecting higher inflation following the stronger-than-anticipated data releases, the FOMC would need to raise the funds rate path by more than inflation expectations in order to exert a more restrictive policy stance.
Consequently, we now expect additional monetary policy tightening in the next few FOMC meetings. Specifically, we now expect the FOMC to deliver two additional 25bp hikes in its upcoming meetings, though we lack strong conviction about the timing. If the employment report turns out to be sufficiently strong on Friday (e.g., a 250k payroll gain showing little slowing from the prior month), then we would expect the FOMC to hike in June. If we see a weak employment report, we would view a June skip as the more plausible outcome, with hikes taking place in July and a future meeting.
AND SO … now you know what they think they think and what they think they dunno.
Question — have they mea culpa’d ‘nuff and covered all necessary bases so no matter WHAT happens, welp, someone, somewhere can / will say … they told us so.
In any case, sellsidin’ is hard. Moving along and as the month of May is now fully rear-view mirror, a large German shop with its monthly performance review notes,
…Which assets saw the biggest losses in May?
… Sovereign Bonds: For the most part, sovereign bonds struggled in May. US Treasuries fell -1.2% over the month, and UK gilts were a particular underperformer with a -3.8% decline. In Europe the returns were more mixed, with Eurozone sovereigns did managed to see a +0.5% advance, but only thanks to a sharp recovery at the end of the month.
And from May to JUNE where the next question on some stock jockey’s minds,
A June swoon may be in the cards as the S&P 500 struggles to clear key resistance at 4,200.
While a deal in Washington could be a catalyst for a breakout, overbought conditions in the technology sector and mega-cap space—the primary drivers of this year’s market advance—could make this a high hurdle for the market to clear on a near-term basis, especially without broader participation.
The technical setup for the technology sector remains bullish, but the rally may be a little too much too fast as overbought conditions are now widespread.
The good news is that if there is mean reversion, it would likely be back toward the sector’s uptrend and provide a potential pullback opportunity for investors seeking a better entry point into tech.
Don’t expect any seasonal tailwinds for stocks next month. June has historically been an underwhelming month for both the S&P 500 and the technology sector.
… Seasonality Don’t expect any seasonal tailwinds for stocks next month. The S&P 500 has generated average and median price returns during the month of 0.0% and 0.1%, respectively, making it the fourth worst-performing month since 1950. Furthermore, the index has only produced positive returns 54.8% of the time during June. For additional context, the S&P 500 has posted average monthly returns of 0.7% and finished positive 61% of the time for all months since 1950.
AND interrupting a walk through the calendar for a couple charts that struck HER eyes also caught mine and so,
MS: From the Global Director of Research: Charts That Caught My Eye
… (4) US Consumer: Our AlphaWise survey points to weakening sentiment; we map discretionary categories most at risk.
Confidence in the US economy and household finances is deteriorating, according to our latest AlphaWise survey of ~2,000 US consumers (which ran May 19-22). More than half of the respondents (54%, up from 49% last Source: AlphaWise, Morgan Stanley Research month) expect the economy to get worse in the next six months, and just 25% (vs. 27% last month) expect the economy to get better. Consumers’ outlook about their own household financial situation also is trending down, with 26% of respondents expecting household finances to get worse in the next six months (vs. 24% last month), while 40% (down from 42%) expect finances to improve. These outlook scores show a high correlation to the University of Michigan Index of Consumer Sentiment. AlphaWise also asked consumers to: (1) rankorder categories based on spending priority, and (2) identify categories where they would likely pull back on spending if they were forced to reduce household expenses. Travel (airline and lodging) and live entertainment appear most at risk, while apparel and restaurants would be more resilient; the results were similar at all income levels
Another chart which caught MY eyes is from NWM
NWM: China-Russia dynamic obscures tepid global trade trends
Global trade volumes rebounded in March, rising 1.5% m/m following a -0.8% m/m fall in February. The stand-out driver was Chinese exports, up 19.9% in volume terms – trade with Russia is booming (for now). Globally, however, underlying trade patterns and forward-looking indicators remain muted, with 3m/3m growth still contracting, albeit at a less rapid rate: -0.9% from -2.4% in February.
The durability of the Chinese recovery in trade is uncertain. The data are highly volatile at this juncture: Chinese export values fell 6.4% m/m (non-seasonally adjusted) in April after a 47.5% surge in March, lowering the annual growth rate to 8.0% from 14.3%. Early Asian regional trade data and activity at ports remain distinctly lacklustre.
Ok then, trade is getting somewhat LESS BAD. From TRADE tracking to the MARKETS and a note from a large German bank
…The forecast and portfolio Our rate forecast entails a sharply lower 2y yield at year-end alongside a modestly higher 5y5y rate. Our macro portfolio is positioned for these outcomes.
Specifically, we have the 2y dropping to 3.15% in Q4 driven by recession and anticipated Fed cuts, with roughly even odds on the Fed easing meaningfully below neutral. At the same time, our projection has 5y5y moving up modestly from current levels, supported by r* above consensus expectations and rising term premia driven by normalization from historically low levels, increases in global bond supply, and ongoing upside inflation risks.
…While unusual by broad historical standards, there are episodes of notable drops in the 2y being accompanied by increases in 5y5y – that is of observations in the northwest quadrant of the scatter in Figure 1 (they've been labeled with dates in Figure 2)…
From a couple / few charts which was eye-catching TO a debt ceiling bill writeup,
We expect cuts in nondefense discretionary spending from the debt ceiling deal negotiated over the weekend to amount to only a small drag on activity. Although the diminished fiscal impetus will complement the FOMC's efforts to slow demand, the implied reduction in rates is likely to be fairly modest.
Another aspect of the bill which is nearing is full passage,
GS: Student Loan Payments After the Pause: A More Than Manageable Headwind
This summer should bring two changes to federal student loan policies. First, the Supreme Court looks likely to rule on the Biden administration’s student loan forgiveness plan. We think the court is more likely to block the plan, but if it stands the program could discharge around $400bn (1.5% of GDP) in student loan balances, which we estimate would reduce student loan payments by 0.1% of income.
Second, the debt limit agreement prohibits the Biden Administration from extending the pause on student loan repayments that has been in place since March 2020. Under the agreement, payments would resume in September 2023, which we estimate would increase student loan payments by 0.3% of income.
On net, the end of the student loan payment pause is likely to more than offset any boost to consumption from the student loan forgiveness plan. However, in either case, the impact on spending is likely to be modest in the medium-term. We estimate student loan repayments will subtract 0.2pp from PCE growth this year if the student loan forgiveness plan is struck down or 0.1pp if the plan stands.
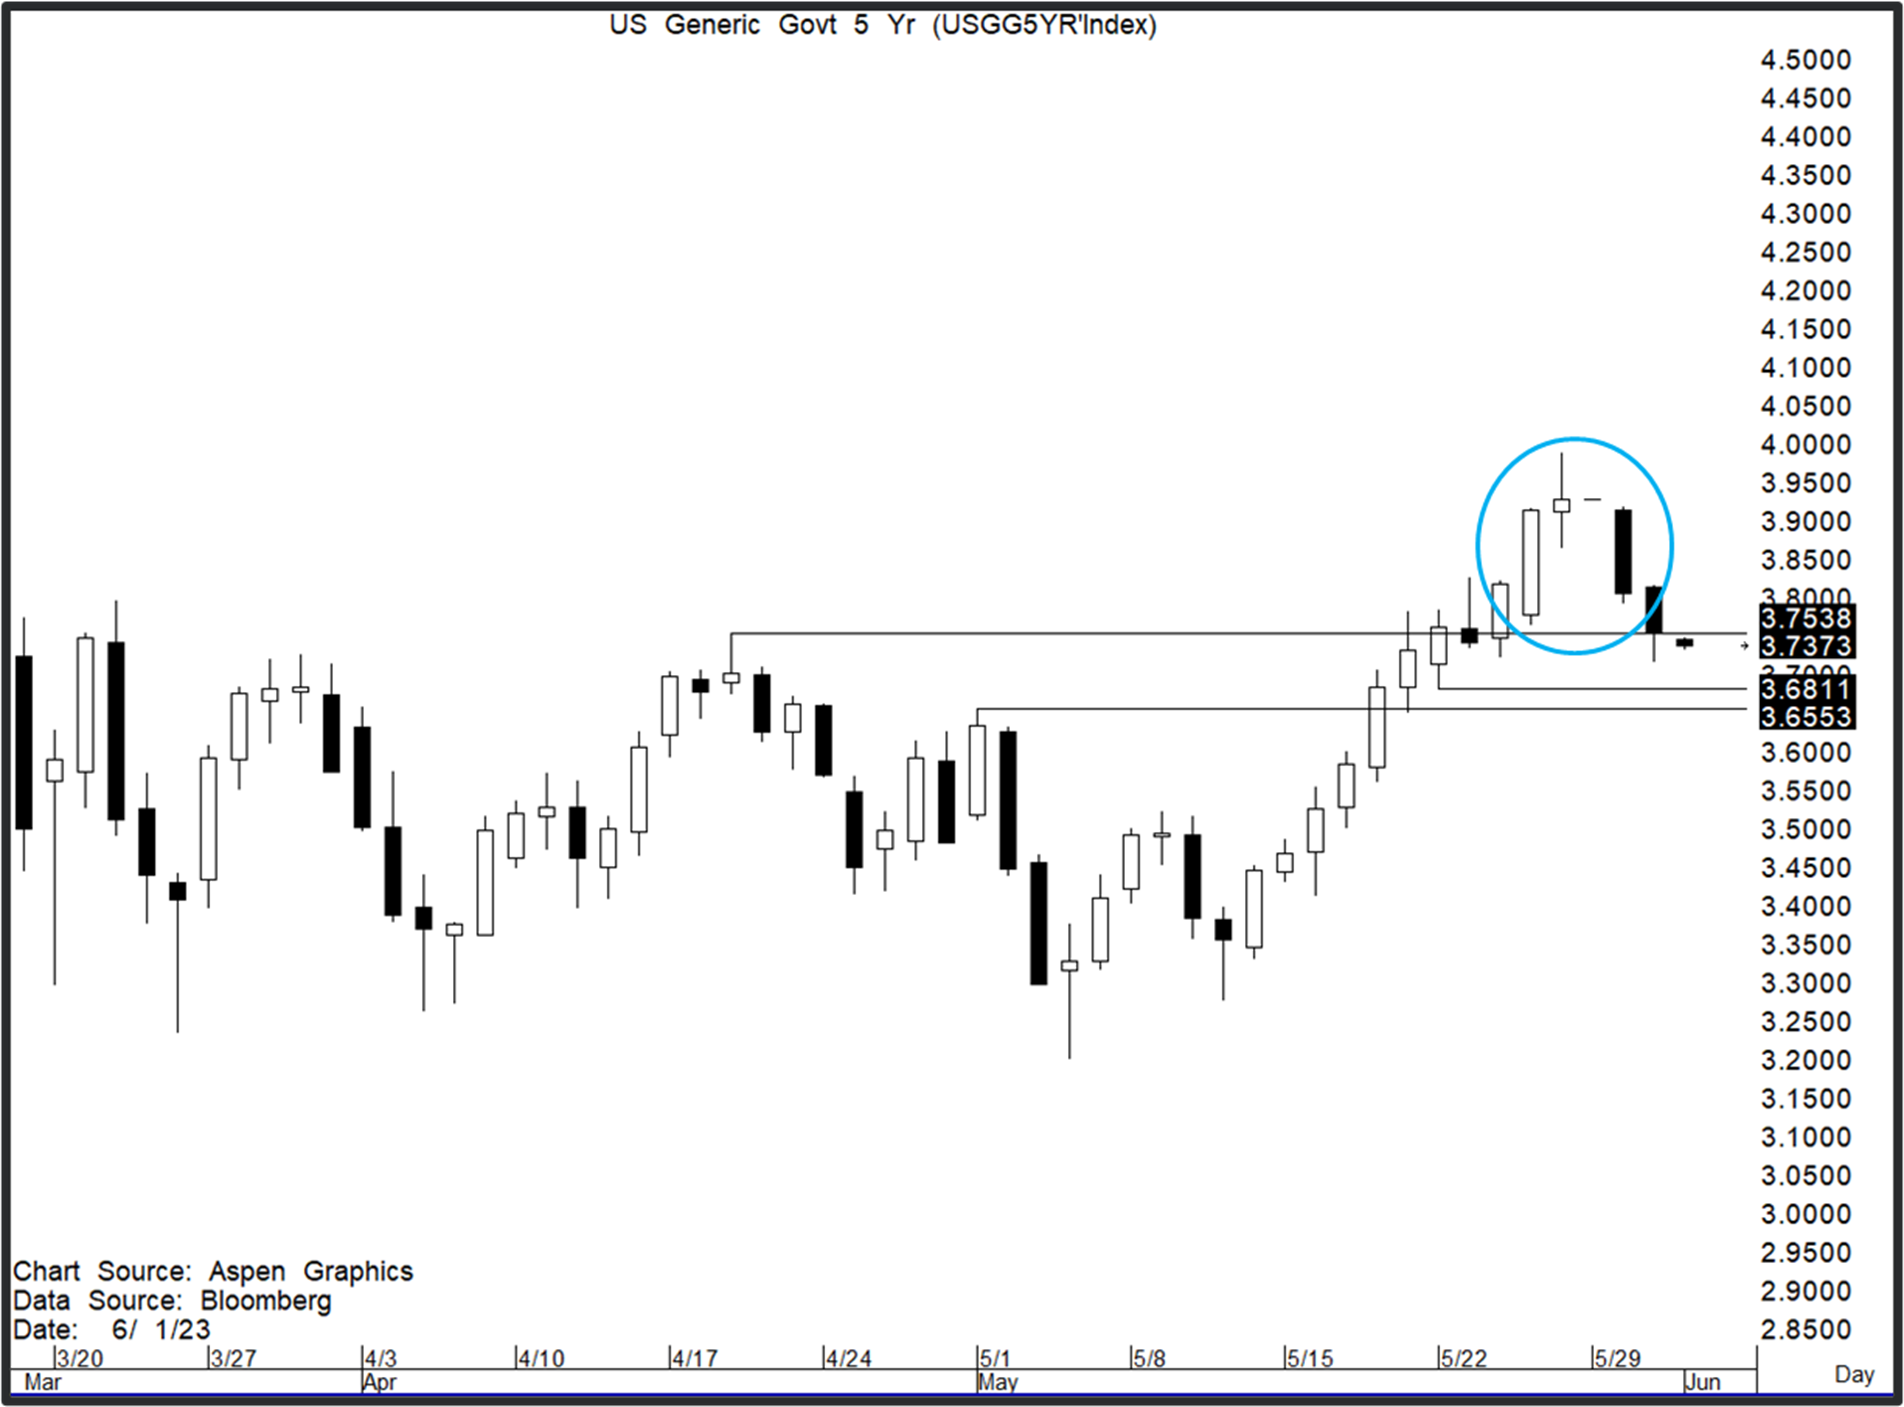
Finally, in closing a chart hitting inboxes last night just about 11p … is the belly at a turning point?
US 5yr: We saw an evening star on US 5y yields at the top of the trend earlier this week, and tested the key 3.75% level on Wednesday. This was previously the double bottom breakout level that had earlier suggested a topside acceleration. With the current indications, we think a close (preferably a weekly close) below the 3.75% level could be indicative of the rally having peaked.
OTHER TECHNICAL DEVELOPMENTS WORTH NOTING
US 10yr: Currently, the other most indicative yield chart. Yields are now testing resistance-turned-support at 3.65%-3.64% area. This was previously the double bottom neckline that had indicated the recent rally…
Last time THEY suspended the Debt Ceiling, August of 2019....well, we should all remember what happened next. I can't help but wonder what surprises are instore for us all prior to 2024 election....


Last time THEY suspended the Debt Ceiling, August of 2019....well, we should all remember what happened next. I can't help but wonder what surprises are instore for us all prior to 2024 election....