Good morning … I’ve NO idea what happened while we slept as I’m on the road (mentioned at the end of YESTERDAYS note) and so, I’ll be brief.
I’m having this note sent out in lieu of the regularly scheduled update with another reference TO something else you’ll find at the end of YESTERDAYS note … namely, THIS …
I’d HIGHLY recommend a read through and while the conclusion may be very much as one might expect, the JOURNEY is once again, truthfully worth the excercise.
Agree or NOT with his conclusions, you’ll have to admit (or don’t, thats fine) the facts, analogs and links offered are worth pausing to at very least, consider.
Because, you know, what IF he’s … not wrong. Enter,
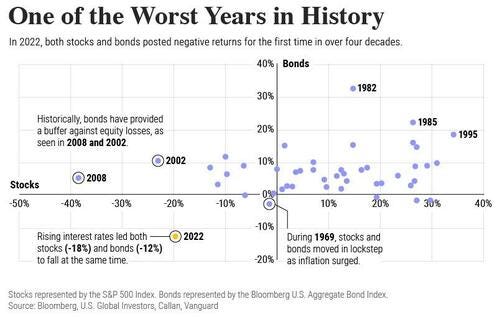
To understand how 2022 was an outlier in terms of asset correlations we can look at the graphic below:
The last time stocks and bonds moved together in a negative direction was in 1969. At the time, inflation was accelerating and the Fed was hiking interest rates to cool rising costs. In fact, historically, when inflation surges, stocks and bonds have often moved in similar directions.
Underscoring this divergence is real interest rate volatility. When real interest rates are a driving force in the market, as we have seen in the last year, it hurts both stock and bond returns. This is because higher interest rates can reduce the future cash flows of these investments.
Adding another layer is the level of risk appetite among investors. When the economic outlook is uncertain and interest rate volatility is high, investors are more likely to take risk off their portfolios and demand higher returns for taking on higher risk. This can push down equity and bond prices.
On the other hand, if the economic outlook is positive, investors may be willing to take on more risk, in turn potentially boosting equity prices.
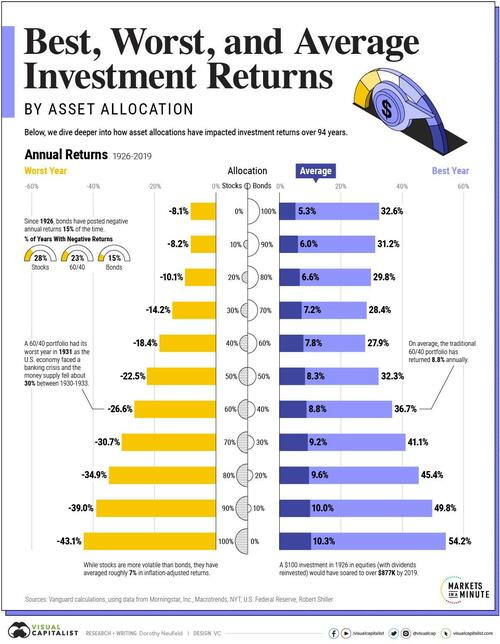
Current Investment Returns in Context
Today, financial markets are seeing sharp swings as the ripple effects of higher interest rates are sinking in.
For investors, historical data provides insight on long-term asset allocation trends. Over the last century, cycles of high interest rates have come and gone. Both equity and bond investment returns have been resilient for investors who stay the course.
And that … is all for now. Have a great start to the day and end of the week…


How's about that 1 month T-Bill action yesterday LOL!