(USTs higher / STEEPER on average volumes) while WE slept; supply of money and the REAL 'other' deposit liabilities of commercial banks (latest HIMCO missive...)
Good morning … John Williams of the FRBNY gave A SPEECH last night to the Money Marketeers last night and one of the comments (via ForexLive) stood out to me,
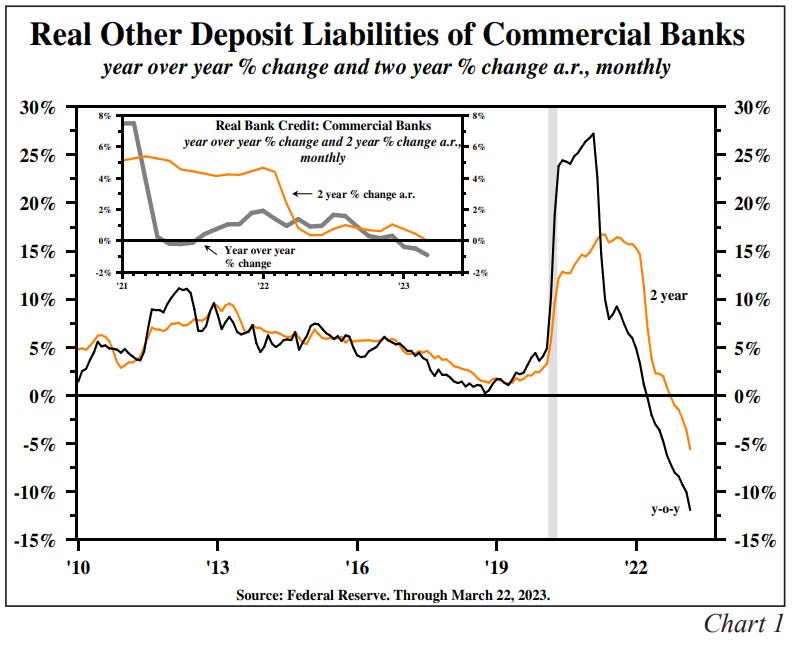
Drop in money supply tracks with tightening monetary policy
And with that tidbit in mind THIS CHART (more on it below),
More in a moment … as you allow that visual to sink in, here is a snapshot OF USTs as of 723a:
… HEREis what this shop says be behind the price action overnight…
… WHILE YOU SLEPT Treasuries are higher and the curve is steeper as stocks US/European falter and after yesterday's failed bearish breakouts in a number of Treasury benchmarks (see discussion below). DXY is lower (-0.18%) while front WTI futures fade further (-1.6%). Asian stocks were mixed and little changed on balance, EU and UK share markets are all lower (SX5E -0.5%) while ES futures are showing -0.65% here at 7am. Our overnight US rates flows saw yet another quiet Asian session (been 2 weeks like that) with modest real$ buying seen in the front end. In London's AM hours, buying out the curve was seen just after the crossover with flows later flipping to selling from systematic names in the long-end. Overnight Treasury volume was about average overall this morning.
… The idea was that it may be tough to break and hold above yield support levels under such conditions where the daily closes might further inform us whether the bear moves were corrective or sustainable. Yesterday's failed bearish breakouts (by BBG's 5pm closes) scored one for the bull correction camp that we still inhabit.
Let's build on that thought, via pictures in the order of this morning's attachments. Our first attachment looks at yesterday's failed breakout attempt above the ~4.255% support area in Treasury 2yrs. Do note in the lower panel that daily momentum (Slow Stochastics, our preferred measure, is shown) now sits at 'oversold' levels where the oscillator lines are flattening out and converging. This is what you see before a bullish flip but, more importantly, it's also an indication that the investor flows around this 4.25% area are becoming more balanced. Balanced flows do not drive bear trends.
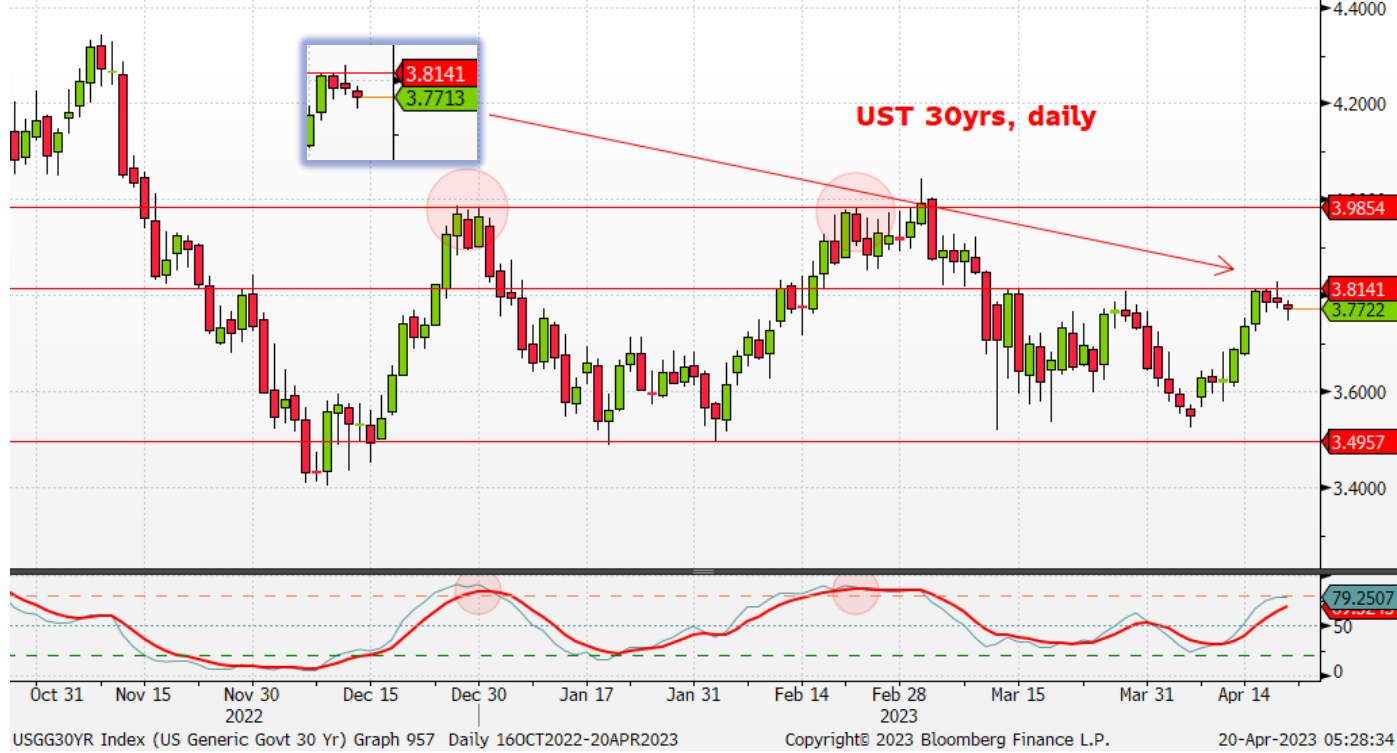
Our next attachment shifts out to the Treasury 30yrs which saw similar price action around its 3.815% support area. In the shadow box we zoom in on the last few sessions where yesterday's push above ~3.815% was rejected and, presumably, met with on-balance buying. The potentially more consequential range support (3.985%) and resistance (3.52% down to 3.49%) levels are drawn in for reference... Both charts leave the same story: the market does not appear willing to accept levels above these supports absent, say, data or supply that supports such an excursion?
… and for some MORE of the news you can use » IGMs Press Picks for today (20 APR) to help weed thru the noise (some of which can be found over here at Finviz).
From some of the news to some of THE VIEWS you might be able to use… here’s what Global Wall St is sayin’ … But first, what’s a day without a kickstart from Zerohedge?
ZH: Solid Demand For Tailing 20Y Auction As Kink Persists
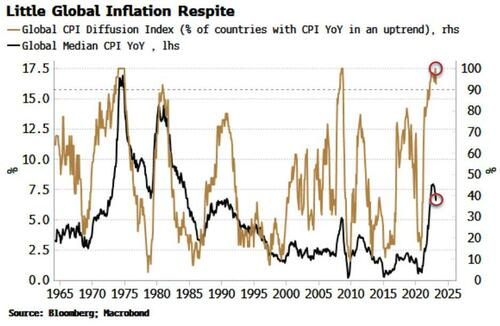
Global median inflation rate has fallen from its peak, but all major countries are still in an inflationary uptrend, keeping several central banks in tightening mode for now.
UK inflation surprised to the upside again, highlighting a global problem. The global median CPI rate has only marginally fallen from its recent peak. And the percentage of major EM and DM countries whose year-on-year CPI is in an upwards trend is back at 100% after a brief dip.
Inflation is living up to its reputation of being like toothpaste – easy to get out of the tube, but difficult to put back in.
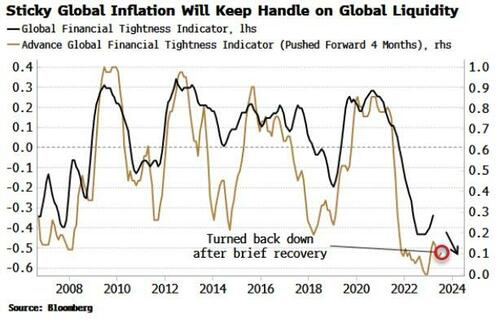
Central banks, especially those further behind the curve like the BOE and the ECB, are keeping their foot on the brake, but becoming more circumspect given the growing risks to financial stability from higher rates.
This is leading to a continued squeeze on global liquidity. The Global Financial Tightness Indicator (GFTI), essentially a diffusion of global central-bank rate hikes, had started to rise, suggesting liquidity conditions were beginning to ease.
But the Advanced Global Financial Tightness Indicator, which gives a four-month lead on the GFTI, has turned down again, suggesting the GFTI will soon do likewise.
This will be a continued headwind for global assets and inhibit economic growth.
This is part of the plan, of course, to quell inflation, but the risks from unintended consequences are manifest, and central banks will almost always only know they have pushed too far after the fact.
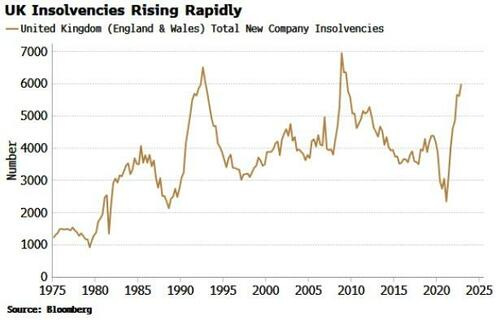
In the UK, the BOE will be mindful of the cumulative build-up of borrowers coming off fixed-rate mortgage deals and paying significantly higher rates.
At some point this will bite. There are already signs of distress, though, with a marked pick-up in insolvent companies.
We’ll come back TO the idea of LIQUIDITY in a moment…
To the Global Wall St inbox where a note on global cycle has arrived from a large Swiss operation,
The global industrial acceleration that has supported risk appetite this year looks to be in its dying stages. We expect global industrial production momentum to peak above 3% in May before declining into Q3. We have a high conviction calling a peak because the drivers of the recent acceleration – Chinese reopening and easing European energy stress – are unsustainable.
After the May peak, tighter global financing conditions are set to bite. Tightening credit standards will likely further weaken goods demand against an already tough backdrop. We now expect global industrial production to stagnate in H2, ushering in a period of negative growth surprises.
The rollover in the global cycle points to weaker risk appetite. Our Global Risk Appetite index enters the coming slowdown at a two-year high. The embers of the global growth acceleration could sustain strong equity returns in the near term, particularly if disinflation accelerates. But we suspect lower rate expectations will struggle to outweigh weaker growth deeper into the year.
Growth and inflation dynamics should remain supportive of bonds. When growth and inflation fall together, as we expect in Q2, bonds outperform. Some of the potential rally may have been pulled forward into Q1, but history suggests there is further left to run.
With THAT — supportive of bonds — notion in mind, a bit of a counterpoint from LPL
… If the debt ceiling isn’t resolved in time though, the U.S. Government would technically default on its contractual obligations and the Treasury market is starting to price in, however remote, a chance of delayed payment. Treasury bills (t-bills) that mature in May are yielding around 1.2% less than t-bills that mature one month later (around June) and a record 1.49% less than t-bills that mature in July. As Treasury is likely able to make the May payment, investors have bid up the price of these securities seemingly at the expense of debt that matures around the expected x-date(s). While changing monetary policy expectations and a record amount of money in money market funds are also playing a role in the distortions, investors are likely demanding more to hold those securities at risk of delayed payment.
U.S. bond market investors have taken for granted the government’s ability and willingness to pay its debt. While its ability to repay its obligations is not in question, the debt ceiling debate complicates the country’s willingness to pay its debts. In 2011, Congress waited until the very last minute to fix the debt ceiling issues and S&P downgraded the country’s debt rating to AA+ from AAA because of the questions surrounding that willingness to pay its obligations. Now, another rating agency, Fitch, has threatened to do something similar if Congress fails to act soon. Another debt downgrade would likely be disruptive to financial markets. While we think Congress will act in time and get a deal done, these games of political chicken can introduce volatility to markets in the interim. For more information on the debt ceiling, check out our February 27 Weekly Market Commentary.
Ok so perhaps ALL are correct — supportive of rates out the curve while in the very short term, the … well … very short maturities aren’t sure WHAT to think and so, are pricing a bit of uncertainty.
And on that note — a bit of clarity (or perhaps it is a smoke screen from Global Wall Street) — and the idea of ANIMAL SPIRITS are CONTINUING to reflect this uncertainty. Wells,
The Animal Spirits Index (ASI) increased to -0.13 in March, up from -0.31 in February. Through March, the ASI has been negative for 15 straight months.
The S&P 500, VIX and Consumer Confidence indices were additive to the ASI in March, while the yield curve and Economic Policy Uncertainty Index were subtractive.
We continue to look for the U.S. economy to fall into a recession in the second half of this year, which will put downward pressure on the ASI in the coming months.
… The ASI consists of five indicators: the S&P 500 index, the Conference Board’s Consumer Confidence Index, the yield curve (the spread between the 10-year and three-month Treasury yields), the VIX Index and the Economic Policy Uncertainty Index. The policy uncertainty and VIX indexes inversely effect the ASI. In other words, a rise in uncertainty or volatility decreases the index, while a fall increases the index, all else equal.
All else equal … and it rarely is as we all know.
On that note — we KNOW all is NOT equal with regards to portfolios and asset class weightings and most of 2022 will be written in the history books as PROOF 60/40 is DEAD. And on THAT, Ritholtz,
Sorry, but all of these headlines utterly miss the point. No, the 60/40 mix of stocks and bonds is not dead; No, this is not the first time we had a regime of high inflation, transitory or otherwise.
The 60/40 is not “back” because it never left…
… I find Vanguard’s take to be more in line with my own: Improved outlook for the 60/40 portfolio. Meaning, with rates nearing the terminal value, bonds now generate decent yield as well as provide ballast against the volatility of the equity portion of your portfolios.
I have read endless screeds the past few years as to the return of the active investor and why passive is definitely going to fail this cycle. It’s amazing how much enthusiasm gets generated when almost half of active managers outperform for a quarter or two…
Read on, click links and in as far as that ‘40’ goes, a few thoughts on WHY long bonds might fit … the moment some / many (ok, is it really just me?) have been waiting for …
… I’ll be completely honest with you — this one is, as others, printed and should likely be read while marinating a few ice cubes with your favorite beverage. It is likely the deepest 5pgs (6 with disclaimer) you might stumble across on all of these intertubes and ultimately, it’s conclusion will NOT come as any surprise to anyone,
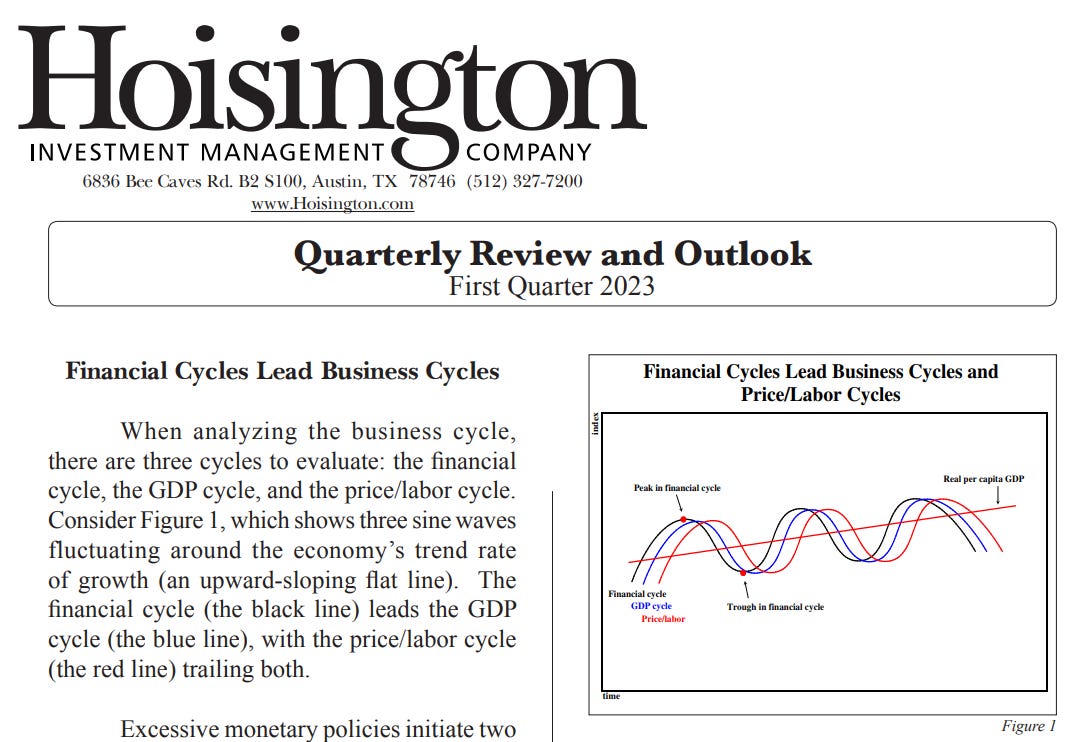
Outlook The risk of a recession continues to rise, even though the economy grew in the first quarter. The Fed has neutralized the inflationary impact of the fastest modern era money growth in 2020-2021. Other deposit liabilities (ODL), in real terms, have registered a double-digit decline in the 12 months ended March, with the 24-month change at a negative 5% (Chart 1). Over the past 12 months, real bank credit had declined even before the recent, and highly visible, bank failures and is now unchanged for the past 24 months. Although monthly data is not available before World War II, the latest 12 month decline in M2 is undoubtedly the sharpest since 1934.
Two considerations suggest that the rise in velocity in 2022, and the first quarter of this year, which has thus far interfered with the Fed’s efforts to contain inflation, will reverse. By formula and statistical estimation, velocity lags the business cycle. Since V equals GDP (a coincident variable) divided by money (a leading variable), V must definitionally lag. Econometrically, velocity is determined by the marginal revenue product of debt and the loan to deposit (L/D) ratio, both of which are lagging indicators. The econometrics would be highly questionable if V were determined by leading indicators.
With $10 trillion of total U.S. debt being rolled over this year, and an equivalent amount in 2024, the marginal revenue product of debt is set to decline late this year and in 2024. Allocating cash flow from debt funded projects to interest payments is the least productive use of these resources. While the L/D ratio rose in the first quarter and in 2022 as well, it is a lagging variable with its trough an average of 47 months after its recessionary peak. Under the weight of faltering business conditions, loans will follow and the so will the L/D ratio. When velocity turns down, monetary policy will have very little capability to stimulate economic activity. The well-known “pushing on a string” predicament will be totally insufficient to describe the situation that lies ahead.
Accordingly, with low or declining economic activity, the inflation rate will continue to recede. Further progress will be made in terms of moving consumer inflation into the Fed's target zone in 2024. Therefore, with the historical pattern of the financial, GDP and price/ labor cycles proceeding on its well documented path, this year’s decline in long-term Treasury bond yields is expected to continue.
Let that settle.
As you do … a SCHEDULE update — there will be NO output tomorrow (please, no cheering) as I will be traveling and HOPE to get some thoughts out ahead of Sunday evenings market opening.
Thanks in advance for your patience BUT please reach out if you’d like a refund … Oh wait, nevermind … THAT is all for now. Off to the day job…


😀
That was another impressive post. Must be a lot of work. Perhaps you might consider hiring this eager young assistant, https://thequantuminsider.com/2023/04/13/chatgpt-4-receives-b-on-scott-aaronsons-quantum-information-science-final-immediately-emails-the-dean-seeking-a-better-grade/ ?