how tight is The Fed? maybe NOT as tight as you might have thought (WSJ); ALSO a few other things (upwardly revised yield f'casts, rates of change and 11 charts of the 'stunning recovery' ...
Good morning / afternoon / evening - please choose whichever one which best describes when ever it may be that YOU are stumbling across this weekends additional note …
Nick Timiraos (WSJs Fed-watcher) brings me in to your inbox on heels of yesterday’s anniversary(s) because of this tweet …
How tight is the Fed’s policy? Economic growth suggests it’s not as tight as many would have imagined two years ago, but it’s possible a supply side boomlet has merely shielded the economy from higher rates in ways that might not last.
The Fed’s Challenge: Has It Hit the Brakes Hard Enough? Resilient economy weakens argument that monetary policy is too tight, but that could soon change
When the Federal Reserve began sharply raising interest rates two years ago, the prospect of mortgage rates hitting 7% terrified Dwight Sandlin, a home builder based in Birmingham, Ala. “I was scared to death. Scared. To. Death,” he said.
He just booked his most profitable year ever…
… The challenge of unscrambling conflicting signals explains why officials are focusing on what happens with inflation. If inflation continues to move lower, “you could say, ‘Why keep rates where they are?’” said Kashkari, the Minneapolis Fed president. But if the economy is expanding solidly, it is fair to ask “why do anything?”
… Okie dokie so there ARE two sides to this story detailed within, to be sure BUT … drawn like a moth to a flame TO the headline and so, maybe we’re NOT as tight as we thought which then means NO rate CUTS? Hikes coming? Hikes or fewer / less immediate cuts then does WHAT to #MagCOVER indicator noted HERE yesterday?
Forget it … lets leave the WSJs Timiraos aside and head TO … the WaPO (said nobody ever … just kidding in case any fans or writers peekin’) … This breakin news just in …
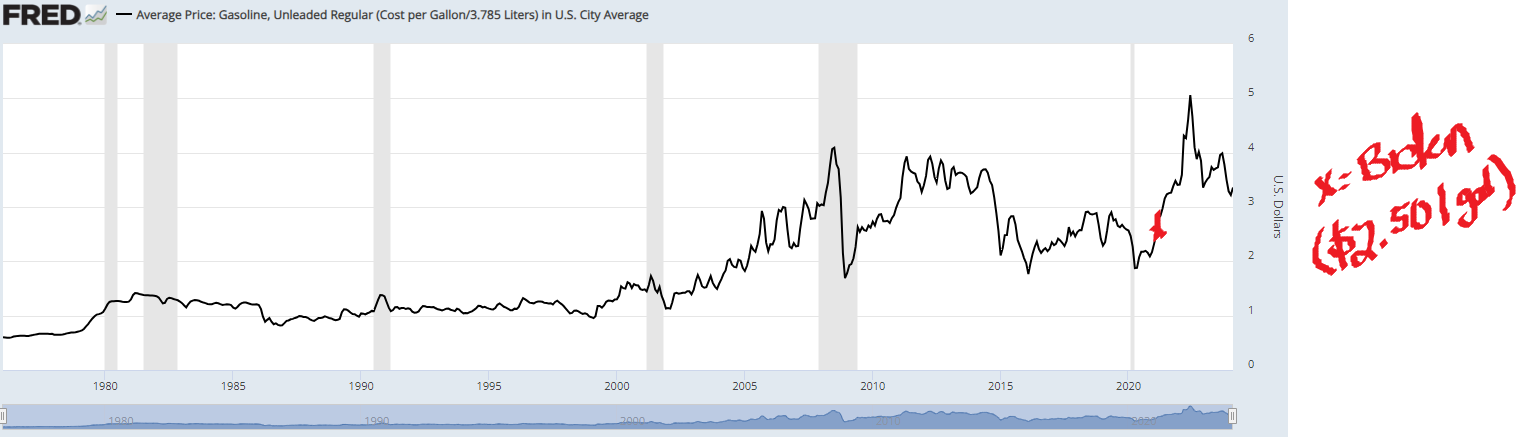
WaPO U.S. News Alert: America’s stunning recovery from the covid crisis, in 11 charts (#6, groceries … this stinks, number 7, gas prices, not much better but they certainly working hard to make it appear not so bad…)
Four years ago this week, the first wave of what would grow to be 20 million job losses set in, although most Americans were more terrified of catching a new, very transmissible and sometimes fatal virus. After a pandemic-fueled roller coaster, a new normal has settled into the U.S. economy — one that nobody could have predicted four years ago.
… dunno, ‘bout you BUT GAS prices at least, better but better is NOT equal to good…way back then, AAA nat’l avg was approx $2.50 and today, via FRED, up nearer $3.36 …
… which best I reckon is nearly 35% increase? Now please don’t heckle if I’ve gotten the math wrong — I don’t do math on weekends AND no longer have handy dandy economic workbench offered by The Terminal for low low rate of what, nearly $25k per year …
Anyways, in the same way that rate CUTS do not … repeat NOT … equal an ease, better here still far from good, right? Whatever …
Dunno ‘bout you but I cannot wait to see what they’ve left to say and cook up in the morning.
HOPEFULLY not much and so, in addition TO couple news items AND what was cobbled together and offered to y’all HERE yesterday, here’s couple more things from Global Wall St inbox
We expect the BoJ to exit NIRP this week. However, with this largely in the price, we like USDJPY longs into the event.
The focus of the Fed meeting will be on the dots. We explore what will happen to the curve in various permutations.
It’s also AI week. We like SPX topside to position for another potential AI-fuelled momentum rally.
JPMs Global FI Weekly (specifically for section / excerpts on UPWARD REVISIONS to UST yield f’casts which then makes them … more bullish? bearish? am so easily confused … guess the answers lies within some sorta ‘duration neutral’ butterfly — not easily accomplished but certainly makes one feel as though capital is deployed and simply cannot be lost — which we all KNOW is a false sense of security and why ‘they’ are called surprises … )
…May the dots rise up to meet you?
The sharp rise in Treasury yields this week reflect the primacy of inflation data in informing the expected path of policy in coming months as yields sit near their highest levels in more than 3 months
The FOMC meeting looms on Wednesday: the Fed could raise its SEP to reflect stronger growth and higher inflation, and risks point to fewer cuts projected in 2024 and over the longer run but it will be hard for the Chair to deviate too sharply from his recent comments...
...This implies bearish risks to yields over the near term, but OIS forwards have priced a later start and less dovish path for easing in 2024, and intermediate Treasuries appear cheap after controlling for their fundamental drivers, and we do not recommend chasing higher yields here
We revise our interest rate forecasts higher to reflect a more gradual Fed easing cycle: we raise our year-end forecast for 2-year yields by 35bp to 4.15%, and our year-end 10-year forecasts by 20bp to 4%
Add 3s/5s/7s belly-richening butterflies for carry …
… . Further out the curve, Treasury valuations also appear cheap in the context of their fundamental drivers: 10-year Treasury yields are trading 20bp too high after controlling for the market’s medium-term Fed policy, inflation, and growth expectations, as well as the Fed’s share of the Treasury market (Figure 102.and itermaTsuie parsomewhat cpferontlig forthei fundametl rivs). Accordingly, with yields at the cheap end of the ranges they’ve held since late last year, OIS forwards pricing a less dovish path for Fed policy in 2024, and valuations somewhat cheap, we do not think yields will release significantly higher from current levels and are not willing to add bearish trades at current levels.
Goldilocks: Global Economics Comment: Modest Incremental Increases in Unemployment Would Likely Trigger Earlier Rate Cuts (payin’ attention here, as Global Wall continues to try and appear as though they are AHEAD of the curve but in fact, they are only moving the goalposts a bit, here and there, workin’ round the edges … dunno … reading and keeping in mind cuz, you know, maybe they’ll be right …)
■ Global labor markets remain healthy, and low unemployment rates are one reason why DM central banks have remained patient on rate cuts. We forecast that unemployment rates will not meaningfully rise in 2024, and that most major DM central banks will remain on hold until June, at which point inflation progress will justify the start of rate cut cycles.
■ But with labor markets largely rebalanced, even a modest increase in the unemployment rate would likely to prompt a monetary policy response. After all, an unexpected rise in the unemployment rate has historically been the single strongest predictor of policy easing.
■ To quantify the risk that unexpected unemployment rate increases prompt earlier rate cuts, we estimate how much of an increase in unemployment would shift the market to fully price consecutive 25bp cuts at each meeting for the rest of 2024 (assuming cutting cycles start in June and other relevant indicators evolve as expected).
■ Across the DM central banks, we estimate that an incremental increase in the unemployment rate of 0.2-0.3pp would be sufficient to justify fully pricing three consecutive cuts, and an incremental increase of 0.3-0.6pp would justify pricing five consecutive cuts through year-end. These thresholds are lowest for the ECB and highest for the BoE, with the Fed and the BoC in between.
■ While our baseline remains that inflation progress will be the main driver of rate cuts, our finding that modest incremental increases in unemployment would likely ensure earlier easing supports our view that risks around our baseline forecasts and market pricing are skewed toward lower rates in most DMs
DM Labor Markets Remain Very Healthy, and Unemployment Rates Remain Low Under Our Baseline Forecasts
MS Sunday Start | What's Next in Global Macro: The Great Unwind: A Framework for Central Bank Balance Sheets (good read ahead of the big week ahead with Fed and BoJ… frankly, i’m just here for the pictures … sorry. not sorry …)
… QE was a key feature of monetary policy during the global financial crisis and in the response to Covid. The rallies that started with the recovery from each coincided with central banks expanding their balance sheets. As a result, investors have focused on the correlation between central bank balance sheet size and asset prices. The past couple of years have demonstrated that those correlations are not stable and any link that exists is far from clear. So we have focused on the mechanics, which are clear.
Exhibit 1: Global central bank balance sheets grew by just shy of $12 trillion from December 2019 to their peaks, While they have since contracted by $5 trillion, we forecast an additional contraction of $4 trillion through 2025
… And from Global Wall Street inbox TO the WWW,
at JimBIANCO (LinkedIN on rate CUTS leaving the building …)
Prepare yourself! We are very close to a screaming red headline that the market has priced out (below 50%) a June cut (blue). After this week's Payroll, CPI, and PPI beats, it is at just 54% (see the March 7 vertical dotted line).
If June falls below 50%, I think July (red) will eventually fall below 50% (again, it's too political to START then; it's between the conventions) unless the market and/or crude oil collapse or some other unforeseen crisis changes this equation.
Activate to view larger image,
Murphycharts: Silently Winning (along with energy charts — thank Bidenomics for price of gas or NOT — Murph’s got a single chart of 10s worth noting … RATES OF CHANGE always have me at hello. it’s math … it’s science …)
… Energy still only accounts for a 3.7% weighting in the S&P 500 Index. It’s crazy to think that only a few decades ago, several top 10 names in the S&P 500 Index were from the Energy sector! Energy commodities and energy companies can be a great portfolio diversifier, especially in today’s world as technology dominates the global equity market.
I’ll end with a chart of the US 10-year Treasury Yield. It’s not just fund manager surveys that are pointing out inflation fears. The bond market agrees with this sentiment. The US 10-year yield rose 23 bps this week - the largest weekly rise since October 2023. If the bond market wasn’t worried about inflation, yields would be moving the other direction!
Sam Ro from TKer: A chart market skeptics will find frustrating (better late than never as I’m quite sure I’ve passed along direct from the source - above…)
… Furthermore, one particularly notable aspect of the recent market rally is that prices are rising faster than expectations for future earnings growth, which means already elevated valuations have been rising. And higher rates are thought to be bad for valuations.
Morgan Stanley’s Michael Wilson recently charted these developments. Valuation is represented by the next-12 month price/earnings (NTM P/E) ratio — it’s the yellow line. The expected change in the Fed’s benchmark interest rate is the blue line. The lines diverged about two months ago.
Market skeptics will find this chart frustrating as it’s arguably a manifestation of irrational behavior.
There are at least two big premises to consider to understand the dynamic here…
AND … THAT is all for now. Enjoy whatever is left of your weekend!!