(EZ PMIs weak, 2y Ger set for biggest weekly drop since '08 and SOLID volumes o/n) while we slept; AT&T? "Buying a Bounce in Bonds"; '3 is the magic number'; this is fine
Good morning … Long bonds are becoming overbought and they aren’t even leading the charge this morning (that would be 7yy down just OVER 9bps as of 645a). Bonds,
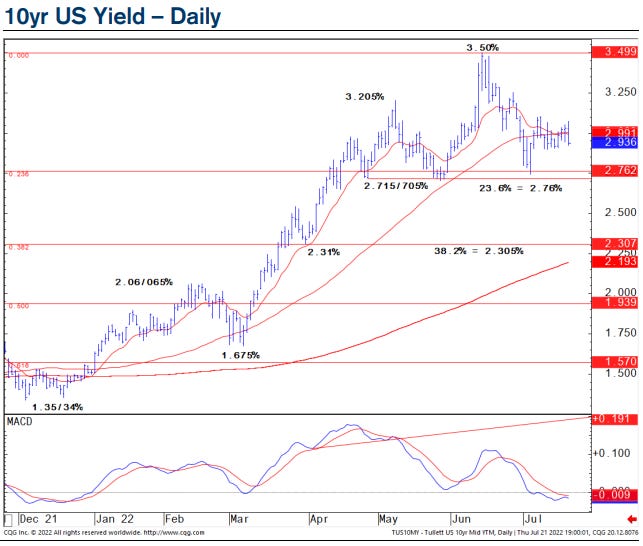
What a difference a day makes. This doesn’t mean they are an immediate SALE. It is only on a DAILY basis and while any sort of setback (ie concession) likely to be viewed in longer term frameworks (weekly / monthly) as DIPportunities, I just thought I’d mention it. The 50dMA (3.153%) remains an area of interest as we’re knocking on the door of 3% … which is NOT ‘the magic number’ referred to in the subject. For that, see below…For now, here is a snapshot OF USTs as of 718a:
HEREis what another shop says be behind the price action, you know,
WHILE YOU SLEPT Treasury yields are sharply lower though notably underperforming their EGB peers after the EU composite PMI unexpectedly slipped below 50.0 earlier today (*GERMAN TWO-YEAR BOND YIELD SET FOR BIGGEST DROP SINCE 2008- BBG). DXY is modestly higher (+0.12%) while front WTI futures are lower again this morning (-1.1%). Asian stocks were little changed but mostly higher, EU and UK share markets show the same while ES futures are showing -0.25% here at 7:30am. Our overnight US rates flows saw a drift lower in Treasury prices during Asian hours on the back of real$ selling in intermediates. That all changed once the EU PMI data began to print poorly with big lifts in TY's and 10's noted by our London desk throughout their morning (5s10s30s nearly -5bp flatter at one point). Overnight Treasury volume was quite solid at ~175% of average with 7yrs (214% of average) as the action point (10's too at 204%).
… US news: Demand destruction: "Adjusted for inflation, food spending fell 5.5 per cent between January and May, the largest four month drop since 1973" FT
… latest MOF foreign bond flow data showing that Yen-based investors continue their record run of liquidation of foreign bonds. Indeed, the 4-week moving average ( orange line) of net foreign bond flows just printed the lowest level in series history dating back to 2001. While in Japan last week we sensed still-large unrealized losses on foreign bonds (no doubt here and in Europe too) so perhaps the recent rally is a welcome event for them to help unload some paper. One crazy thought is that the fingerprints of such selling, if true , might show up not just in the MOF series but in underperformance of lower coupon (2018-2021 vintage?) off the runs versus their current and near current issue peers?
… and for some MORE of the news you can use » IGMs Press Picks for today (22 July) to help weed thru the noise (some of which can be found over here at Finviz).
The US economic funDUHmental data yesterday does need to be mentioned as does the ECBs (dovish?)hike but clearly, the news from AT&T via ZH,
ZH: AT&T Crashes As Americans Can't Afford To Pay Their Phone Bills
Shares of AT&T fell on Thursday after CEO John Stankey said that customers are starting to put off paying their phone bills - which resulted in the wireless carrier cutting this year's forecast for free cash flow by $2 billion, Bloomberg reports …
… The highest US inflation in four decades has been squeezing household budgets everywhere from the gas pump to the grocery aisle. That has soured people’s view of the economy and forced some to scale back entertainment and other discretionary spending. But wireless has long been considered an essential service, even for low-income Americans, and discounts on phones are still luring them to sign up with AT&T. -Bloomberg
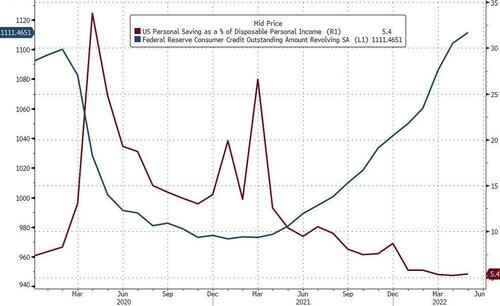
And as a reminder, the so-called strong consumer is draining savings at an almost unprecedented pace, while relying on credit cards to cover the soaring cost of living.
Stankey warned that he expects higher bad debt and slower payments to continue, and that while customers are eventually paying their bills, they're "less timely."
And yet, the idea of a(nother) cost-of-living crisisor the mention of Lacy Hunt / HIMCo as actually being on to something, will be met with all sorts of pushback.
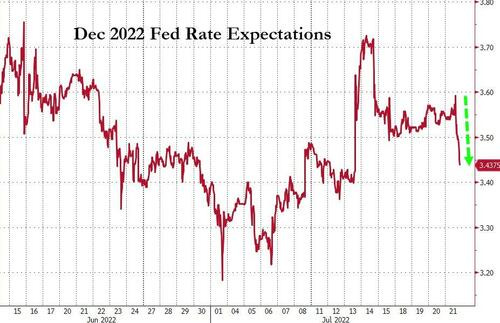
ECB hiked rates (50bps) for the first time in 11 years and attempted a word-salad to explain their defragmentation 'tool' to save spreads from blowing out. In the US, there was more ugly data today with 8-month highs for initial jobless claims and Philly Fed plunging to COVID-lockdown lows (and AT&T admits Americans can't afford to pay their phone bills?!)
This prompted a very dovish dive in rate-hike expectations
Now with the ECBs effort of shock and awe inspiring all sorts of volatility across markets, I’ll spare you ALL of the sellside narrative (as they’re still coming up with one) but I will NOT spare you a walk through SOME of the items on Global Wall Street’s mind (and inboxed across the land).
DB on the ECB: 50bp liftoff and the Transmission Protection Instrument
This is an historic moment for the ECB, in two regards. First, the ECB hiked rates for the first time since 2011, exiting negative rates in one step and with a larger than guided 50bp hike. Given the “undesirable” inflation outlook, this was an appropriate move. The ECB also dropped its short-term tactical guidance and moved into full data-dependent mode. Despite the growth headwinds, President Lagarde said there are likely to be hikes at “upcoming meetings” and the destination is “broadly neutral”. This implies at least another 100bp of hikes are in prospect. We maintain our 2% terminal rate call with a two-stage hiking cycle.
Second, the ECB announced the details of the new anti-fragmentation tool, the Transmission Protection Instrument (TPI). The ECB promised an effective tool and delivered. A unanimously supported and unlimited tool are two significant positives. As expected, the tool cannot intervene to counteract country specific fundamentals, for example, driven by changes in fiscal policy. As such, there was no suggestion that the ECB was rolling out TPI to deal with the latest pressures on BTPs given the political uncertainties in Italy. However, the TPI directly strengthens the incentive for all euro-area member states to comply with the EU’s fiscal and macro stability framework (including the NGEU) in a way that has not existed before and creates a formal mechanism to protect member states against crisis contagion. These aspects of TPI reinforce the stability of the euro area in aggregate.
… Given our concerns about the growth outlook – because of the tightening flow of gas from Russia we expect euro-area GDP to contract 0.3% in 2023, with a mild recession between Q3-22 and Q1-23 and growth to remain low thereafter as the US recession weights on the recovery – we see a two-stage hiking cycle…
In the first stage, we expect the ECB to hike by 150bp in total before end2022. After the 50bp hike in July, we expect 50bp hikes in September and October. Given the recession, we then expect a pause. In raising rates 150bp this year, the deposit rate would rise to +1%, the lower end of the range of neutral. At this level, policy would be more balanced – neither tight (inappropriate given weak growth) nor loose (inappropriate given the high inflation).
In the second stage, we expect the ECB to hike by 100bp in H1 2024. This would raise rates to a 2% terminal rate. The pause in the hiking cycle might be shorter. A pause is not necessarily inevitable either. Internally, the likelihood and duration of a pause will depend on factors such as the speed of contraction of GDP, inflation expectations, wage growth and the fiscal stance.
Nothing about the UN-HIKING cycle … only a pause (that refreshes). Stay tuned?
… In addition, the increases in claims this week was heavily concentrated in Massachusetts. Claims in MA rose 14.1K, while total NSA claims rose 7.9K. So, ex-MA, claims were down 6.2K, which would have generated a SA claims count of something like 236-238K. Obviously, you can't just cherry-pick the details and ignore the data from one particular state, but this is a very large increase for what is typical in Massachusetts. It may be an isolated layoff event related to the biotech and IT sectors, which are large employers in the state. Something to keep an eye on for next week to see if it continues …
ECB policy decisions have not changed the inflation outlook. They have reduced credibility. Forward guidance was killed off with a 0.5ppt rate increase—this was probably done as a deal to get bond manipulation through. Killing forward guidance means economists now have no reason to listen to the innumerable speeches of ECB President Lagarde.
The bond market manipulation plan is “we do what we want, when we want.” Conditions are determined by the ECB, leaving market manipulation down to spin, not objective assessment. Bond buying will be sterilized (no money supply increase). The euro soared to levels not seen since Wednesday night, and Italian bond spreads widened. The plan adds excitement to the otherwise dull lives of bond traders, creating a treasure hunt to discover ECB intervention levels…
… When it comes to getting long treasuries, it’s all about the former 2018 lows. It doesn’t matter what contract, ETF, or even duration. It’s the same story no matter where we look.
Remember, 2018 is when risk assets peaked globally during the last cycle. And US treasuries are respecting those key former lows. This makes a great level to trade against and measure risk.
And that’s precisely what we want to do.
Since these trade ideas are all about strong downtrends rebounding off critical levels of former support, we will quickly run through the key levels on our radar.
First, we have 30-year T-Bond futures:
T-Bond futures are bouncing higher after a quick shakeout beneath the 2018 lows. We like it long if and only if it’s above ~136’16 with a target ~153’00.
It’s a similar scene in the 10-year T-Note. After putting in a potential failed breakdown last month, it’s on the rebound.
We can trade against the former lows ~117’13. As long as it’s above that level, risk is to the upside back toward 128.
But hey, we know not everyone trades futures. Don’t worry, we have you covered!
If T-Bond futures aren’t in your wheelhouse, the long-term treasuries ETF $TLT is reclaiming a similar level.
As long as it’s above 112 we’re betting on mean reversion back toward 135.
Along the same lines, the 7-10 year treasuries ETF $IEF is back above a critical support level ~99.50.
We’re buyers above this level back toward 110.
It’s that simple.
We want to trade against the former 2018 lows in anticipation of a meaningful bounce in US Treasuries.
But we want to make sure we’re trading the longer end of the curve. Downside pressure on long-duration yields is likely as the Fed continues to raise rates at the shorter end.
And since the intermarket landscape is hinting at lower rates, we think a bounce here is the higher probability outcome.
BUYERS meet SELLERS — in this case, 1stBOS latest charts update — well, thats not entirely true as 1stBOS would be buyers of long bonds but would need dip up TO ‘support’ @ 3.395% … meanwhile, current bearish expression, where I’d highlight ‘resistance’ (for those paying attention TO the ‘stop hunt’),
We stay tactically bearish from 2.985%, looking for a short-term swing higher to support at 3.255%, where we would turn tactically neutral. Resistance stays at 2.855%, below which we would also turn tactically neutral.
Three is the magic number -- well, 3% for the 10-year US Treasury yield…
Despite the drumbeat of inflation talk, the 10-year US benchmark has failed to stay markedly above the 3% level for long after dropping back from about 3.5% in mid-June. That reflects haven demand amid fears that Federal Reserve monetary tightening will end up triggering a recession.
So it seems like 3% marks the level where “fear of missing out” — a moniker that became popular for pandemic-era stock buying — comes to the Treasury market.
“Similar to how many spent H1 22 kicking themselves for not being short enough, or exiting shorts too early, long-end investors may start to feel the window for adding bonds at 3.00%+ this cycle closing — we think a real money FOMO bid might start kicking in,” wrote Blake Gwinn, head of US rates strategy at RBC Capital Markets.
Market pricing indicates a 75-basis-point hike is the most likely outcome at the Fed’s July 26-27 meeting. Traders anticipate a peak in the fed funds benchmark of around 3.5% either late this year or early 2023.
Officials indicate the neutral rate is somewhere around 2.25% to 2.5%, so if market pricing is right, borrowing costs are headed to restrictive territory that can hurt the US economy.
Little wonder, then, we are seeing longer-end buying that’s helping to cap rates at around 3%.
All told, I hate to admit it but I think Investing.com nailed THIS ONE
Another enjoyable read. You are now my official go to curator for ZH. Hope you carry the crushing mantle of that strictly honorary title on your shoulders well.
On https://www.newyorkfed.org/microeconomics/sce#/stockprice-3 I was picking through the age related demographics lines, and it seems the YOLOs have quickly reset their stock market equity expectations downward to catch up with their elder YODOs (You Only Die Once?). These simplistic polls and charts are riddled with contradictions and probably useless for the most part to investors, but, I have to wonder if some policy maker somewhere won't fail to notice the elder's (voters!) undiminished expectations for higher amounts of Government largess ("One-year ahead government debt growth expectations") going forward than their children and grandchildren. Apparently, the YODOs feel that this support will not come in a monetary form since their stock market exceptions are leading the probing of new lows. Running the age chart lines, like an ancient Roman forecaster/oracle 'running' the intestines of a fallen fowl through their fingers, I sense the golden-oldie line did the best when it came to hearing the music stopping back in 11/21 and 12/21. The voice on high also tells me the redlines appear to have gambled on one last dip-buying foray shortly after 2022 got underway. Fell for the first bear market rally. The hardcore cyan-liners appear to have thrown a saddle on the mean old bear and rode it on down. Unfortunately, I can't confirm this for sure until I fondle the liver of a virgin white goose without a single black feather. (As stipulated in the standard Oracle Contract all prognostications are null and void and as an oracle I am not to be held in any way responsible for actions taken based on the gutz and gizzards of said virgin white goose if a single black feather is later found on said bird, otherwise, it is the standard 2/20 fee structure for all divinations.)


Steve,
Another enjoyable read. You are now my official go to curator for ZH. Hope you carry the crushing mantle of that strictly honorary title on your shoulders well.
On https://www.newyorkfed.org/microeconomics/sce#/stockprice-3 I was picking through the age related demographics lines, and it seems the YOLOs have quickly reset their stock market equity expectations downward to catch up with their elder YODOs (You Only Die Once?). These simplistic polls and charts are riddled with contradictions and probably useless for the most part to investors, but, I have to wonder if some policy maker somewhere won't fail to notice the elder's (voters!) undiminished expectations for higher amounts of Government largess ("One-year ahead government debt growth expectations") going forward than their children and grandchildren. Apparently, the YODOs feel that this support will not come in a monetary form since their stock market exceptions are leading the probing of new lows. Running the age chart lines, like an ancient Roman forecaster/oracle 'running' the intestines of a fallen fowl through their fingers, I sense the golden-oldie line did the best when it came to hearing the music stopping back in 11/21 and 12/21. The voice on high also tells me the redlines appear to have gambled on one last dip-buying foray shortly after 2022 got underway. Fell for the first bear market rally. The hardcore cyan-liners appear to have thrown a saddle on the mean old bear and rode it on down. Unfortunately, I can't confirm this for sure until I fondle the liver of a virgin white goose without a single black feather. (As stipulated in the standard Oracle Contract all prognostications are null and void and as an oracle I am not to be held in any way responsible for actions taken based on the gutz and gizzards of said virgin white goose if a single black feather is later found on said bird, otherwise, it is the standard 2/20 fee structure for all divinations.)