RTRS: China's factory, services sectors show weakness, need for stimulus
These combined to help shape / shift the overnight global narrative ahead of this afternoons month end (4pm is the new 3pm) and Friday mornings NFP … The proverbial calm before THAT storm is likely to persist …
On that NFP — hard to imagine a 200k CONsensus to be consistent with a slowing economy, slowing inflation and so a PAUSE which leads to a CUT … Throw in to the mix EARL,
*OIL PRICES RISE ABOVE $81 TO REACH HIGHEST SINCE APRIL 17
… HEREis what this shop says be behind the price action overnight…
… WHILE YOU SLEPT Treasuries are modestly lower with the belly underperforming (see attachments) this morning. Our bullets above run through most of the recent data reveals, DXY is little-changed while front WTI futures are higher (+1%). Asian stocks were almost all higher (NKY +1.26%), EU and UK share markets are mixed (SX5E +0.33%) while ES futures are little changed here at 6:45am. Our overnight US rates flows saw further weakness in the JGB market (JGB 30yrs +11.7bp) put a drag on Treasuries with flows seeing modest selling in the long-end from real$ names. During London's AM hours, Treasuries have chopped in a range with 10yrs testing (and holding) 4% again. A 400k block buy of TY futures and some real$ interest in the belly helped to take 10's back off their round-number support at 4.00%. Overnight Treasury volume was weak again at ~70% of average overall ahead of month-end today.
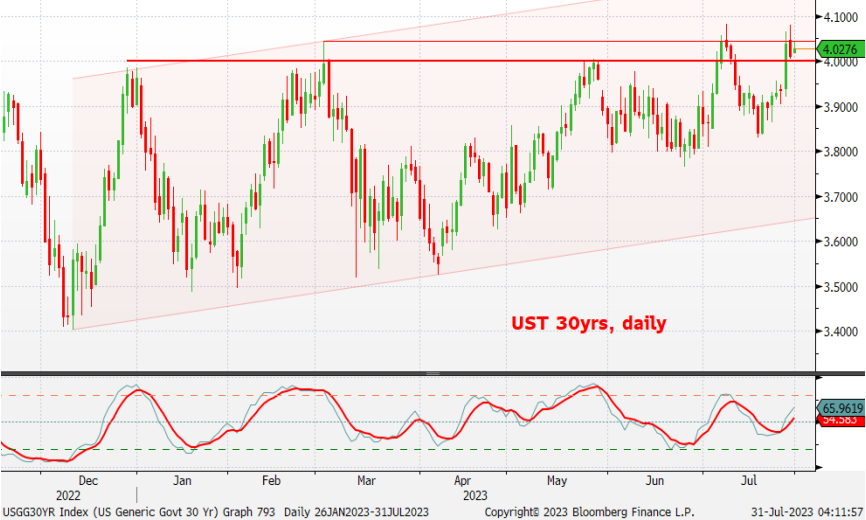
… Treasury 30yr bond yields, daily: Still in a bear channel in place since late last year. Of interest is that the March move high (4.045%) is still being respected this month- at least on a daily closing basis. Daily momentum )lower panel) shows a bearish lean still so further tests of the 4.045% support level look likely over the near-term.
… and for some MORE of the news you can use AND to help weed thru the noise, have a look at Finviz …
From some of the news to some of THE VIEWS you might be able to use… here’s what Global Wall St is sayin’ …
Given the news and conflicting views from BoJ BUYING to China (mixed) data overnight, a few items FROM Global Wall St.
First up a couple of notes sent out yesterday morning,
Extremely low global risk premia, coupled with the BoJ’s adjustment of its yield curve control policy, warrant a balanced market view. However, we think defensive carry trades can still perform and we remain bullish on select high-yielding EM FX – we stay short NZDBRL and long an FX carry basket.
The dovish outcome to the July ECB meeting has prompted us to take profit on our short Bund position – we are now neutral duration in Europe and favour 5s10s OAT steepeners. In the US, we see room for longer-dated rates to drift higher given the continued strength of economic data.
We expect both the BoE and the RBA to surprise the market to the upside in the coming week, hiking rates by 50bp and 25bp, respectively. We are paid AUD rates going into the RBA meeting.
MSs Sunday Start | What's Next in Global Macro: Home Is Where the Heart Is
The largest and potentially most important asset class in the world is housing, but we don’t think of it as an asset because housing is a home. As the sampler in your grandma’s kitchen says, “Home is where the heart is.” Unfortunately, the recent volatility in house prices has probably left some with heartburn. From a global average rise in home prices of 16% in 2021 to a 6% fall in 2022 with a statistically significant breadth of dispersion across countries, this housing cycle has arguably been like no other…
… At a global level, the mortgage structure theme is what most clearly differentiates economies. While the US, after the GFC, primarily operates with 30-year fixed mortgages, they are far from the norm. Most economies have a materially lower fixed mortgage share, and even where the fixed mortgage proportion is high, e.g., the UK at ~80%, the tenor of the fixed portion is usually a maximum of 3 or 5 years. The economic risks and implications are far higher in economies where existing homeowners face resetting interest rates. The housing note includes a global scorecard of “housing exposure” to rates, which shows that the US is the least sensitive while Canada, Sweden, and Australia rank as the most sensitive.
Then last night, some data outta China seems to have been somewhat conflicted
The weaker composite PMI suggests the dovish message from the Politburo meeting has yet to have an impact on sentiment in the real economy. We think the softer services and construction PMIs were largely driven by the prolonged contraction in housing activity, while the manufacturing PMI is likely at its low.
CSFB China Data: Contractionary PMI forebodes demand challenges
July manufacturing PMI remains contractionary with a reading of 49.3. Component wise, with production edging down slightly to 50.2 (see Figure 1), the overall weakness is not due to production bottlenecks. Instead, domestic, and external demands are the main drags.
We noted in last month’s PMI report that bad news is simply bad news (link). We continue to maintain this view. Although authorities have promised to deliver targeted measures to stimulate consumption and stabilize real estate (link), and indeed measures have been and will continue to be announced, we expect limited effects by these measures to turn around household demand. (See Figures 10 and 11.)
By our assessment, household demand will only respond to policies that either directly improve disposable income growth or reverse the expectation of the structural decline to house prices (see Figures 7, 8, and 9), or both. Any other policy, may it be encouraging the purchases of electric vehicles or energy-efficient appliances, or relaxing purchase restrictions of residential flats, will likely have limited effects. These policies can only facilitate consumption changes along an already weak demand curve. To have meaningful turnaround, China needs (but lacks) policy tools that can shift the demand curve outward.
GS China: NBS manufacturing PMI rose slightly while non-manufacturing PMI fell in July
Bottom line: The NBS manufacturing PMI rose slightly to 49.3 in July from 49.0 in June. Among major sub-indexes, the new orders sub-index increased the most, followed by raw material inventories sub-index. The NBS non-manufacturing PMI declined to 51.5 in July from 53.2 in June, suggesting both the construction and services sectors continued to recover sequentially, but at a slower pace.
Manufacturing activity may be bottoming out with a possible moderation in the pace of destocking ahead. Property easing and faster infrastructure spending in next 1-2 months, as well as pro-business measures in 1-2 quarters could prevent renewed weakness and drive growth re-acceleration in 4Q.
This, along with recent politburo news, is then interpreted by global chief economists in a recent global WORLDVIEW,
The recent Politburo announcement on stimulus is material and reminiscent of the 2018 pivot. We acknowledge the focus on housing, infrastructure, and private sector, but reinforce the consumer-led cycle. The pace of stimulus will be gradual, but we expect a confidence boost from this package.
Setting China aside for the time being, a couple OTHER notes which caught MY eyes overnight were on the topic of SOFT LANDING.
Financial markets are focusing on a soft economic landing. Friday’s US data demonstrated the relentless hedonism of the US consumer and ongoing disinflation. Some caution is warranted. Especially in the US, some of the strength of middle-income consumers is due to experienced inflation being lower than reported inflation. As reported inflation converges with reality, the disinflation will offer less additional support to consumers than might be supposed…
From this past Friday TO this coming - NFP - we’ll see how durable this SOFT LANDING thesis is.
AND if we ARE to achieve said SOFT LANDING one might wanna know what to do. You know, how to TRADE / invest it, right? This brings me to this next note,
■ Last spring, we argued that the nascent rebound in market sensitivity to economic data had room to run, because markets were underreacting to the data surprises that would ultimately determine Fed policy. Sensitivity has surged since then, and in this week’s Analyst, we investigate the reasons for the rebound in market sensitivity to inflation and growth data and whether it is likely to persist.
■ Treasury market reactions to growth surprises jumped from negligible levels in 2021 to 1.3x normal over the last twelve months. The rebound in sensitivity to inflation and wage data is even more dramatic: from essentially zero in early 2021 to more than 7x the historical median
■ The key drivers of rebounding sensitivity include the end of the pandemic, the high level of the funds rate, the Fed’s tightening bias, and the Fed’s data-dependent policy—exemplified in June 2022, when Friday data convinced policymakers to hike 75bp the following Wednesday.
… For growth data, the 10-minute change in Treasury yields per standardized data surprise jumped from negligible levels in 2021 to 129% of normal over the last twelve months, as shown in Exhibit 1. As discussed in detail here, this summary metric includes both upper- and lower-tier economic indicators, with the weights determined by the historical importance of each indicator—payrolls for example receive 4x the average weight.1 In practical terms, this exhibit indicates that a one-standard-deviation beat in a “typical” growth indicator—such as jobless claims or Chicago PMI—currently generates a 1.25bp rise in the 10-year yield on average other things equal. This compared to just +0.25bp in 2021.
■ Turning to inflation data, we find that core CPI overtook nonfarm payrolls as the most important indicator for the rates market after the Fed’s hawkish pivot in September 2022. Equity sensitivity to inflation news has also surged to 12x the historical norm—we estimate a 85bp move in S&P futures per standardized surprise across the top five inflation indicators.
■ We view the market’s outsized focus on inflation data as consistent with our forecast of a hold at both September and November meetings, because we expect a further decline in inflation to more than offset resilient labor market data and continued positive GDP growth in the eyes of the Fed. Looking further ahead, we continue to expect above-average sensitivity to price and wage data, because progress on the “last mile”—the task of lowering inflation into the low-to-mid 2% range—will be crucial for the FOMC’s decisions to stop hiking and eventually begin cutting.
■ n Market reactions to growth data appear to have changed after the banking turmoil and recession fears receded. Since then, the equity market seems to have taken a “bad news is good news” view—equities have tended to rally on weak growth data and sell off on strong data—because weak-but-positive growth data reduce the risk of additional rate hikes. Looking ahead, we expect these “perverse” equity reactions to continue as long as recession fears are on the back burner and the Fed maintains an active tightening bias.
■ When and why did the market become confident that inflation would fall and that a 2023 recession was unlikely? We find that the market’s expectation of a hard landing moved decisively lower between May and July of this year, in response to progress on labor market rebalancing and the continued stability of long-term inflation expectations.
AND for our inner stock-jockeys, a few thoughts and links
USD looks technically oversold near-term given US/RoW growth disparity. Cross-asset beta is a popular but flawed approach to express USD views via equities. We overlay international sales exposure with dollar beta to build a long-short portfolio with better correlation to DXY returns than either approach alone.
… The cumulative performance of the ISP/Dollar-beta Overlay basket is also closely aligned with US dollar, providing us with an opportunity to express dollar views using equities.
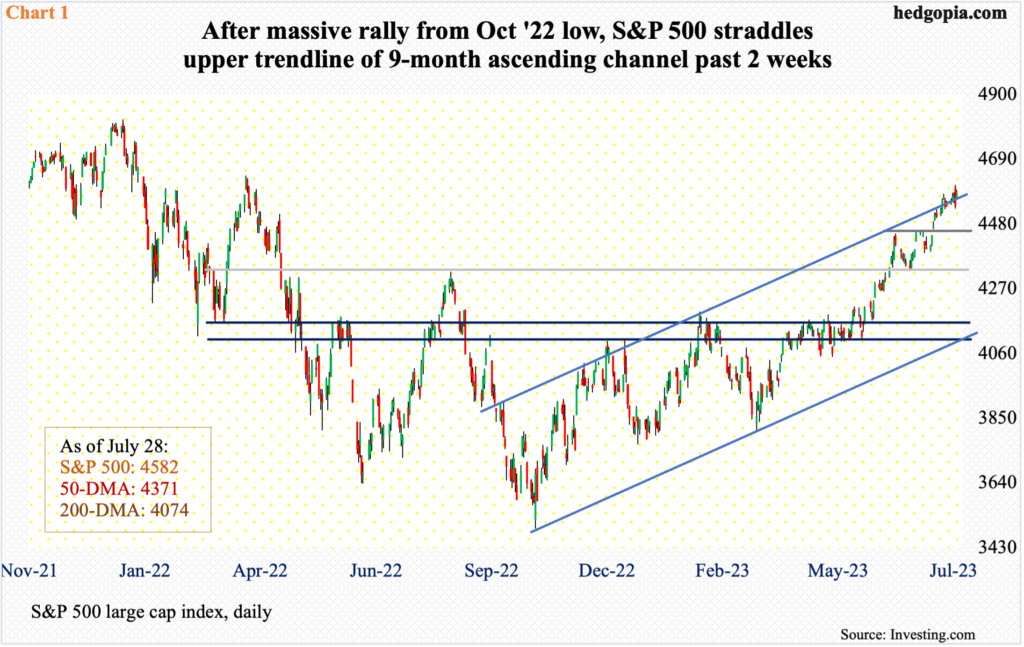
Hedgopia: Combination Of Higher Prices And Lower Earnings Pushes Up Multiples, Turning Equity Bulls With Tons Of Paper Profit Into Jitttery Bunch
Optimism around a US policy pivot has continued to support valuation. In today's note, we discuss parallels to prior pivot-driven rallies as well as recent trends in earnings revisions and performance breadth. Our latest Consumer Pulse Survey indicates more positive consumer sentiment.
… Where are we in the US market cycle and how does policy play a role in that determination?...It's a question that's consistently come up in our client dialogue over the past several weeks. The data we have today suggests to us that we are in a policy-driven, late-cycle rally. In our view, the positive policy impact has been supported by a very strong fiscal impulse (as discussed last week), a still supportive global liquidity backdrop and optimism that the Fed can now transition to easier monetary policy given the falling inflation data. The latest example of such a period occurred in 2019, but for somewhat different reasons—the Fed definitively paused and then cut rates and the Fed's balance sheet began to expand toward the end of the year. These developments fostered a robust rally in equities that was driven almost exclusively by multiple and not earnings, as has been the case this year. Both then and now, mega cap tech has led and growth has outperformed value as equity market internals process a path to easier monetary policy, in particular. In Exhibit 1 , we compare the industry group performance during the 2019 rally versus the recent rally since the October lows. Note the strong rank order correlation between the two periods, which is supportive of the idea that the market is trading similarly to the way it was in 2019. The 2019 analogy, in and of itself, suggests more index level upside from here, though we'd note that the Fed was already cutting rates for a good portion of 2019, and the market multiple is already close to 1 turn higher than where it peaked during that period. Others suggest we are in a new cyclical upturn. While we're open-minded to this view eventually materializing, we'd like to see a broader swath of business cycle indicators inflect higher, breadth improve and front-end rates come down before adjusting our stance in this regard…
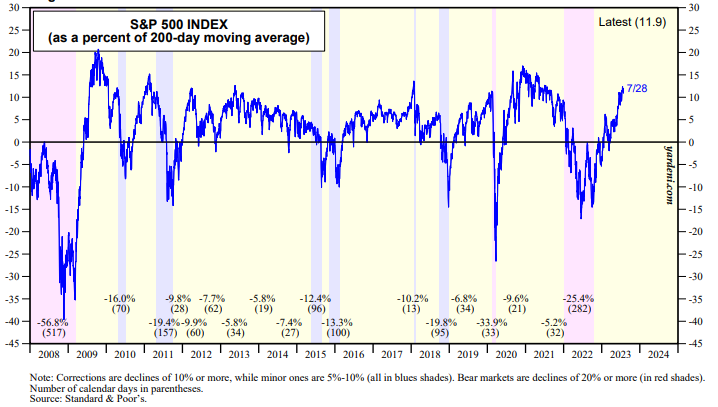
The S&P 500 closed at the bull market's high of 4582.22 on Friday. Chart technicians continue to ring the alarm bells. The index is 11.9% above its 200-dma, which is 4094.1 (chart). Sentiment is too bullish. Breadth is too narrow. Valuations are stretched. The bears are capitulating. Run for the hills!
Yet, last week, the Dow Theory flashed a bright green signal. That's because the Dow Jones Transportation Average (DJTA), which bottomed last year on September 19, jumped 1.75% on Friday, only 2.0% below its record high on October 29, 2021 (chart). A breakout above the previous record high would be a strong vote of confidence in the economic outlook. The DJTA has been a good leading indicator of the DJIA since late 2021.
Back from the equity ledge and TO the day and week ahead — while it SHOULD be a quiet one in theory, especially ahead of Friday’s data, a few final parting words from a large German bank strategist
Given that the outcome of the September FOMC (19th-20th) will likely depend on the two CPIs and two payroll reports prior to the meeting, all roads this week lead to US payrolls on Friday. Ahead of that tomorrow JOLTs data will give clues as to the current tightness of the labour market underneath the headline numbers. For those of us who still believe old fashioned metrics of the cycle matter, then the quarterly Fed SLOOS later today could actually be the most informative for where the economy might be in 6-12 months. We also have the manufacturing (tomorrow) and services (Thursday) ISMs as a timely indicator of the momentum in the US economy…
More later but … THAT is all for now. Off to the day job…
Going to go on 1 here, dids me homework yesterday after mtn biking HARD the last 2 mornings, didn't have much Physical energy remaining....
-How much of this 'soft landing' narrative is based on BS Initial Headline Data, that's months later quietly revised Downwards? Such as personnel Income Growth (or something like that), the headline number was +4.9% YoY, only to be QUIETLY revised Downwards months later to -0.7% (h/t to YT's Nobody Special Finance).
-DDB's daily free note (yes I'm frugal!) seemingly daily provides a lengthy rebuttal to the Softy narrative.
I try to read the Credit Bubble Bulletin Weekend Commentary regularly. Reading yesterday's was a real dozy. These large financial behemoths obviously don't read it, or refuse to discuss it publicly. For instance:
-After 2 yrs of hammering the private sector with excessive regulations and state take-overs, the Chinese consumer and businessman (they are unwoke over there!) have lost confidence in the government and economy, and no "stimulus" will restore this confidence, only deregulation will release those "animal spirits".
-The June US stock rally is all multiple increased based, 100% funded by the retail (i.e. BAGHOLDERS) investor barrowing on Margin....
-The initial rate increases actually serve to Accelerate the final wave of growth in the economic cycle.
-The Fed & US Treasury basically implicitly, through it's March measures, backstopped the entire US banking system, thus relighting the fuse of the Speculative Bubble.
All that said, I also subscribe to Tom Luongo's Gold Goats & Guns blog (highly recommended, and Yes I'm a Patron!). He's made the point Repeatedly that Brandon's CHIPS and Inflation Reduction Act are providing massive industrial stimulus, so while the consumer fades, the big businesses tied into the Gov GAIN. This will lead to Commodities Inflation, which pushes out the recession to 2024. Much as I despise Brandon, I have to give him and/or his peeps their credit for knowing how to prop up our fake economy. Never mind the 30B plus monthly DDB loves to point out the Gov is STILL paying business to keep useless employees on payroll. But don't worry, the Feds suspect that over 50% of these claims are fraudulent, and after something like 40 plus months, the Feds are on the case. OHH the confidence I have in them!
Thanks for all that you do, and for providing this outlet. Cheers All!