Good morning … JPOWs speech continues to reverberate through global markets this morning and I’ll get right back to that in a moment but overnight a(nother) single h’line (and visual)caught my attention
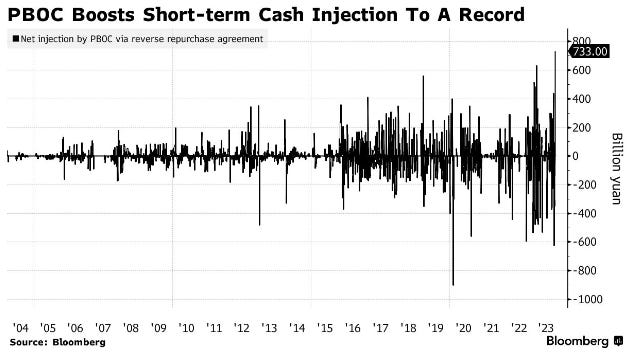
Bloomberg: China Injects Most Short-Term Cash Into Banking System on Record
… “The large injection reflects the PBOC’s efforts in stabilizing the money market funding cost,” amid a increase in issuance of central and local government bonds, said Xing Zhaopeng, a senior strategist at Australia & New Zealand Banking Group.
Now in as far as JPOW recap goes, DBs Jim (early morning)REID
… In the speech on the economic outlook, Powell said that they were “proceeding carefully”, and explicitly nodded to the fact that financial conditions “have tightened significantly in recent months” which you could interpret as lessoning the need for the Fed to act. This led to an initial dovish rates reaction across the board, though there were also some more hawkish comments, including that “Additional evidence of persistently above-trend growth, or that tightness in the labor market is no longer easing, could put further progress on inflation at risk and could warrant further tightening of monetary policy.” Powell then added a notable comment during the Q&A, saying “I think the evidence is not that policy is too tight right now”.
Overall given the huge steepening, markets must have concluded that the hints that near-term rates didn't need to go up much more, but that policy wasn't overly tight, perhaps suggested a "reasonably high for longer" interpretation rather than a "lets make sure we crush inflation before we do anything else" one. Or maybe I'm clutching at straws as to explaining why curves steepened so much on one relatively "to form" speech.
The reaction at the front end was clear though and market pricing for the chance of a Fed hike this year fell back to 25%, from 40% the previous day. US equities seesawed as Powell spoke, with the S&P 500 trading nearly +0.5% up on the day around the end of this speech. But renewed geopolitical concerns contributed to a pronounced weakening during the rest of the session and left it closing down -0.85% on the day. The VIX volatility index rose +2.2pts to 21.4, its highest since March. The equity decline was broad-based with the NASDAQ down -0.96%. Tech megacaps saw a contrasting performance as Netflix, the 42nd biggest company in the S&P 500 was +16.05% and Tesla, the 7th biggest was -9.30% after Wednesday evenings' results. This morning, the S&P 500 (-0.16%) and NASDAQ 100 (-0.30%) futures continue to drift lower…
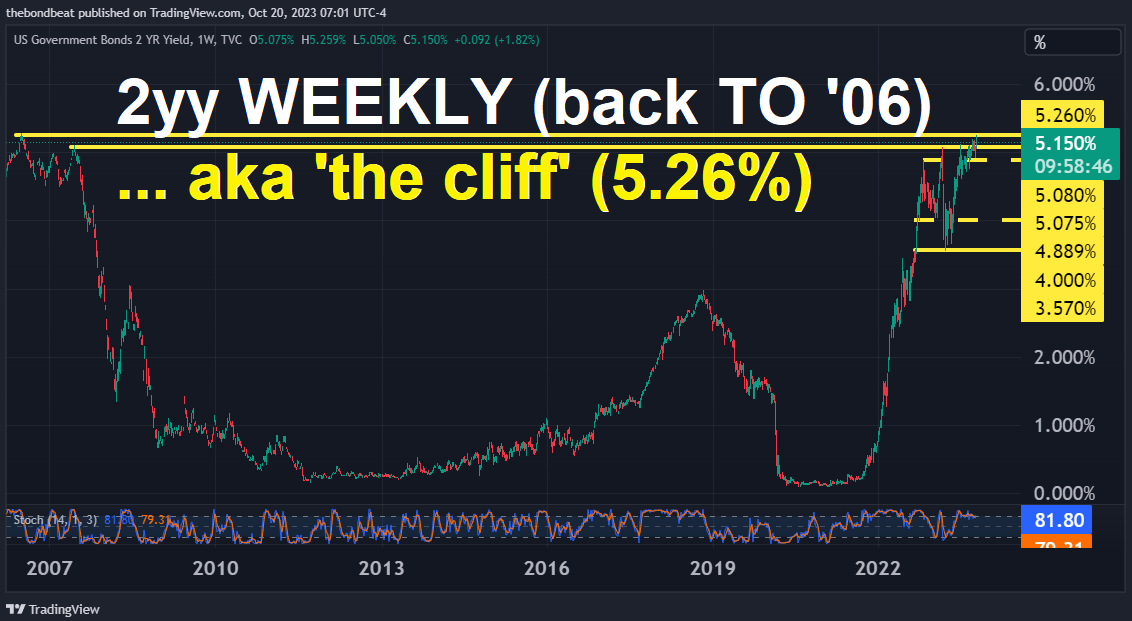
JPOW speech HEREand with Fed meeting probabilities a fluid situation, as always, the 2yy IS taking a small step back from the edge of the cliff, where ‘the cliff’ is defined as …
AND in as far as data goes, Initial Claims yesterday as ‘unadulterated good news’ (1st link)? Maybe…
Bonddad Blog: Initial claims on the cusp of turning lower YoY CalculatedRisk: Weekly Initial Unemployment Claims Decrease to 198,000 ZH: Continuing Jobless Claims Jumps To Highest Since July As Initial Claims Plunge
Nevermind … here is a snapshot OF USTs as of 745a:
… HEREis what this shop says be behind the price action overnight…
… WHILE YOU SLEPT Treasuries are higher led by the belly sector (2s5s10s -2.5bps) on risk-reduction thematics into the weekend. Weaker UK Retail Sales and German PPI leave those bond-curve steeper amid risk-off equity performance (DAX -1%) while the energy complex perks up again on geopolitical tension (XB +1.5%, TZT +4.1%). The USD remains bid against risk-correlated currencies, with levels exacerbating price action in USDJPY and USDILS. UST futures were buoyed overnight by ~1.3mn/01 in block buys across FV-UXY contracts, fast$ opportunistic buying seen in 5-10y space. Volumes are ~95% the 30d average, and S&P fut’s are -9pts here at 7:30am.
… and for some MORE of the news you can use » The Morning Hark - 20 Oct 2023 and IGMs Press Picks (who CONTINUES to be sportin’ that new, fresh look) in effort to to help weed thru the noise (some of which can be found over here at Finviz).
Moving from some of the news to some of THE VIEWS you might be able to use… here’s SOME of what Global Wall St is sayin’ (in a similar sorta way you’ll find content if you pay for ZH PREMIUM? except … they are SELLIN other folks data where as I’m just point it out and links provided — should work IF you have permission and should NOT work if you don’t … HOW can THEY do that?? askin’ for a friend as I never understood how they do it…)
BUT FIRST, before jumping in to Global Wall Street inbox, a few words from none other than Lacy Hunt ofHOISINGTON Investment Management (aka HIMCO) as his latest quarterly letter dropped AFTER JPOWs speech.
It’s shorter than normal — only 4pgs— and has a couple / few visuals — median HH income in decline, REAL avg WEEKLY earnings at near HISTORICALLY WEAK levels of … growth (use that term loosely as it’s really more deeply into contractionary territory … and another of CPI on YoY basis suggesting Fed’s 2% inflation target IS in fact ‘easily attainable’ …
It comes the day AFTER I posted Gundlach commentary from earlier in the month and was much more bond BEARISH and so I hope you’ll accept THIS 4pg note as a reminder that for every SELLER out there, there’s another side of the trade.
… Contra Normal Cyclical Characteristics … Inflation. The CPI’s twelve-month percent change fell about 540 basis points from the peak in June of 2022 to August 2023. Faster decreases have occurred since 1953, as indicated by the down arrows (Chart 4), but all of the declines were during and immediately after recessions. Based on historical experience, inflation fell further during recessions (Table 1). In the eight recessions since 1958 (counting the two recessions of the early 1980s as one), the average low rate of increase in the CPI was 1.3%, line 9 of Table 1. If the extreme low (line 8) is eliminated the average is 1.7%, and if the extreme high and low readings are eliminated the average trough was 1.2%. This record of the historical business cycle suggests that the Fed’s 2% target is easily attainable.
… Macro Dynamics Favor Treasury Bonds The peak in the financial cycle occurred in the fourth quarter of 2021, seven quarters ago. This is right in the middle of the five to nine quarter average monetary policy lag since World War II. Monetary conditions have steadily tightened through the end of the third quarter of 2023 and the process is widely expected to hold through the end of the year, and possibly even into 2024. Historically, these more restrictive conditions will expose, through bankruptcy and liquidation, those who took excessive risk during the monetary largess of 2020 until early 2022. Through September, the yield curve between the two- and ten-year Treasury yields has remained inverted for over twelve months. As Duke Professor Campbell Harvey’s research has shown, this barometer has, without exception, preceded each of the last eight recessions over the course of seventy years. Such developments point the economy in the direction of an economic downturn and lower inflation.
In past cycles, cost pressures, such as rising prices in oil, other commodities, and wages, all rose but the Fed still won the battle against inflation. Cost pressures in a severely constrained monetary environment serve to reduce economic activity. Oil, for example, is a highly price inelastic good. Thus, when its price rises, consumers and businesses are forced to reduce discretionary spending. When wages and other costs move higher and businesses are unable to fully pass along the higher costs then corporate profits can fall, resulting in weaker economic activity. In 2020- 21, monetary growth was off the charts. This led to much faster inflation which is now generating faster wage increases, but money conditions no longer allow them to be passed through. For these cost pressures mentioned above to result in higher inflation, the Fed would have to undertake a further round of monetary largess while inflation is still above the Fed’s official target, which they reaffirmed they would not do at their last FOMC meeting.
In the past three quarters, real GDI declined at a 0.6% annual rate while real GDP gained at a 2.3% pace, with the average of the two being just 0.8%. However, monetary and fiscal restraint intensified during this span, suggesting that the revisions are more likely to take the results lower rather than higher. In addition, the global economy, has continued to deteriorate. In the twelve months ended July, the volume of world trade declined 3.2%, a growth rate normally associated with recessions. The erosion of this very high multiplier sector indicates that the foreign sector will add to the downward force of the financial cycle. This environment will be favorable for lower Treasury bond yields.
So again the other side of the RATES GOING ON UP argument in only 4pgs and for your review as a counter TO what say Gundlach …
Uma and Oprah (please choose who is who) aside, and back TO Global Wall Street’s process of thought …
Barclays - September existing home sales: Lowest level in over a decade (what did we think would happen with high / rising rates … one word for you … Mortgage LOCK. Ok, so, 2 words…)
Existing home sales declined 2.0% m/m in September, continuing the downward trend since February's peak. Single-family and multifamily sales declined, leading to an increase in the monthly supply of homes. Mortgage lock continues to be a driving factor of weakness in sales.
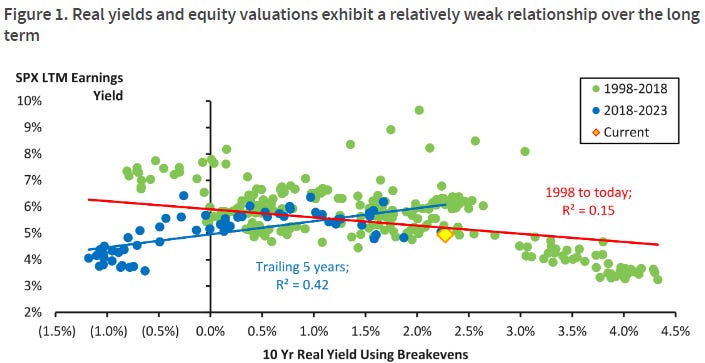
Barclays - U.S. Equity Strategy: Food For Thought: Keeping It Real (bonds and stocks together … one hand washes the other)
Higher real yields have driven equity multiples lower over the last 5 years, but their LT correlation is much weaker. We think real yields are a limited signal for equities in isolation, and that stocks are likely to remain range bound vs. incremental yield upside, absent a larger macro or financial shock.
BNP - US refunding preview: The Long-end Winding Road (timely reminder after all the SUPPLY related talk / links YEST)
KEY MESSAGES
We expect Treasury to announce another round of across-the-curve auction size increases for the November refunding cycle.
Treasury is likely to maintain the pace of auction size hikes for nominal 2s, 3s, 5s, 7s, and 20s, as well as 2y FRNs. We think Treasury may opt for more gradual adjustments to 10s and 30s compared to August.
We expect ~$300bn of T-bill issuance through the course of Q4 2023, bringing annual supply to over $2tn.
… T-bills: One natural suggestion, and risk to our baseline, is that Treasury could continue to lean heavily on T-bills to absorb a large chunk of funding needs, opting for considerably smaller coupon size increases than what we have pencilled in. Indeed, T-bills have been effective over recent months without materially disrupting liquidity/funding markets. Net T-bill issuance is at approximately $1.7tn YTD, which has been readily absorbed by MMFs. With the market implying the Fed is close to (if not already) done with rate hikes, an extra 5- 10bp in T-bills versus SOFR has been an attractive substitute for MMFs competing for cash via rate level. This has helped to support the precipitous decline in RRP balances to $1.1tn as funds appear keener to term out, with average WAMs rising to 29 days from 23 days in August. In turn, T-bill yields have remained relatively stable versus swaps (albeit at slightly wider spreads) and reserves are basically unchanged over the last six months.
… Buybacks: In addition to T-bill specifics, Treasury asked dealers about specifics around the forthcoming buyback program, inquiring specifically about what day/time buyback operations should be conducted and whether they should conduct more frequent buybacks for certain sectors (i.e. two $2bn operations every quarter versus one $4bn operation every quarter). We believe Treasury should conduct operations in the morning, around 10-11am, before any auctions and after most data releases – similar to when the Fed conducted QE operations. We see value to conducting operations for a given sector in proximity to the auction for the closest benchmark maturity to mimic a "switch" versus currents.
We also believe frequency of buybacks is more important than size of the buyback, which is why we favor a framework of $2bn/two operations per quarter versus $4bn/one operation per quarter. This is because it decreases the distance going into the next liquidity event, with the 6y and 9y sectors (less liquid) likely to benefit more from the frequency of operations…
DB- US Cash now outperforms all major global fixed income YTD (and while not specifically related TO supply of longer dated USTs it IS food for thought that CASH — so choosing to stay real short — proving to be best alternative…)
…Today’s CoTD is an abridged selection from our performance review showing where T-bills rank YTD in USD terms. As discussed, it now eclipses all our main global fixed income indices. To outstrip it you have to go into selected equities, Oil or Gold. Clearly, the NASDAQ (+28.1%) has trounced everything and has taken the S&P (+13.8%) with it. However, the equal weight S&P 500 has underperformed cash at just under 1% return YTD in total return terms. The interesting thing is if you’d told most people at the start of the year that 10yr yields would be around 5% by October, not many people would have wanted to own the NASDAQ given the near one-to-one negative correlation to yields in prior quarters. So AI has helped create a dramatic decoupling.
The good news is that yields are higher across the board, so positive returns from here should get easier in fixed income.However, with credit spreads still very tight, spreads would likely widen more than government bonds rally in a recession so you still have to have a soft landing to get maximum benefit.
Goldilocks - Powell Stresses Progress on Inflation and Labor Market, Notes FOMC Is "Proceeding Carefully" in Light of Two-Sided Risks
BOTTOM LINE: In prepared remarks at an event at the Economic Club of New York today, Chair Powell emphasized that recent data “show ongoing progress” toward the Fed’s dual mandate goals of maximum employment and price stability and stressed that the FOMC “is proceeding carefully” in light of “uncertainties and risks, and how far we have come” in the tightening cycle. In the Q&A session following the speech, Chair Powell also noted that higher long-term bond yields could reduce the need for further tightening “at the margin,” though he emphasized that it “remains to be seen” whether higher yields would actually substitute for additional hikes. In recent commentary, several FOMC participants suggested that the FOMC was likely to leave the federal funds rate unchanged at its November meeting. Additionally, a number of participants, including Vice Chair Jefferson and Presidents Williams, Barkin, Harker, Bostic, Daly, and Goolsbee, suggested that the federal funds rate had likely reached its peak this tightening cycle. Chair Powell’s and other FOMC participants’ recent remarks are consistent with our expectation that the FOMC is likely to keep the federal funds rate unchanged at its November meeting, and we continue to expect the federal funds rate to remain at its current level through 2024Q4.
Against a backdrop of a resilient economy despite significantly tight policy, US treasuries have seen persistent selloff through most of this year. The benchmark 10-year yield has risen to its highest level since 2008. Our rates strategists believe a temporary slowdown in the macro environment in fourth quarter mean the risks are skewed towards lower yields from current levels (4.91%) towards our strategists’ fair value estimate of 4.2-4.3%. Based on our macro model, 10-year treasuries (IEF) have underperformed their normal relationship with macro assets by 8% over the past 6 months, and we see a potential for mean reversion over the coming months. We believe a combination of temporarily slow growth in Q4, recent treasuries underperformance and an attractive call prices offer a compelling opportunity for investors to hedge lower yield risk using IEF calls. In this monthly series, we discuss our framework for choosing between various tactical, systematic and tail hedging opportunities…
… Treasuries have lagged macro assets Over the past 6 months, we estimate that IEF has underperformed its normal relationship with macro assets by 8%. We believe the risk of mean reversion is the greatest in the near-term as we navigate a weak Q4, rising geopolitical concerns and slowing inflation.
MS (via BBG) - US Treasuries at 5% Are a Buy, Says Morgan Stanley Investment (good to know someone out there is / may be a buyer and at what level … but then, watch what they say and LISTEN to what the DO ? or something like that…)
Yields would overshoot firm’s fair value if they breach 5%
Steeper curve, term premium have helped Fed with tightening
…“Those will be great levels to get longer in your portfolio from a duration perspective” under current conditions, said Vishal Khanduja, money manager and co-head of the broad markets fixed-income team in Boston. “We’ll be superbly in that overshoot category” from the firm’s fair value levels for Treasuries should yields breach 5%.
Benchmark US yields are fast closing in on the 5% mark, fueling debate about how much further they can rise as Federal Reserve officials pledge to keep interest rates higher for longer. Traders trying to time an entry into the market have to weigh opposing factors, as the conflict in the Middle East fuels haven bids while a swelling US deficit boosts the supply of securities.
… While Khanduja is eyeing 5% as a decent entry point, he also has a steepener trade among his favored bets. Morgan Stanley Investment is positioned for the yield curve between the two and 10-year bonds to steepen.
… Khanduja helps oversee a number of strategies at Morgan Stanley Investment, including the Calvert Bond Fund that’s gained 1.1% in the past year to beat 85% of its peers.
"Proceeding carefully" implies no rate hike at the November meeting, but Powell implies the data and risks likely determine what will unfold after that.
… Yields appeared to jump when Powell said in Q&A that policy is not too tight at the moment. Real GDP is tracking over 5% in Q3, so we interpret the observation as likely reflecting his view that policy is not so overly tight that the expansion is being put at risk.
… Longer-run rates are where? Chair Powell spent part of the Q&A with questions about the potential growth rate of GDP, which Chair Powell thought was about 2%, and also the neutral rate of interest. Chair Powell was open minded, and downplayed the concept's role in the near-term setting of monetary policy. He said he did not know where rates would settle five years from now, after all the effects of the pandemic (fiscal stimulus, the resurgent demand) washed out. He posed some conjecture of whether rates end up as high as they used to be or near the lows just prior to the pandemic? Somewhere in between the Chair seemed to wonder. We would refer back to his "stars" speech at Jackson Hole for his skepticism over concepts like r-star. He did say he did not think the zero lower bound was a problem at the moment. With the target range for the federal funds rate at 5- 1/4% to 5-1/2%, yes they have some room for a more typical cutting cycle should a recession ensue. He said the issue right now is trying to fund a sufficiently restrictive level of policy to ensure inflation moves back to 2 percent over time.
The latest babble from Federal Reserve members gave bond investors reason to hope rate hikes are finished. Bond yields have retraced some of their recent increase. The swings in the bond market, in the absence of a coherent policy framework, add an avoidable risk premium to real interest rates which has economic consequences…
… The US still does not have a functioning legislature. Markets are not likely to be surprised. The plan to empower the temporary speaker (which would have been market positive) has been rejected by Republicans. The UK’s governing Conservative Party lost two Parliamentary seats to the opposition Labour Party, with a very sizable swing of votes. Markets are not likely to be surprised.
Wells Fargo - Leading Index Says Proceed With Caution (the latest in long line of unhelpful early warning signals … OR will it be different this time? clearly something will have to break but so far, things — economically speaking — holding up far better than most suspected. perhaps it will be rates breaking HIGHER (again?) that breaks something (else aside from BANKS like March of 2023)???)
Summary While macro-level data on hiring and consumer spending continue to suggest the economy remains resilient, the Leading Economic Index is telling us to proceed with caution. The LEI has now declined for 18 straight months and is consistent with an economy that is already in recession.
Wells Fargo - Existing Home Sales Declined in September
Summary Higher Financing Costs Continue to Weigh on the Housing Market The housing market continues to cool alongside the recent run-up in borrowing costs. Existing home sales declined 2.0% to a 3.96 million-unit pace during September—the fourth straight monthly drop and the slowest pace of resales since 2010. The major culprit behind sales falling to the lowest level in 13 years is the recent leg-up in mortgage rates, which has worsened affordability for prospective buyers already dealing with scarce supply and high prices
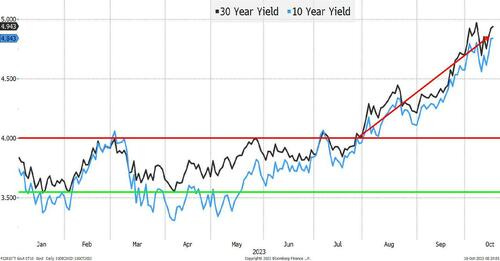
Fed Chair Jerome Powell should be very concerned about the rapid disinversion of the yield curve since early July as the bond yield soared from around 4.00% to nearly 5.00% today. If he is, he didn't show it during his interview today. Instead, he noted that the economy remains strong and monetary policy might have to be tightened some more: "We are attentive to recent data showing the resilience of economic growth and demand for labor. Additional evidence of persistently above-trend growth, or that tightness in the labor market is no longer easing, could put further progress on inflation at risk and could warrant further tightening of monetary policy."
Powell characterized the bond market debacle in recent months as another sign of tightening credit conditions rather than as a very significant tightening of monetary policy that is equivalent to at least two if not four 25bps hikes in the federal funds rate, in our opinion.
The yield spread between the 2-year and 10-year Treasuries narrowed to -18bps today from -108bps on July 4 (chart). In the past, the yield curve disinverted just prior to recessions as the Fed lowered interest rates faster than bond yields fell in response to financial crises that triggered credit crunches and recessions. This time is certainly different. The banking crisis during March was quickly contained by the Fed and the Godot recession remains a no-show because liquidity remains ample and household and business balance sheets are in good shape.
Today's economic data were mixed. Existing home sales were weak, but that partially reflects a shortage of homes for sale. The jump in the 30-year fixed mortgage rate to 8.00% from 7.00% this summer is undoubtedly weakening demand for housing as mortgage applications continue to fall…
We have finally heard a lot about real rates and are even starting to see more stories about how higher yields are really punishing small and mid-size companies (Sept. 13 – The Real Story is Real Yields). As discussed at the time, we had an inkling that this “story” was bubbling to the surface. We discussed how this affects not just the Fed, but also politicians. Many in Congress receive much of their campaign support from local businesses. As it becomes apparent that many small and local banks are in “balance sheet protection mode” (not looking to lend aggressively) and the private credit markets are much more expensive, it will hit politicians. The “bogey man” will not be inflation, but the concerns of local businesses (and campaign funding).
But enough on that subject or other “wonky” things about R*. Let’s move to the main issue - the rates markets have been hijacked by D.C.
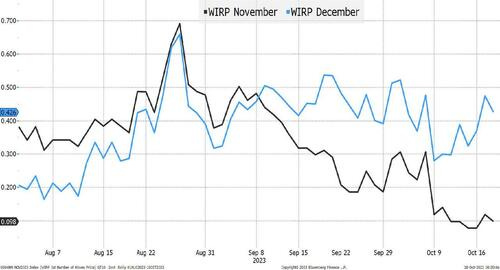
Since August, the markets have not priced a full hike between the November and December meetings. In late August, there was a 70% chance of a hike in November (that has dropped to a 10% chance). The probability of a hike in December has fluctuated between 30% and 55% since the end of August.
Yes, WIRP has shifted a bit further out on the curve (fewer cuts getting priced in), but the reality is that the 30-year Treasury yield went from 3.8% in July to 5% in October because of something other than the Fed.
The TIC data from China, showing that their holdings dropped from over $1 trillion in March to likely $800 billion by now ($821 billion was the end of July number) has certainly not helped. China is likely drawing down on their reserves to support their economy, but this shift from being a big buyer to allowing their holdings to run much lower has not helped yields.
But even that doesn’t resonate (especially since Japan has recently been increasing their Treasury holdings).
The real story is that D.C. is now driving bond markets.
Yields had bounced around for much of the year (between 3.5% and 4% on the long bond). Since the middle of July, they have been on a one-way street to higher yields.
We have seen a relentless push towards higher yields. While some of that is from the Fed’s messaging of “higher for longer,” the better/more realistic analysis is that the rise in yields lands squarely at the feet of politicians, not the Fed…
… Bottom Line
The Fed and Powell know that:
The lag effect (made longer by Smart Borrowers) is kicking in, so they need to be cautious on how hawkish they sound.
They have lost some control over the long-end and being hawkish will do little to fix that, at least not when it is fiscal policy concerns that are driving those bonds. Our fiscal outlook only looks worse as yields (and funding costs) rise.
Geopolitical uncertainty is high and while the price of oil might be going higher, the risk of disruption to the global economy is a bigger threat and should make him hesitant to tighten monetary policy further.
Expect dovish comments across the board from the Fed ahead of the quiet period. OK, they will be somewhat hawkish because they must be, but not as hawkish as bond bears still think.
Do not expect any help from D.C., but the supply fears seem potentially overdone and any rally in Treasuries could trigger a lot of short covering in that market.
I still like Treasuries and risk assets, though my enthusiasm for risk assets is being curbed by the increased threats in the Middle East as published earlier today (link).
Bloomberg- Who's in the driver's seat, Powell or bond yields? (OpED by Authers)
… Powell continued: “There’s no precision in our understanding of how long lags are,” adding that it’s been a year now since the last 75 basis-point hike, which was in November. “So we should be seeing the effects... By the way, they don’t just all arrive on one day.”
All of this was taken as a broad hint that the Fed wouldn’t need to hike rates again, because the bond market was doing the work. Therefore, yields on two-year Treasuries — more sensitive to imminent Fed moves — declined after Powell spoke, while the dollar fell, and the S&P 500 rose. Now, traders see less than a 50% chance that the central bank lifts rates one more time. Read our live blog here.
However, after another four hectic hours of trading, the market had turned around almost completely. The S&P 500 was down for the day, while the 10-year Treasury yield (shown inverted in the following chart) was again approaching 5% for the first time since 2007:
Why did this happen?
… “Given the uncertainties and risks,” Powell said, the FOMC was proceeding “carefully.” He insisted they would look at the “totality” of the data when making decisions. Also on Thursday, a slew of other Fed speakers spoke on the record, including regional presidents Austan Goolsbee (Chicago), Raphael Bostic (Atlanta), Patrick Harker (Philadelphia) and Lorie Logan (Dallas). None of them significantly contradicted Powell’s message.
Whether he’s really being prudent is another issue. While Powell said correctly that the rise in yields so far has not been primarily about rising inflation expectations, it’s noticeable that bond market inflation breakevens have risen sharply in recent days, and rose again after his comments. It looks as though the market’s confidence that inflation has been beaten might be beginning to shake.
Stephen Stanley of Santander described the Fed as “being willfully dovish at the moment,” and predicted that another hike would be needed by the end of the year. He added, in a note:
I’m puzzled by the sudden FOMC fascination with 10-year Treasury yields as the be-all, end-all indication of the economic outlook. For years, Chairman Powell has insisted that the Fed looks at financial conditions broadly rather than at a particular single measure. Well, I am sure that it will snug in the coming weeks, but the Chicago Fed Financial Conditions Index, which is just what the Fed says that it likes (a broad index that includes both market measures and other indicators, such as from the Fed’s Senior Loan Officer survey) was, as of the end of last week, at its easiest reading since the FOMC began to raise rates. Yes, you read that right.
Others were alarmed by the apparent ease with which the Fed is facing the rise in yields. “There is no playbook,” Powell noted. “With the benefit of hindsight, could we have done a little bit less and had a little bit of inflation? I guess we could.” …
Trading volumes in $TLT today set a record, breaking the March 6, 2020 pandemic peak.
Today’s Chart of the Day was shared by ForexLive (@ForexLive). Bonds continue to fall off a cliff, with the +20-Year Treasury Bond ETF ($TLT) dropping to its lowest since 2007. Another -3% lower would mark an all-time low for $TLT. ForexLive points out that volume set a new record today, with $TLT trading more than 87 million shares. The previous record was set on the day of the all-time high in 2020. Volume spikes often indicate capitulation. However, you never really know when enough is enough. You're better off sticking with the trend, which remains unequivocally lower.
Investopedia CHARTADVISOR - You Will Pay More at the Gas Pump (sorry but…you prolly already know this…)
2-day streak
Gasoline futures have risen for the second consecutive day and are currently trading at around 2.33.
For the second day in a row, we have observed a similar price trend. These trading sessions have been characterized by initial declines ranging from -1.44% to -2%, followed by swift recoveries that resulted in gains of over 2%.
Gasoline futures are now on the verge of closing the session in positive territory, marking three consecutive days of gains. Will we continue to witness this pattern for the remainder of the week?
… Inverted Yield Curve
The yield curve remains inverted while the S&P 500 attempts to maintain the 4,350 level.
The chart below illustrates past instances of yield curve inversion and the subsequent impact on stock markets when the curve reverts from a negative state to normal.
Courtesy of StockCharts.com
Such an inverted curve is often interpreted as a signal that investors are anticipating an economic slowdown or even a recession.
It is also correlated with a decrease in stock returns, as investors may become more cautious and shift their focus towards safer assets, such as government bonds, rather than stocks.
During periods of yield curve inversion, investors tend to seek out stocks from companies considered defensive, i.e., companies that tend to be less sensitive to economic fluctuations.
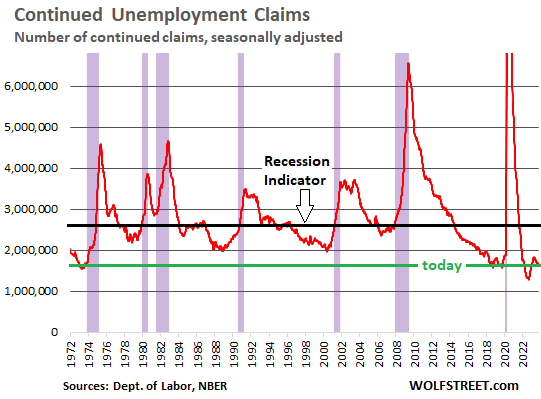
WolfST: My Favorite Recession Indicator: No Recession in Sight Yet (his not mine but nothing wrong with his and his view of it)
… Recessions from the Great Recession back through the early 1980s began when continued claims for unemployment insurance spiked through about the 2.6-million mark (black line), which makes it a recession indicators. Today’s level of 1.73 million is far below recessionary levels, pointing instead at a labor market that is still tighter than in the prior 50 years.
There will be a recession someday for sure. There always eventually is a recession. But when? Not yet. Other labor market data, which lag unemployment claims data a little, gave us similar indications, and I’ve discussed them most recently here, here, and here.
What this labor market is telling us recession watchers here is that there is still no recession in sight, and we’ll just have to keep watching for it.
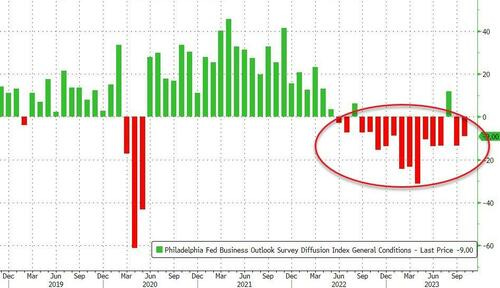
ZH - Philly Fed Future Expectations For Shipments/CapEx Near 'Worst Since Lehman' Levels (ANY time you hear ‘worst since LEHMAN’ esp on anniv of Black Monday as yest was, well, you pause and consider…)
… The headline Philly Fed Business Sector Outlook survey print was -9 in October, worse than the -7 expected, but a small bounce from the -13 print in September, as almost 35% of the firms reported decreases in general activity this month.
That is the end of the good news.
This is the index’s 15th negative reading in the past 17 months.
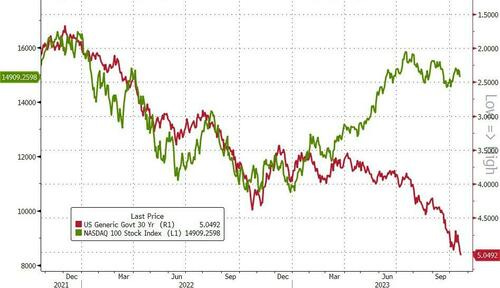
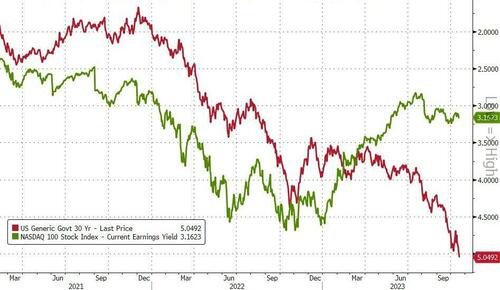
ZH - "Impervious" Nasdaq Risks Big Downside If Mideast Conflict Spirals (given TECH = RATES = TECH, I thought this was worth posting for posterity sake …)
… But with yields pushing higher, they have started making an about-turn. An escalation of the conflict in the Middle East may just be what sends indexes back to fair value, and that would mean a drop of 14% for the Nasdaq 100.
While the contours of any ensuing conflict are beyond of the scope of discussion here, a protracted ground invasion may just be what forces a broad rethink of valuations across markets - and that would be particularly troubling for equities that have ignored fundamentals.
The fair value is 12,877 for the Nasdaq 100…
… That frenzy has overlooked soaring Treasury yields. While it was easier for traders to overlook risk-free nominal yields as they climbed successively through 3% and 4%, rates above 5% pose a significant hurdle for the simple reason that the latter is often the discount rate most suited for several investor groups.
Foundations, for instance, are typically required to spend at least 5% of their asset value every year, so their targeted returns are generally around 7%+ - so as the discount rate gets higher and higher, the less in real returns they have to spend from.
So the longer Treasury yields stay above 5%, the more equities will suffer.
Finally from the bowels of #FinTWIT the following was spotted and pause worthy,
With Treasury yields moving past Bernanke-era levels, maybe this needs another look: