(USTs steeper / cheaper on above avg volumes) while WE slept; "The Fed Still Has a Lot of Quantitative TIGHTENING to Do" (-Dudley, moar supply) and / or "Rates Can Never Rise" (Gundlach 10/3) AND ....
Good morning … The world will pause today and remember this day in history. It was 1987 when the Dow Jones FELL 22.6% (508pts) … Also known as Black Monday … For more on Black Monday (Wiki HERE) where you’ll find some context …
AND for more, the NYT ‘held the front page’ …
Those who do not learn from history, something something something .…
AND… getting then back IN my lane of RATES … SO, the higher rates go the less the Fed has to do because higher rates WILL slow all things down including but not limited to the economy AND inflation, right? Evidence March of this year (and all of 2007 / 08 for example) …
… Should the real side of the economy soften, we will have more room to wait on any further rate hikes and let the recent run-up on longer-term rates do some of our work. But if the real economy continues showing underlying strength and inflation appears to stabilize or reaccelerate, more policy tightening is likely needed despite the recent run up in longer term rates." - Governor Waller, October 18, 2023(p9 of 9)
Thinking out loud here for a sec … the higher rates go the more they are said to allow FED not to HIKE as much but at same time, the higher rates go, the higher the cost of every new bit of debt (which has been high and rising). This THEN will likely lead to INCREASED issuance to pay INCREASED interest expense on the higher rates / debt and so … less Fed but MOAR Treasuries … UNTIL something breaks?
From unsked bond buying (from BoJ) to a Treasury auction out on the kinky part of the curve (20s) …
ZH: Market Rejoices After Solid, Stopping Through 20Y Auction Isn't A Disaster
… The details: the high yield of 5.24% was of course the highest on record for the tenor that was launched in May 2020 when the US needed to rapidly issue trillions in new debt... and still does. The yield was a whopping 64bps higher than September's 4.592% but it stopped through the When Issued 5.257% by 1.2bps, the biggest stop through since June.
The bid to cover of 2.59 was subpar, below last month's 2.74 and below the recent average of 2.68, so nothing to write home about.
The internals were decidedly better with Indirects taking down 72.9%, the highest since February and well above the six-auction average of 69.4%; and with Directs awarded 15.2%, the lowest since July 2022, Dealers were left with 11.9%, just above the recent average of 10.2% …
AND 20s today up nearer 5.30% … hey, one GOOD ‘ish auction in a row is a pattern, right? Never mind…
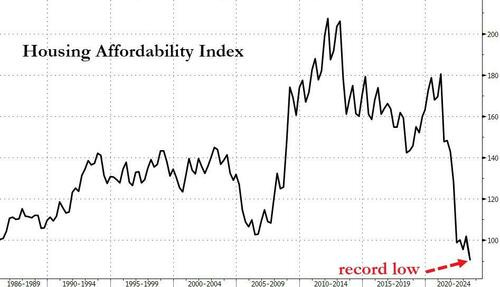
There’s NEVER a shortage of narratives to read and then note how fast they are rewritten almost as soon as we’ve finished readin’ em … Take, for example the idea about mortgage rates and AFFORDABILITY …
ZH: As Mortgage Rates Hit 8%, US Housing Affordability At Lowest Level Since The '80s (this may not SEEM like a big deal … but then, thats likely cuz you don’t have to move or refi …)
… The NAR Housing Affordability Index clocked in at 91.7 in August, down from 93.9 in July - anything below 100 indicates a household with a median income does not earn enough to be approved for a mortgage on a median-priced home. This was the lowest reading since at least the early 1980s.
NAR figures highlighted that the typical family needed to earn $107,232 in August to qualify for a mortgage, based on a 20 percent downpayment. It was the third consecutive month of a six-figure headline number …
… I’d be willing to bet this (and impaired consumer as well as trickle down impact of housing sector) will all weigh heavily on HIMCOs process of thought and his quarterly note whenever it is released … meanwhile, as we wait, here is a snapshot OF USTs as of 705a:
… HEREis what this shop says be behind the price action overnight…
… WHILE YOU SLEPT Treasuries are…you guessed it…steeper and cheaper. Slightly above average volumes precede Powell’s noon-time address, a bit of jumpiness seen overnight in JGBs (20y +4.5bps) and Antipodean rates (NZ10y +10bps, AUS 10y +13bps). Little fundamental news was on offer, technical paying seen in long-ends as 30y US & UK move >5.05%. The DXY is unchanged but USDCNH pushed >7.33, while mainland bourses struggled with property (SHPROP -1.1%) a focal point. Oil and natural gas prices eased (TZT -7.5%), though geopolitics remain fluid. S&P futures are -3pts here at 7:15am.
…
Interesting eye candy, indeed … and for some MORE of the news you can use » The Morning Hark - 19 Oct 2023 and IGMs Press Picks (who CONTINUES to be sportin’ that new, fresh look) in effort to to help weed thru the noise (some of which can be found over here at Finviz).
Moving from some of the news to some of THE VIEWS you might be able to use… here’s SOME of what Global Wall St is sayin’ (in a similar sorta way you’ll find content if you pay for ZH PREMIUM? except … they are SELLIN other folks data where as I’m just point it out and links provided — should work IF you have permission and should NOT work if you don’t … HOW can THEY do that?? askin’ for a friend as I never understood how they do it…)
Barclays - Federal Reserve Commentary: Change in Fed call: Postponing the hike to December
In light of recent FOMC communication arguing for a pause at the November FOMC meeting, we change our rate call, postponing the 25bp rate hike to December, despite the stronger-than-expected labor market, activity and CPI inflation data.
BNP - Middle East risk could more than double gas prices, raise Brent by 33% (this one as hard to read as it might sound like it is…)
Escalation risks in the Middle East significantly increase our high cases for oil and gas even as our base cases assume a contained conflict with modest risk premia.
In a scenario of escalation beyond our base case, we believe oil prices could rise to USD120/bbl (33% above today’s level) while EU gas prices could more than double to EUR110/MWh.
Trade idea: We initiate a EURUSD one-touch put to hedge supply-driven energy price shock risk…
Credit Agricole (CA) - Increasing our UST yield forecasts (and the best thing ‘bout increasing f’cast — so a mea culpa of sorts — is that RATES now doing the Fed’s dirty hiking work…)
We revise our US Treasury yield forecast in light of the Fed’s hawkish ‘higher for longer’ stance and recent long-end CTD switch/exotic flows, as well as convexity risks, expecting the 10Y Treasury yield to end 2023 at 4.50% from 4.00% in the prior forecast…
… We expect Treasury rates to decline gradually next year, as growth slows down beginning in Q423, which should lead to further deceleration in 2024, although a near-term recession has become less likely given strength in recent economic data.
We expect the yield curve to steepen in 2024, as the Fed starts cutting rates beginning in Q324. The 2-10Y curve inversion disappears by end2024 in our forecast.
Rising long-end rates support the Fed taking a pause at the 1 November meeting, as Fed officials see high bond yields as a substitute for rate hikes. That said, any significant growth and inflation surprises could change pricing expectations for future meetings.
DataTREK - 10-Year Yield Top, Global Equity Correlations (would be awesome if we could take any of this sorta ‘analysis’ seriously as nobody can possibly know WHERE the top will be except in the fullness of time and looking back in that rear view mirror…but still they try and so will say ‘they told us so’ if / when it happens)
Topic #1: Where is the top on 10-year Treasury yields? Ever-higher interest rates have been harrying US equities in recent weeks, even if the damage has been limited. After all, if we had told you at the start of the year that earnings expectations would be flat, but 10-year Treasury yields would go from 3.9 to 4.9 percent, you would likely have thought stocks would be down 10 percent or more. Yet the S&P 500 is up 12.4 percent YTD, and even the Russell 2000 is only down 1.7 pct.
We have been focusing our work in recent days on 10-year real (ex-inflation) interest rates, because inflation expectations have been stable this year. In January they were 2.3 percent. Now they are 2.4 pct. Our troubles do not come from this quarter.
The following chart shows 10-year real rates from 2003 to the present. The spike on the rightmost part of the graph, from 1.6 percent in January 2023 to 2.4 pct now, explains why nominal rates have gone from 3.8 to almost 5.0 percent YTD.
To consider where real rates may top out, we took the average of all zero or positive daily readings over this period. The two protracted periods of negative real rates (2012 – 2013, 2020 – 2022) were due to Federal Reserve quantitative easing and therefore do not reflect market-based rates. The data:
When periods of Fed QE-induced negative rates are excluded, the average real 10-year Treasury yield is 1.2 percent with a standard deviation around that mean of 0.8 points.
That makes the 2 standard deviation upside level 2.8 percent for real yields, which is also the peak in June 2007. Even during the 2008 Financial Crisis, 10-year real yields could not hold above 2.8 percent for more than a few weeks in October – November of that year.
Takeaway (1): Add current inflation expectations of 2.4 percent and real rates of 2.8 percent and you get a nominal 10-year yield of 5.2 percent. We closed today at 4.9 percent. Near term price momentum, and this analysis, both say that a low 5-percent yield are in our near-term future.
Takeaway (2): US equities have been remarkably patient as yields have moved higher, likely for 2 reasons. First, this is not the 1970s, when corporate profit margins were 5-6 percent; they are double that now, at 11 percent. Second, equities can afford to be patient on this issue, knowing that real yields seldom stay at 2 standard deviations above the mean for very long. We will likely see some further equity market volatility as rates continue to increase, but we do not expect a major market dislocation as a result of this move…
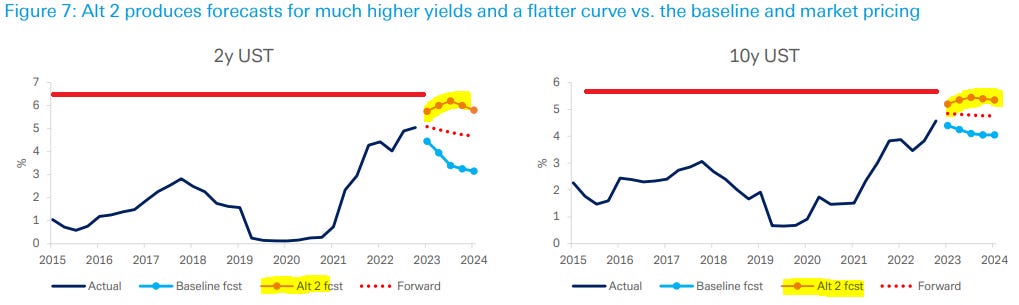
DB - What's the upside? (to yields f’casts…which had been recently updated and now lean further upwards)
We recently updated our USD rate forecast. The key underlying assumption was that a mild recession early next year would lead the Fed to cut much more aggressively than market pricing. At the same time, we raised our projections for r-star and term premia. Based on these assumptions, we forecast the 2y and 10y to end this year near 4.5% and decline further next year as recession and Fed cuts take hold.
We noted in the forecast that we viewed our assumptions on r-star and term premia (TP) as conservative, with material upside to both. And, since publishing, upside surprises in key US economic data – payrolls, CPI, and retail sales – call into question our assumed fed funds rate path.
Against that backdrop, here we explore alternative scenarios, with the goal of dimensioning upside yield risk. Specifically, we examine alternatives along the three key dimensions: r-star, term premia, and the Fed policy cycle. For each, we consider plausible upside calibrations: (1) r-star of 2%, (2) TP estimates based on supply and other fundamentals that fall in the 70th percentile of the 1994-2014 distribution, and (3) a path of policy restraint modeled on the SEP dots.
These alternatives produce 2y and 10y yields that reach 6.20% and 5.45% in the middle of next year, respectively. They clarify what underlying fundamentals would support yields at those levels and along with our baseline form a benchmark for dimensioning risk-reward.
DB - Consumer spending and government hiring spree lift Q3 GDP (nothing to see here but rainbows, leprechauns and pots of gold, I suppose … with spending REQUESTS from govt set to expand further I’d also expect the Hobbit’s requests for BIDS to expand too and so …)
With Q3 retail control now tracking up 6.4% annualized relative to its Q2 average, we have revised up our Q3 forecast for real PCE growth to 4.2% (from 3.5% previously). In addition, the 144k rise in state and local government employment last quarter has raised our forecast for Q3 government consumption and investment growth to 2.9% (from 1.1% previously). The upshot of these developments is that Q3 real GDP is now projected to rise 5.2% annualized (versus 4.1% previously).
At this point we have not made any changes to our broader outlook. We continue to expect real GDP growth to slow meaningfully in the current quarter as consumer spending faces several intensifying headwinds. Indeed, our base case remains that the economy will slip into a mild recession in the first half of next year (see "US outlook: Soft landing dreams or will the landslide bring it down?").
That said, as we recently outlined (see "Dovish arguments are dicier when the data are not cooperating"), recent data have raised the probability of a more hawkish outcome, where the Fed needs to raise rates again. If such an outcome is realized, it would equate to a delayed landing scenario relative to our baseline, that would likely produce substantially tighter financial conditions and raise the risks of a harder landing than we currently anticipate. Though this outcome could be consistent with a somewhat later slowdown in the economy, the eventual weakening in growth would likely be more dramatic and followed by a steeper rate cut profile from the Fed.
Invesco - Is a US recession coming? (seems too good to be true … Transitory has become Goldilocks … )
… Outlook: Mild, brief recession While most of the economic indicators I watch aren’t signaling a recession, some are negative and some warrant caution. Based on the lagged effects of tightening, however, we believe the US may experience a mild recession in early 2024.
JPM- Daily Economic Briefing: Upgrading US growth, again (…and ‘bout those rate CUTS then?)
Today’s September activity readings for the US materially beat expectations. In response, we are revising up our forecast for US 3Q real GDP growth to 4.3%ar (from 3.5%). The gap between our forecast and the Atlanta Fed GDPNow forecast closed even as they raised their 3Q23 GDP growth estimate to 5.4%ar (from 5.1%). While we still see US growth slowing to a 1.5%ar in 4Q, incoming activity data show still-solid momentum overall…
LPL- Can the Rebound in Stocks Continue? (welp, day late dollar short on this one as stonks did manage to go down yest…)
Key Takeaways:
The S&P 500 has made an impressive recovery after finding support near 4,200, a level that traces back to an uptrend off the October 2022 lows and the rising 200-day moving average (dma).
Momentum is improving off deeply oversold levels. The S&P 500’s Bullish Percent Index (BPI) recently fell below 30%. Historically, oversold BPI readings of this magnitude have represented buying opportunities. The broader market has posted respective average one-, three-, and six-month returns of 2.7%, 6.1%, and 8.8% after the BPI crosses below 30%.
Of course, the current recovery doesn’t come without risks, and we continue to view monetary policy uncertainty, escalating geopolitical tensions in the Middle East, and the recent breakout in both the dollar and Treasury yields as major headwinds for continued equity market momentum”
… As shown below, the pullback off the July 31 high found support just above 4,200 earlier this month. This key support area coincides with previous highs and lows, an uptrend off the October lows, and the rising 200-dma.
The middle panel of the chart shows the BPI for the S&P 500. The BPI represents the percentage of stocks within the S&P 500 with a current Point & Figure buy signal—a field of technical analysis that utilizes filtered price movements to generate buy and sell signals. BPI readings above and below 50% are considered bullish and bearish, respectively, while the BPI can also be utilized to identify overbought (readings above 70%) and oversold (readings below 30%) conditions. Earlier this month, the BPI fell to only 28.2%, marking over a two-standard deviation move below its average since 1996.
Finally, the bottom panel shows the Moving Average Convergence/Divergence (MACD) indicator. MACD combines momentum and trend following into a single indicator using convergences and divergences between a long- and short-term exponential moving average. The indicator has recently rebounded from its lowest level since October 2022, triggering a buy signal early last week.
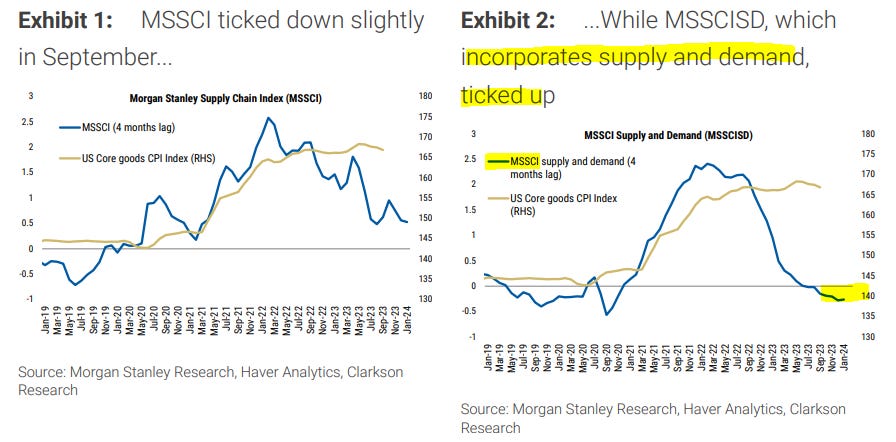
MS - MSSCI: Holding Still (important here … supply chain stuff BUT … holding is NOT by def, ‘good’ and note the BBG tickers for those still blessed with a Terminal)
The Morgan Stanley Supply Chain Index (MSSCI) was flat in September. Global demand PMIs continued to improve, while our index incorporating demand factors (MSSCISD) moved slightly upwards, breaking a 16-month streak of declines.
… "MSSCI supply and demand" (MSSCISD) ticked up, but remains below pre-Covid levels: MSSCISD ticked up slightly after falling for consecutive 16 months, but remains below its 2019 average of -0.24. Global Manufacturing New Orders and Manufacturing Quantity of Purchases PMIs increased by 0.79 and 0.38 to 47.3 and 46.0, respectively, led by US PMIs, which increased by 2.67pt and 1.88pt, respectively. UK, Korea and Taiwan PMIs also increased, while Japanese PMIs contracted sharply by 3.14pt and 3.28pt, falling below 46..
RBA - Opportunities in Fixed Income – RBA Fixed Income Insights (am ALWAYS interested in FI opportunities… :))
… Below we highlight four compelling investments for the remainder of 2023 and into 2024.
1 - Real Yield (TIPS): Treasury Inflation-Protected Securities (TIPS) currently offer compelling value with 10-year real yields at approximately 2.5%. This is the first opportunity investors have had to lock in real returns above 2% since the Financial Crisis and the top 25th percentile of yield since TIPS were first issued in 1997. Despite increased nominal yields and inflationary pressures — particularly given a 34% surge in oil prices since June — inflation expectations have remained relatively stable. If inflation expectations were to rise, TIPS could experience a significant increase in returns. Conversely, if nominal yields were to decrease while inflation expectations remain steady, TIPS returns could be on par with those of Treasuries.
2 - Yield Curve Steepeners: Given the nearly historic inversion of the 2s10s yield curve, we see a potential opportunity to benefit from either an economic reacceleration or a severe downturn, both of which would likely lead to a steeper yield curve. In the scenario of renewed growth and inflation, we anticipate further bear steepening, where long-term yields rise more than shortterm yields as the long end of the interest rate curve is most sensitive to long term growth and inflation expectations. Conversely, in the event of an economic contraction, bull steepening would likely occur, with short-term yields declining more than long-term yields as the market prices Fed rate cuts.
3 - Preferred Securities … 4 - Agency Mortgages…
UBS - Waller previews Powell (reason I’m passing along this one is the first line which is about all I needed to read … narrative has shape shifted along with higher yields come less NEED for hike at least perception currently working through Global Wall St at moment and for good reason … they keep sayin’ it… and IMO every time they say it their credibility goes incrementally LOWER … if that were possible at this point)
The yield rise may do some work for them, but the data needs to cooperate Federal Reserve Board Governor Christopher Waller said in a speech today that it is too soon to know whether more rate hikes will be needed. Chair Powell seems likely to use different words, but as we discussed in our preview last week, he seems unlikely to rule anything out. We expect the Chair to say the FOMC can proceed carefully, but that the Committee would raise rates further "if appropriate."
… In that way he used the recent theme of proceeding carefully, but warned that option of more rate hikes remains on the table …
… Governor Waller acknowledged the rise in yields too, but future policy decisions would be determined by the data - whether the expansion cools and whether inflation continues to move toward the 2.0% objective.
… "I will be looking carefully at the data to see whether the real side of the economy begins to cool off or whether prices, the nominal side of the economy, heat up. As of today, it is too soon to tell. Consequently, I believe we can wait, watch and see how the economy evolves before making definitive moves on the path of the policy rate. Should the real side of the economy soften, we will have more room to wait on any further rate hikes and let the recent run-up on longer-term rates do some of our work. But if the real economy continues showing underlying strength and inflation appears to stabilize or reaccelerate, more policy tightening is likely needed despite the recent run up in longer term rates." - Governor Waller, October 18, 2023
No fewer than seven members of the Federal Reserve speak today. Some are highly qualified economists who grasp the complex structural upheaval affecting the US economy. Fed Chair Powell is also speaking. The initial success in talking down bond yields has reversed. The Powell Fed’s data dependency means markets overreact to every data release, and the farce on Capitol Hill makes things worse.
UBS - Housing starts bounce back; mortgage apps look for a bottom (lookin’ but still nothin’ in sight??)
… Mortgage applications hit three-decade low The Mortgage Bankers Association reported that mortgage applications for a home purchase dropped by 5.6% in the week ending October 13. The headline index, for all mortgage applications, declined by 6.9% in the same period. Both indicators erased last week's marginal gains and set another record low in the 21st century. The index for a home purchase is now 15% below the post-GFC trough and the 4-week average continues to trend down. The contract rate on the 30-year fixed rate mortgage, also reported by the MBA today, edged up 3 bps to 7.7% in the reporting week, marking the sixth straight weekly advance.
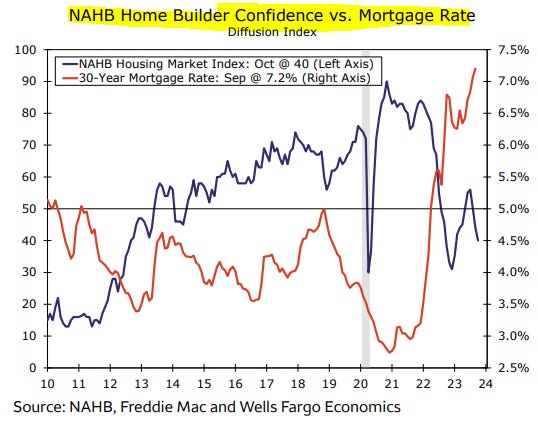
Wells Fargo - Housing Starts Perk Up in September (it’s the BUT…and there’s always a big ‘ole butt…isn’t there? ok there may not be one exactly in their notre BUT it’s implied…or shall I say a$$umed…)
Summary Higher Mortgage Rates and Sliding Multifamily Permits Suggest a Coming Pullback Total housing starts moved in line with expectations in September, improving 7.8% to a 1.4 million-unit pace. September’s gain was broad-based across single- and multifamily construction. Builders continue to ride the tailwind of resilient single-family demand as they find success using incentives to sell homes in the higher mortgage rate environment. We find it unlikely that this level of demand can be sustained, however. Mortgage rates have climbed near 8.0% in recent weeks, which will likely test builders’ abilities to continue bridging the affordability gap for buyers. Meanwhile, multifamily starts picked up for the first time in four months, driving the bulk of September’s gain. We caution that multifamily data is highly volatile from month to month, and an ongoing slide in multifamily permits points to weaker apartment construction ahead.
… And from Global Wall Street inbox TO the WWW,
AT AlfCharts(AllStar guy on ‘flation and while not sure inflation works this way and well with technicals, IF one believes, then rates coming back down AND you know, rate CUTS any time soon, well, might have left the barn?)
The bond market suggest inflation will remain elevated moving forward. New 52-week high for the TIP/IEF ratio.
Bloomberg- The Fed Still Has a Lot of Quantitative TIGHTENING to Do (Dudley OpED and emphasis MINE and this is a good one to re/read and keep to compare and contrast against latest from HIMCO if / whenever it is released … standing by…)
… There’s also a new complicating factor: the Fed’s reverse repo facility, where money market mutual funds and others have parked some $1.5 trillion (as of October 11), at interest rates exceeding 5%. As quantitative tightening continues, cash will migrate from the Fed’s facility to other repo markets in pursuit of higher rates, increasing the supply of reserves. (If this doesn’t happen on its own, the Fed will help it along by slightly lowering the reverse repo rate relative to other money market rates.) About $1 trillion has already moved over the past year, even as the Fed has shrunk its balance sheet by $800 billion, resulting in a net addition of $200 billion in reserves.
So when will quantitative tightening end? Assuming an annual runoff rate of $900 billion, nominal GDP growth of 4% and reverse repo balances declining to zero, reserves should reach the initial target of 10% of GDP in about two years. At that point, the Fed will slow the run-off pace as it assesses what constitutes an appropriate reserve buffer.
I see three main repercussions. The first will be upward pressure on long-term interest rates and on the bond term premium — the added yield investors demand to lend for longer. Second, higher term premiums will tighten financial conditions, allowing the Fed to keep interest rates lower than it otherwise would (as Dallas Fed President Lorie Logan implied in a recent speech).
Finally, by increasing the volume of securities that market participants must absorb and finance, quantitative tightening will risk further turbulence in the Treasury market. Currently, the supply of Treasuries is expanding by nearly 10% of GDP ($900 billion in Fed runoff plus a federal budget deficit of $1.7 trillion), potentially straining the balance sheets of the dealers at the center of the market.
It’s possible that serious dysfunction in the Treasury market could cause the Fed to relent. Barring that, quantitative tightening should proceed unabated, and this should put upward pressure on long-term interest rates until at least late 2025.
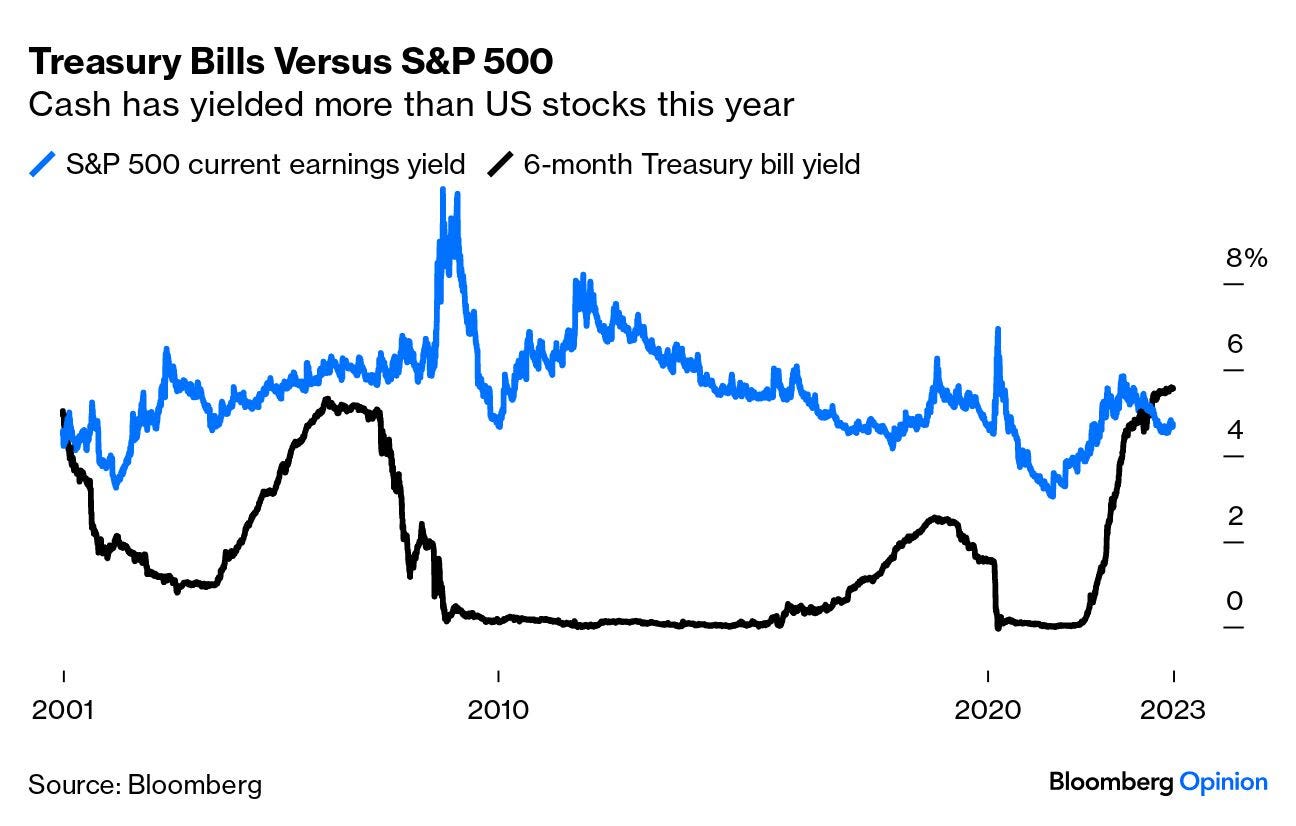
Bloomberg- There's finally an alternative to TINA. Plus: CEO humility (Authers’ OpED with snazzy and familiar chart of TBILLS vs STOCKS and one on 60/40 — so, wait, my peeps in the ‘40’ … they gonna be ok? bonds DO — or will — have more fun and aren’t quite dead yet?)
What If Cash Is Still Trash?
“There is no alternative” — or TINA — has been the battle cry of investment analysts and advisers for the best part of a decade. As interest rates stayed close to zero, money managers typically saw stocks as the only viable investment option to give desirable returns.
That’s changed. The mood music has shifted since the Federal Reserve began its retreat from ultra-loose monetary policy. All of a sudden, investors do have some alternatives. The 10-year Treasury yield has almost reached 5% for the first time since 2007, and cash is yielding more than that.
The fixed-income space has become more volatile than stocks, and by one measure, the swings in bond prices are expected to keep exceeding those for equities by the most in at least 18 years. That seems to offer opportunities for trading, while the worst that can happen is a 5% yield until maturity.
Or if you really want to avoid commitment, cash is proving so attractive that more and more investors are choosing to invest there and staying put. A quick look at the yield of six-month Treasury bills proves their point. For the first time this century, cash pays a higher yield in interest than the S&P 500 does in earnings — and with cash you actually get the cold hard money in your hands, rather than relying on accountants to calculate corporate profits correctly:
Hence it should be no surprise that global fund managers polled by Bank of America Corp. are increasing allocations to cash in preparation for weaker economic growth over the next 12 months…
… with the cash rate peaking and expected to end up hovering around 2% to 2.5% over the next five to 10 years, other assets will offer more compelling returns, she said.
Like what? To the strategists, the popular 60/40 portfolio isn’t dead (despite exaggerated rumors of its demise), and in fact is a significantly more compelling investment than cash over the coming decade. The strategy of putting 60% of assets in equities and 40% in Treasuries is set to outperform cash by an annualized 4.1 percentage points, and inflation by 4.5 percentage points, over the next 10 years, strategists at JPMorgan said in the new edition for 2024 of its long-term capital market assumptions (which can be downloaded here). That’s even with money-market funds paying upward of 5% these days, they noted.
Indeed, JPMorgan believes that by supplementing the traditional asset mix with a 25% allocation to alternatives — including private equity, infrastructure, real estate and commercial mortgage loans — investors can boost their returns by an additional 0.6% percentage points annually over the next decade, while also reducing risk. Here are the firm’s calculations in dollar terms: $100 in cash will be worth just $133 in 10 years; by comparison, the same amount invested in a model 60/40 portfolio will grow to $197. Add alternatives to the mix and that increases to $208.
That does sound good. But if you’re not confident in their reasoning, There Is An Alternative.
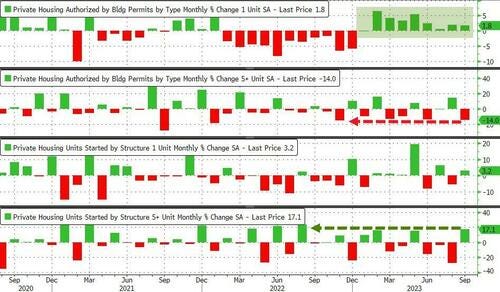
ZH: Housing Starts Slump In September; Rental Permits Plunge As Homebuilder Confidence Crumbles
… Under the hood, multi-family rental permits plunged by the most since Nov 2022 while single-family permits rose for the 9th straight month. Multi-family unit starts rose by the most since Aug 2022...
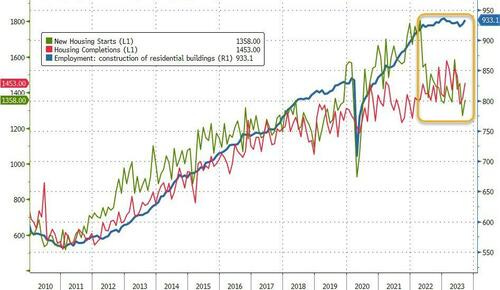
… So, why is construction employment still holding near its highs...
Will The Fed be pleased to see permits going down? Their hawkishness is driving homebuilders to produce less inventory? That will not help 'prices' and 'affordability'...
WolfST- 30-Year Treasury Yield Spikes past 5%, 30-year mortgage rates hit 8%, Mortgage Applications Plunge
… These long-term yields above 5% are an indication that a form of normalcy is gradually being forced upon the bond market by the resurgence of inflation, and by the belated realization that this inflation isn’t just going away on its own somehow. This is a huge regime change, after years of the Fed’s QE and interest rate repression, and all prior assumptions are out the window.
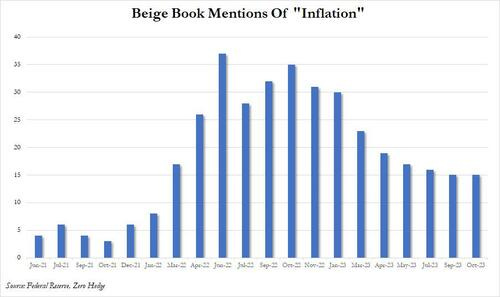
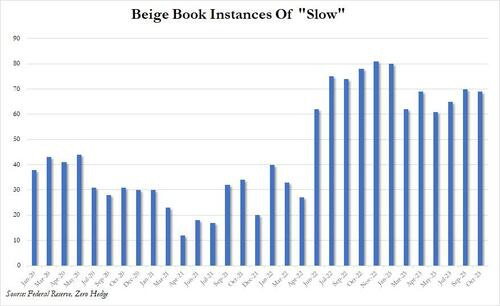
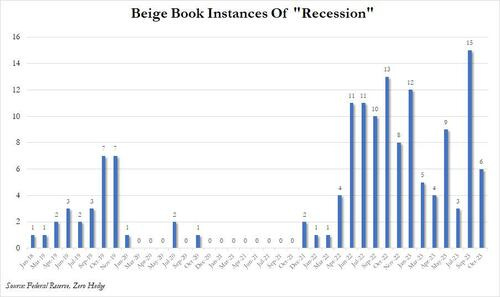
ZH: Beige Book Find "Little Change" As Outlook Turn Weaker But "Recession" Mentions Tumble
… Finally, taking a visual approach to the data, we find that the mentions of inflation were the fewest since Jan 2022...
... although the chart above correlates perfectly, if with a 3 month lag, to the price of oil. So expect a jump in inflation mentions next month when the Beige Book participants realize that crude is just shy of 2023 highs and the middle-east is blowing up.
And while mentions of "slow" persisted at a far higher rate...
... what we found most interesting is that one month after mentions of recession jumped to the highest level since at least 2018, in October recession mentions tumbled by more than half, sliding to just 6, or smack on the average line for the past years.
ZH- China, Foreign Central Banks Dumped US Treasuries Just As Yields Blew Out (TICS … while dated, it is still funTERtaining and while folks like to focus on China SELLING — always had a hard time getting excited here as they’ve been selling USTs since … 2009? In any case a good read AND heres RTRSif you wish)
Yesterday we said that one of the biggest market mysteries since the early summer, is who or what has been behind the relentless dump in Treasuries, and resulting surge in yields: some of the proposed reasons have included the "stronger than expected" US economy (i.e. Bidenomics), the market' long overdue realization that the US fiscal trajectory - the exploding debt and deficits - is unsustainable (i.e., Bideficitnomics), term premium, CTA selling, aggressive basis trades and so on. What was lost in this list of growing sophistication was the simplest reason of all: current holders selling Treasuries.
To be sure, some had suggested that as part of the world's response to the US weaponization of the dollar, none other than China (and/or other anti-Western nations) have followed Russia's example and sent the Biden admin a not so subtle message with relentless, coordinated selling of US paper.
And indeed, extending on what we noted yesterday, today's latest TIC data report from the US Treasury showed that , Chinese holdings of US Treasuries dropped again, sliding by another $16 billion to $805.4 billion, the lowest since 2009, and down a record 20 of the past 22 months!
Some will counter - not incorrectly - that China is using Belgium, i.e. Euroclear, as custodian for many of its TSY holdings, and is therefore masking the full scope of its reserve activity. Yet even when overlaying Belgium (assuming most of these holdings belong to China) we still see a relentless decline in Chinese Treasury holdings, if somewhat more gradual.
Finally and with that last hit from WolfST in mind, a few more sage words from none other than Jeff Gundlach of DoubleLine … something to listen too as we await whatever it is to come from HIMCO … Dated as it may be (from 10/3/2023
DoubleLine CEO Jeffrey Gundlach, speaking Oct. 3, 2024, at Grant’s Interest Rate Observer fall investment conference, shares (1:31) his views on why fixed income yields are headed much higher and the implications of the end of a 40-year decline in interest rates. The title of his presentation reprises the “Rates Can Never Rise” title of his Grant’s fall conference presentation on Oct. 4, 2016. With that title, Mr. Gundlach took issue with erroneous predictions at the time of frozen lows in U.S. Treasury yields and called for a rise in rates.
… Mr. Gundlach considers various outcomes on the future of the U.S. government interest expense in the event recession comes (14:32). These include average interest rates on the national debt of 3%, 6% and 9% and the size of the federal deficit, today running at 8% of GDP, a fact that flies in the face of Congressional Budget Office estimates projecting a deficit of 4% GDP and no recession. Varying the size of the deficit and the level of interest rates, Mr. Gundlach shows scenarios where interest expense could equal 40% to 140% of federal tax revenue. Such outcomes would mean massive money printing and much higher interest rates.
Turning to secular trends (19:57), Mr. Gundlach notes the 30-year Treasury yield “did nothing but fall since the 1990s, early ’90s, in a fairly controlled pattern. You’ll notice it was pretty well contained inside of these (standard-deviation) bands, but it’s pretty clear that something changed, and now we’re completely out of the context of the past.” He continues: “When you’ve been around for 40 years, you think you’ve learned stuff, right? You think that you understand relationships. You can tap into your experience and how things interrelate and act. But what if your experience is all informed by a secular trend that isn’t in place anymore? What happens if falling interest rates were significant in creating those relationships? And if they’re not falling anymore, maybe those relationships are irrelevant. Maybe they’re even misleading.” Among the consequences for an end to the era of falling interest rates, Mr. Gundlach foresees higher default rates and lower recovery rates on high yield bonds than were experienced over the prior history of that sector of the bond market.


"remain calm all is well" ahahaha. Sounds scary
Just wanted to post this.....
Will read your article, soon.
https://youtu.be/7RLfKaxH-Og?si=7JqTjdFtI2Q36Rdk
Grants 40th Anniversary: "Rates Can Never Rise" (Redux) 10-3-23
Jeffrey Gundlach, speaker