Good morning … IF the bond market is going to rally, putting PAID to dire economic (and therefore rate CUT) forecasts, the early trading is certainly respecting such narratives. Here’s a look at 30yy DAILY,
Momentum (slow stochastics, bottom panel) have crossed bullishly just a couple/few sessions ago and we’ve got ‘resistance’ just ahead at ~3.71% and with that in mind,
… The benchmark 10-year yield fell close to 14 basis points to 3.74%, marking the steepest drop on the first trading day of a new year since 2001. The yield had dropped as much as 15.5 basis points earlier in the session, before a cascade of new corporate bond sales briefly restrained the market. The move on the first day of 2001 was close to 20 basis points, with traders piling into Treasuries as recession fears fueled bets on a move by Greenspan, which did in fact come the next day…
… “The last two weeks of 2022 can be aptly characterized as a bearish phase in US rates” during a seasonally volatile period, Ian Lyngen, head of US rate strategy at BMO Capital Markets, wrote in a note. “As investors return from the long weekend we’re anticipating ‘cooler heads’ will prevail.”
About that German CPI inspired bid for bonds yest,
ZH: US Manufacturing PMI Weakest Since COVID-Lockdown Crisis Peak
Nevermind … French data out earlier …
RTRS: Surprise French inflation drop adds to signs Europe prices are cooling
… confirming slowing GLOBAL ‘flation profile and that’s good, right? Or wait, bad? I forget. Never mind … here is a snapshot OF USTs as of 705a:
… HEREis what another shop says be behind the price action overnight…
… WHILE YOU SLEPT Treasuries are higher with the belly outperforming as Treasuries try to keep up with -12bp rallies in UK and German 5's (downside misses in EU inflation) this morning. DXY is lower (-0.4%) while front WTI futures are lower again (-2.7%). Asian stocks were mixed (Hang Seng +3.2% but NKY -1.45%%), EU and UK share markets are all higher (SX5E +1.9%) while ES futures are showing +0.4% here at 7am. Our overnight US rates flows saw another quiet night of flow with our London desk reporting better buying overall. Overnight Treasury volume was about average overall with 10's (143% of ave) seeing the highest relative average turnover overnight among benchmarks.
… a zoomed-out look at 2s5s curve via the weekly chart showing the parabolic stair-dive taken by 2s5s since late 2021. Since late 2021, the 2s5s curve has taken these big plunges and then spent weeks correcting a small portion of that plunge... before stepping sharply flatter again. It now looks like 2s5s has taken another step flatter ahead of Friday's potentially consequential/important AHE reading..
… and for some MORE of the news you can use » IGMs Press Picks for today (4 JAN) to help weed thru the noise (some of which can be found over here at Finviz).
In as far as a few things on Global Wall Street’s mind (and sent around TO inboxes), this first one from UBS likely would have been better fit YESTERDAYgiven THISdisinflationary visual
German inflation was lower than expected, as expected. Profit-led price increases can adjust faster to demand shifts than wage-led price increases. French December consumer price data is due—the consensus is for a slight rise. The French government’s management of energy prices reduces the impact of energy disinflation.
The UK BRC shop price index showed a slight slowing. There was a more marked decline in non-food prices. UK durable goods prices have had the most rapid disinflation since 2010 as demand has weakened. BRC food prices were up strongly. It should be noted that agricultural prices in the UK have been falling in recent months…
Expecting that tomorrow he’ll tip the hat TO the French input noted above? Anyways, next up is one from Ed BOND VIGILANTE Yardeni noting,
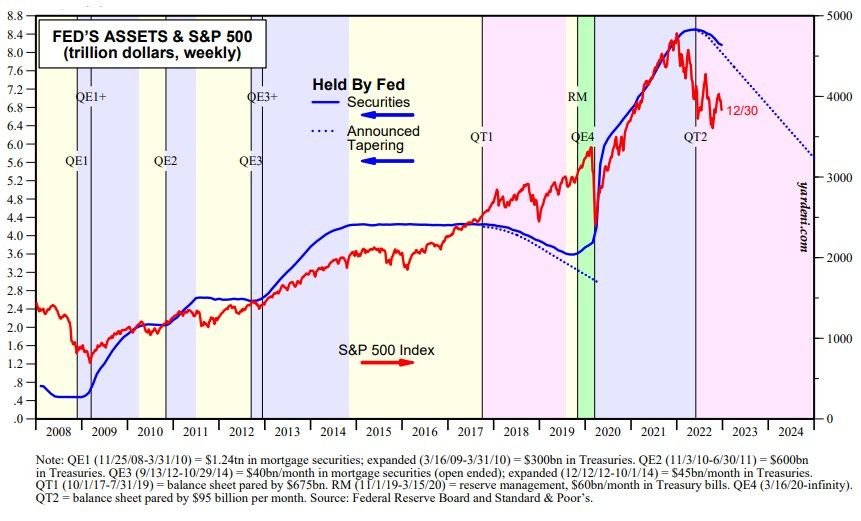
One of the bears’ favorite charts shows the relationship between the S&P 500 and the size of the Fed’s balance sheet. The former rose 609% from March 9, 2009 through January 3, 2022 (chart). Over this same period, the Fed’s assets rose 1,005% from $760 billion in March 2009 to $8.4 trillion in January 2022. That was all wildly bullish for stocks and bonds.
On January 5, 2022, the Fed released the minutesof its December 14-15, 2021 FOMC meeting. It included a long section titled “Discussion of Policy Normalization Considerations.” It signaled that the Fed soon would respond to rising inflation by reducing the size of its balance sheet.
The Fed’s quantitative tightening (QT) program began in June of last year and started accelerating in September. At the current runoff pace of $95 billion per month, the Fed’s asset holdings would drop by $2.8 trillion from a record high of $8.5 trillion during May 2022 to $5.7 trillion by the end of 2024…
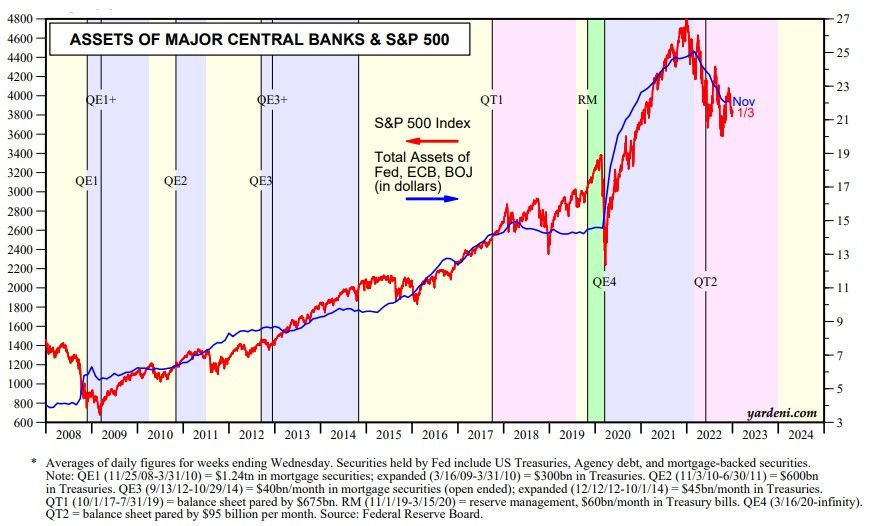
…The S&P 500 is also highly correlated with the sum of the assets of the Fed, the European Central Bank (ECB), and the Bank of Japan (BOJ) (chart). This series rose from about $3.3 trillion during mid-2008 to a record high of $25.1 trillion during February 2022 and was down 12% to $22.1 trillion in November of last year. The problem with this series is that it is in dollars, which exaggerates the decline of the assets held by the ECB in euros and BOJ in yen. Nevertheless, we acknowledge that the two series have been and remain highly correlated.
For somewhat MORE on the chart and perhaps a different take, DB offers
… In our view, the current downward sloping trajectory of risk assets is a result of the strong path dependence that reflects the inertia of unwind of accumulated QE positions which preceded rate hikes. During 2020-2021, risk assets enjoyed positive tailwinds of fiscal and monetary stimulus, rising more than 100% from their local lows. Stimulus was the main engine of growth; in the environment of low volatility, everything performed well, and everyone risked up. When the time came to reverse monetary policy in the face of high inflation, vol spiked triggering forced unwinds. The very inertia of those unwinds defined the subsequent S&P trajectory – both bonds and risk assets sold off. And while the S&P is down 20% from its Jan-2022 highs, it is still some 15% above the pre-COVID lows in early 2020.
Changing gears a bit from charts and QT to employment ahead of Friday’s jobs report. A rather large German institution (noted above) offering some economic perspectives,
… In In recent months, there has been a strong negative relationship between the employment shortfall/overshoot and employment momentum across sectors. Indeed, while three under-staffed sectors – leisure and hospitality, health services and local government – have combined to add nearly 200k jobs per month on average over the last three months, the over-staffed sectors – manufacturing, retail trade, professional and business services, and transportation and warehousing – have lost 25k jobs on average over the past three months. This bifurcation suggests that the extent of under-/ over-employment in sectors remains an important driver in employment trends in the near-term.
Looking ahead, it seems likely that those sectors that have employment levels well above pre-covid trends should continue to soften and shed jobs. This is particularly true for those sectors that are tied to the goods area of the economy, such as manufacturing, where demand growth is set to slow more materially as spending patterns normalize and eventually a recession comes into view. In addition, we would expect meaningful job losses in typical cyclical sectors, including construction, even if employment levels are currently somewhat below pre-covid trends. The extent of pent-up demand in leisure and hospitality is also up for debate, given a low average workweek and moderating wage growth.
Here’s one for your inner chartist (even the allstars and their followers), 1stBOS latest
Fixed Income Tactical Outlook
Chart of the Day: German 10yr Bond Yields continued moving higher during the holidays following persistently hawkish comments from ECB officials, reinforcing the message from the last ECB meeting. This left German 10yr Bond Yields testing their prior 2022 high and the 61.8% retracement of the downmove from 2007/08 at 2.56/57%, which is holding after yields reversed back lower over the past two days. This keeps our outlook for an approximate 2.00-2.50% range unchanged. Given that we are trading towards the top of this range, there is even a case to turn tactically bullish, although given our German underperformance bias, we prefer to just stay tactically bullish in the US.
US 10yr/Germany Bond Yield Spreads maintain the break of their 2022 low at 149/50bps and we stay biased in favor of a fall to the 2020 low at 103/00bps. We also maintain our recently updated objective for the US/Germany 2yr spread at 125/21bps.
US 10yr Bond Yields reversed back into their prior range over the holiday, however the break of the 55-day average has been quickly reversed and we therefore stay tactically bullish for now.
UK 10yr Bond Yields have rejected key support at 3.74%, where we suggested initiating a tactically bullish bias, with the market now at what we expect to be the top of a broad range.
You’ll note LEVELS they are watching which help define the pain trade … if long or tactically BULLISH 5yy, 10yy and 30yy (as they are), closes ABOVE 4.04%, 4% and 4.05% would turn them neutral.
Finally a few items from the intertubes which are NOT ZH … ok maybe they are
ZH: Michael Burry: “US Is In Recession, Fed Will Cut And Will Cause Another Inflation Spike”
Bloomberg’s Edward Harrison
It's still a high interest rates world for assets in 2023 Hopes are high for 2023 after a dour year for investors. We should temper those expectations somewhat given that the Fed still has concerns about a labor market that remains too hot. That means we will see little relief from interest rates this year, putting all financial assets on the backfoot — at least until a recession forces the Fed to change course.
…The bond market still faces headwinds With the softish landing forecast as backdrop let’s turn to asset markets. I’m an outlier on the bond market and expect that the 10-year yield could end the year around 5.25%. That’s because what you typically see before a recession is an inverted yield curve like we have today re-steepening so that 10-year bonds yield more than 3-month Treasury bills anchored near the base rate that the Fed sets.
After all, an upward-sloping curve is the norm. And after the curve’s inversion recession signal is met, eventually you return to that status quo— but usually before the recession starts. Since I think the Fed will get to 5.25% early in the year, that makes 5.25% my de facto target for long rates since I don’t see the Fed cutting rates before year end.
High rates are bad for equities as is a recession…
Getting back TO nearly where we started and the bears favorite chart, here’s another from BAML via Yahoo’s morning brief,
… But in a report out Monday, strategists at Bank of America Global Research note the firm's "sell-side indicator" suggests all of the above could make today an attractive moment to buy stocks.
The measure, which tracks strategists' recommended allocation to U.S. stocks, is the closest it's been to flashing a clear "buy" signal since late 2017.
"Wall Street is bearish. This is bullish," wrote Bank of America's team led by Savita Subramanian. "Wall Street's consensus equity allocation has been a reliable contrarian indicator over time. In other words, it has been a bullish signal when Wall Street strategists were extremely bearish, and vice versa."
According to BofA, at current levels its "sell-side indicator" suggests an expected price return for the S&P 500 of 16% over the 12 months. Historically, when the indicator was at current levels or below, stocks were higher a year later 95% of the time.
In closing … a final post from DB via ZH with 2022 recap,
ZH: "An Awful Year": The Best And Worst Performing Assets Of December, Q4 And 2022
… Which assets saw the biggest losses of 2022? … Sovereign Bonds: After a multi-decade bull run, 2022 was an incredibly bad year for sovereign bonds. For instance, Bloomberg’s index of US Treasuries (-12.5%) posted its worst annual performance since data begins in 1973, and the iBoxx series was also down -12.9%. Longer-term data showed that it was the worst year for 10yr Treasuries on a total return basis since 1788. Euro sovereign bonds saw even larger declines, with a -18.4% decline thanks to losses in every single quarter, whilst gilts fell -25.0% amidst the turmoil in the UK.


")