"Damar Hamlin suffered a cardiac arrest following a hit in the Buffalo Bills' game versus the Cincinnati Bengals. His heartbeat was restored on the field and he was transferred to the University of Cincinnati Medical Center for further testing and treatment. He is currently sedated and listed in critical condition."
The world was watching and now the world waits and HOPES for a speedy recovery by Hamlin …
That in mind and as hard to watch as it was and wait for another more comprehensive update, I’ll move on … And while some things have changed and the page on your calendars has flipped, some things have remained the same…Trends in place prior TO the new year have not magically paused, stopped and reversed simply because it’s 2023.
ZH: 'Worst Year Ever' For Stocks & Bonds - Global Inflation Fight Bursts 'Everything Bubble'
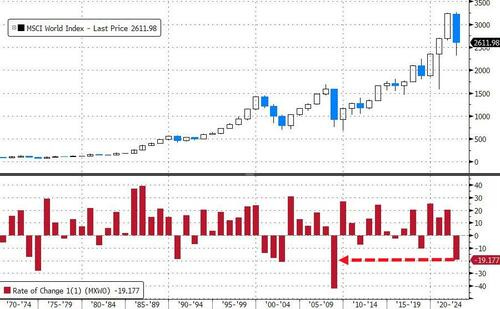
… On the year, global stocks suffered a 20% decline in 2022, the 2nd worst year since 1974, as central banks fought inflation in the face of supply chain shortages and an energy crisis due to the COVID-19 pandemic and Russia's invasion of Ukraine...
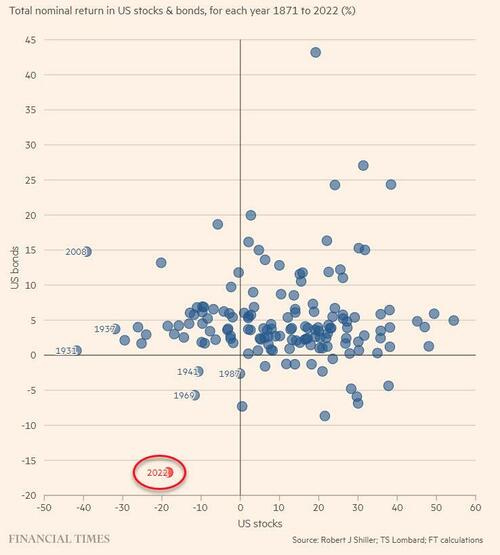
Worse still, as The FT reports, a traditional portfolio consisting of 60% US stocks and 40% US bonds will have seen its worst performance since 1932, when the U.S. was in the midst of the Great Depression.
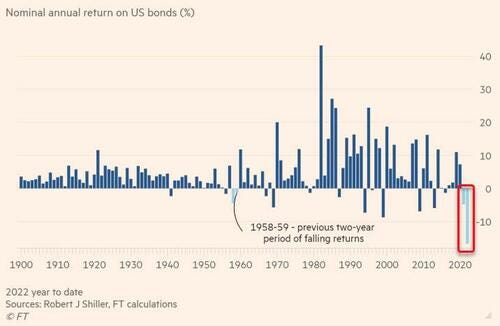
As US bond returns are suffering their worst stretch in over a century...
I’ll continue to browse through global macro as a tourist and offer whatever I can, her and there, as I begin my second year of life without a Terminal, once removed my front row seat in global fixed income markets.
I’ll continue to keep up this ‘site’ with much less stress (and information) than I used to. As always, I appreciate ALL the interactions, advice, suggestions and input and it is MORE important now more than ever …
It is with that in mind, and the more some things change, the more OTHERS — this small place on the intertubes — stay the same and so … here is a snapshot OF USTs as of 705a:
… HEREis what another shop says be behind the price action overnight…
… WHILE YOU SLEPT Treasuries are higher with the curve flattening out to the 7-year point while UST's outperforming EU and UK peer markets after a long weekend of weak Chinese data prints (see above). DXY is notably higher this morning (+1.15%) while front WTI futures are lower (-1.45%). Asian stocks were mixed, EU and UK share markets are all in the green (FTSE 100 +1.95%, DAX +1.3%) while ES futures are showing +0.4% here at 6:55am. Our overnight US rates flows were really light/non-existent with Japan closed for holiday though 10's were the star outperformer on curve (3s10s30s -5bp) to greet 2023. Overnight volumes were solid (off a low base) however with TY's at 240% of their 30-day ave and 10's at 165%.
… Our first attachment this morning looks at the daily chart of Treasury 10's and how they're starting 2023 notably and locally 'oversold' (see lower panel, circled) after their 2-week heave-ho at the end of 2022. In this chart you can also see a bear channel in place since last March where the bear trendline intersects somewhere near the closing low yield in 10's (3.417% area) last month. Taking out that low, and breaking the nearly year-long bear trend in the process, could be the signal that a sustainable, 2014-like rally may then be upon us. Meanwhile, our next attachment zooms out to look at the long-term, monthly chart of 10's that highlights, once again, the deeply 'oversold' momentum condition that persisted all last year and now into this new year. Simply, the long-term momentum set-up today is akin to that witnessed in late 2018 and early 2014 before sustainable rallies began then. Today won't make a trend... but we remain on point for signs of a sustainable bull turn in Treasuries where a rally and break in 10's below the 3.41% area in the coming weeks, if achieved, could be enough to signal bull trend sustainability. Absent that (jobs market stays tight, core inflation elevated, etc)... there may be more work to do near the 4.00% support area in 10's (2009's and 2010's twin rate peaks)?
… and for some MORE of the news you can use » IGMs Press Picks for today (3 Jan) to help weed thru the noise (some of which can be found over here at Finviz).
China Data: Surging Covid infections will likely drag down Q123 growth
… We expect the rebound to be broad-based but are cautious about its overall magnitude and persistence, especially in the household demand segment. External demand is also expected to experience downward pressure with advanced economies decelerating.
From China overnight TO a look back at global markets from DB where, today, they discuss assets with biggest losses in 2022,
… SovereignBonds: After a multi-decade bull run, 2022 was an incredibly bad year for sovereign bonds. For instance, Bloomberg’s index of US Treasuries (-12.5%) posted its worst annual performance since data begins in 1973, and the iBoxx series we normally use was also down -12.9%. Longer-term data we have showed that it was the worst year for 10yr Treasuries on a total return basis since 1788. Euro sovereign bonds saw even larger declines, with a -18.4% decline thanks to losses in every single quarter, whilst gilts fell -25.0% amidst the turmoil in the UK.
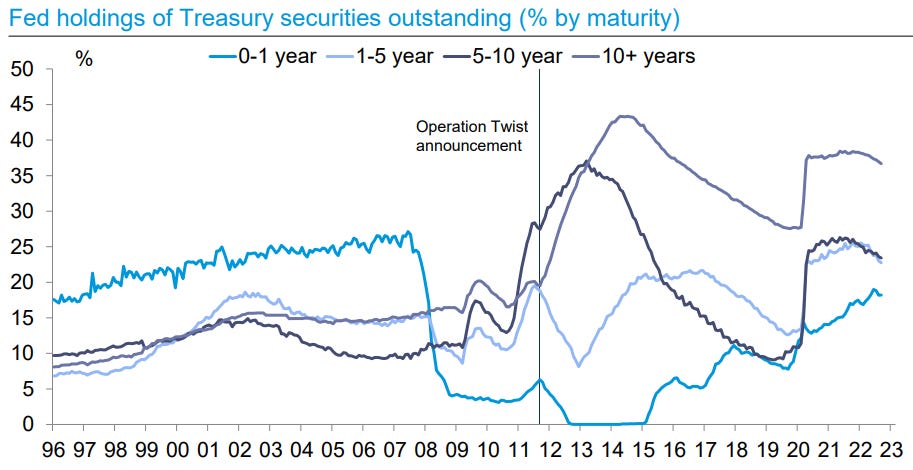
Yet another reminder of something we’re all trying to forget BUT lets not put this completely out of site / out of mind as such a large loss will impact portfolios and PEOPLE who own these assets for weeks, months and YEARS to come, as there are many percentage points of gains needed simply to get back to where they were this time last year. It’s math…In as far as WHO is buying USTs, Mortgages, Credit and Munis? I’m glad you asked (?) and grateful to have caught THAT SLIDE DECK dated December 2022 where you’ll find roughly 100 charts … including this reminder
The Fed owns the highest concentration of 10+ year Treasuries with 37% of outstanding
As PAINful as that may sound and seem, well … it’s something we’ll just DEAL WITH. In fact the idea of PAIN was topic of a 2023 outlook — Peter Tchir of Academy (via ZH)
… Not much help from the bond markets. I’m a bond bull and expect a “risk-off” trade early in the year, but bonds just aren’t going to help portfolios or the economy enough to stem the tide…
… Bond Market – Supply/Demand Imbalances?
I want to be bullish on bonds despite the fact that this is rapidly becoming a consensus view. I’m fully committed to the high probability of a “risk-off” trade that brings bond yields lower and takes stocks below their 2022 lows. Yet, things seem “off” in the bond world.
It is somewhat “difficult” (at least from this seat) to put a finger on exactly what is wrong, but let’s highlight a few potential risks to the bond world. These are primarily risks to the Treasury market, but many of those risks would cause problems for credit especially if the economy slows as rapidly as I expect it to (it is already slowing rapidly based on PMI data and other reports).
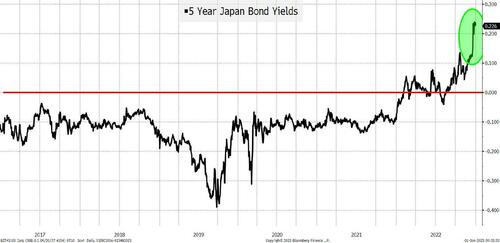
Will foreign buyers of dollar denominated debt continue to buy? This question first got some serious attention as dollar strength and FX volatility made it more difficult for foreigners to buy dollar denominated debt and hedge out the FX risk (primarily a Treasury and investment grade bond issue). With Japan starting to increase the target levels on their bonds, will we see more buying of yen denominated bonds vs. buying dollar denominated bonds with the associated FX hedging? I am a strong believer that the “0% bound” is non-linear. Basically, a number of market participants will do a lot to avoid 0 or near-0 returns and will quickly revert to “simpler” strategies once they can achieve even a modicum of yield. Large/sophisticated institutions don’t think that way, but many smaller institutions seem to.
Japanese investors (for the first time in well over 5 years) can achieve a little over 20 bps by investing in 5-year JGBs. Certainly not an earth-shattering return, but it isn’t a particularly long maturity and it alleviates the need to run FX hedging strategies. This will be a small problem for bond markets, not material, but not entirely inconsequential. It is a risk that increases as Japanese yields rise (presumably while global bond yields are also rising) creating a negative feedback loop. This isn’t keeping me awake at night, but I am keeping an eye on it…
AND couple things / links of interest from intertubes,
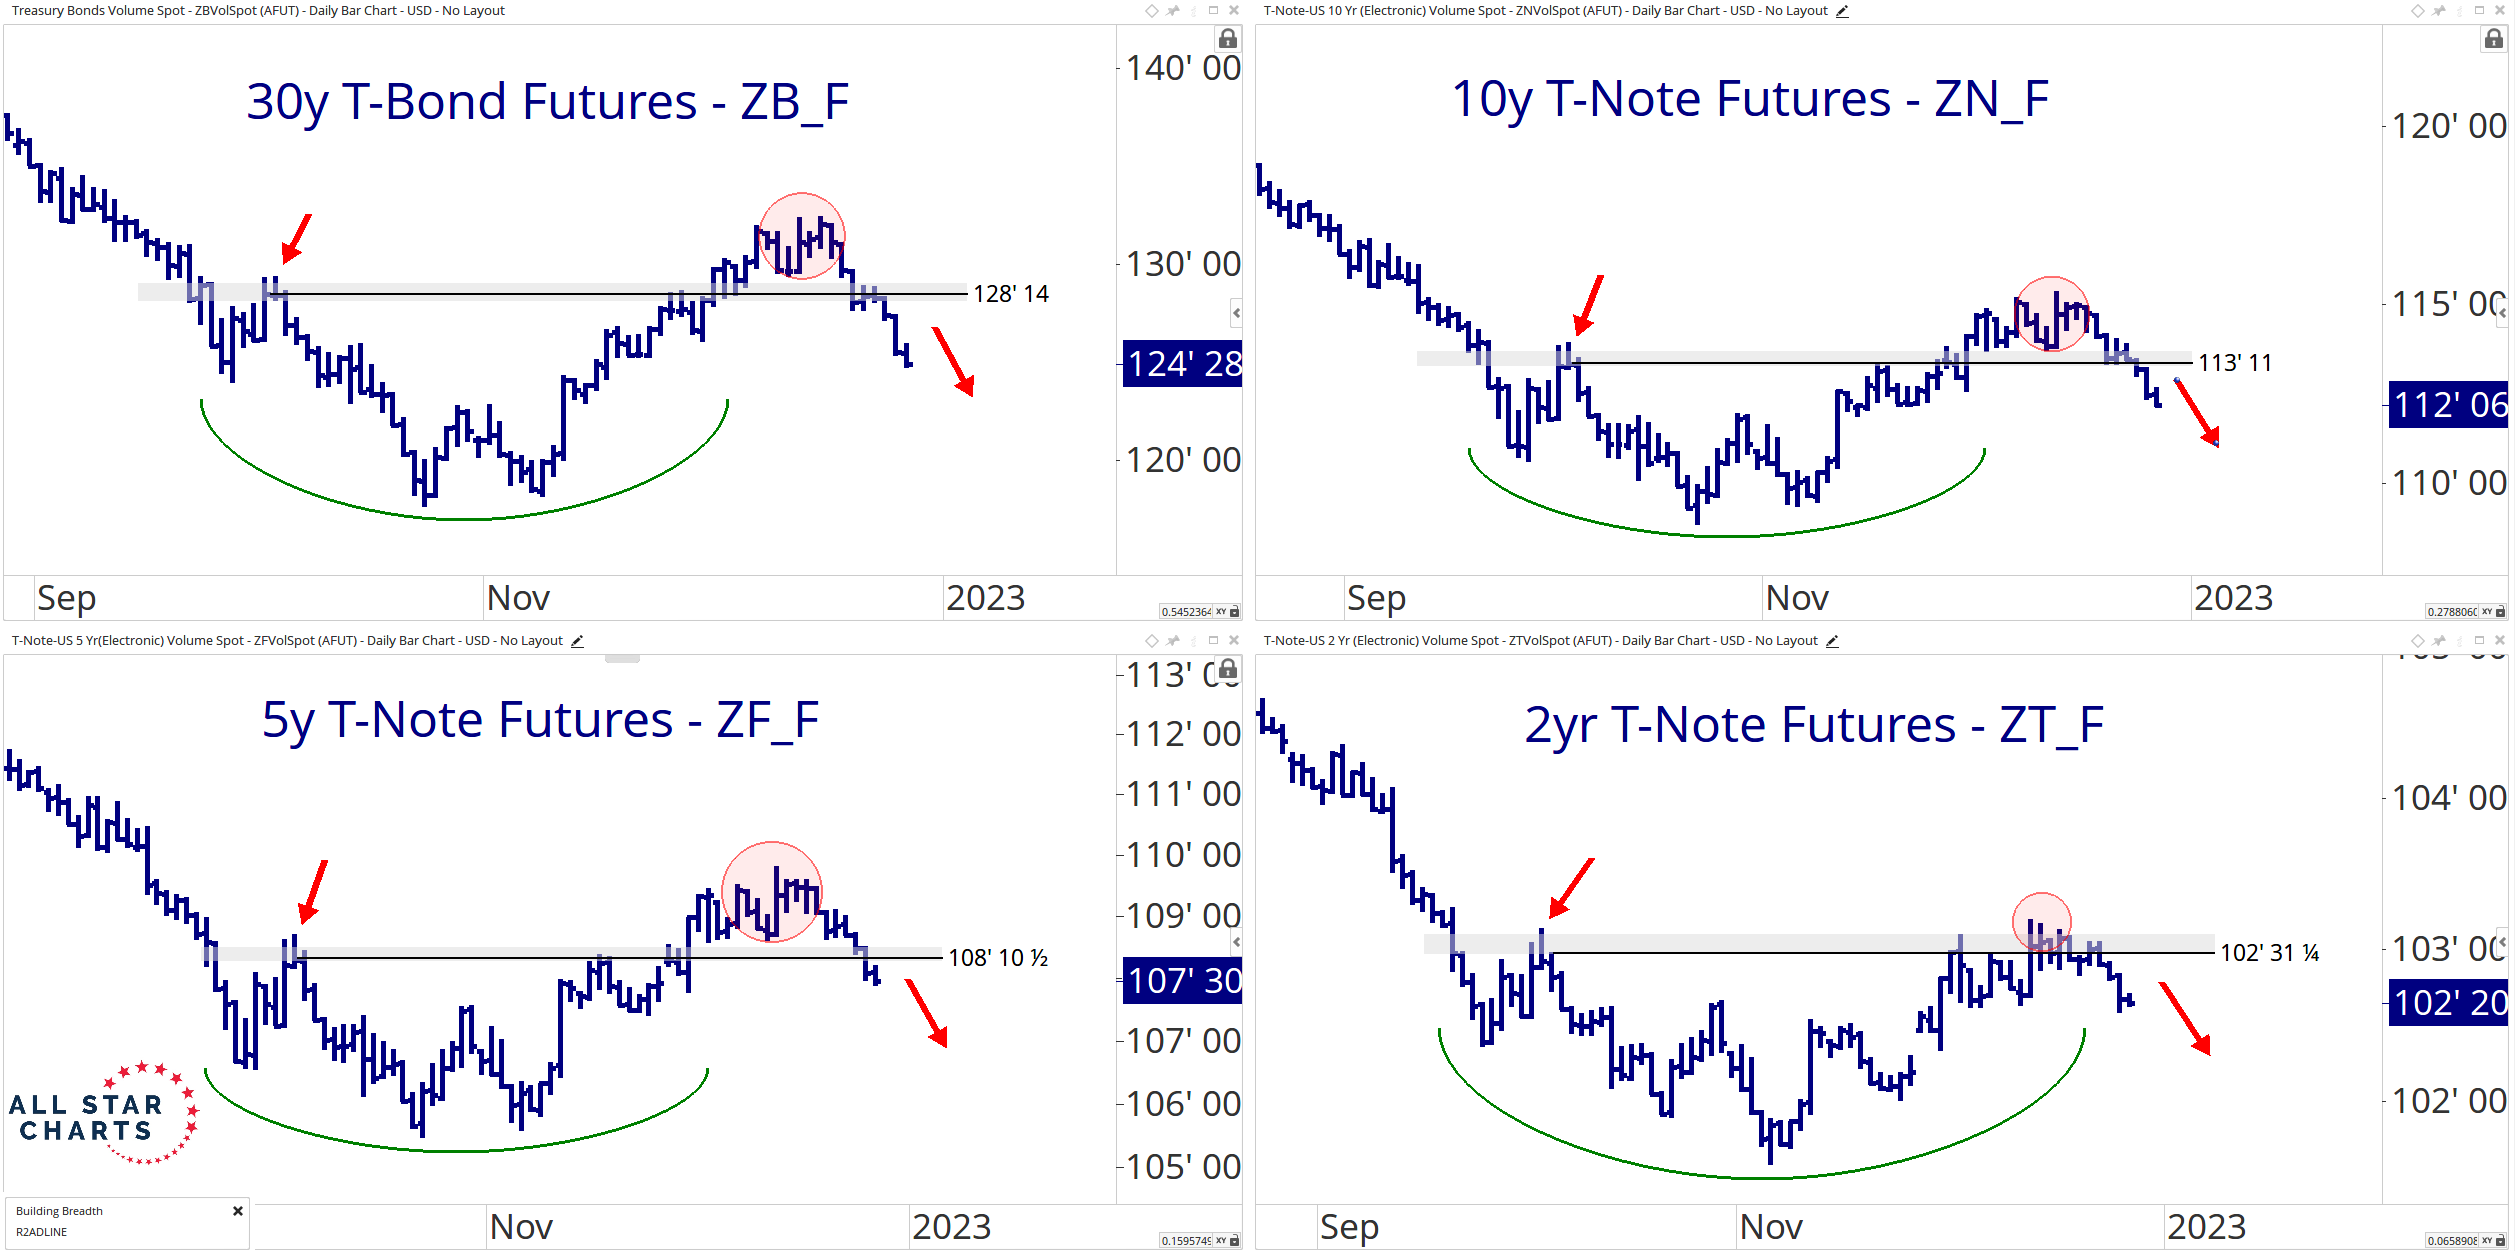
… The chart below highlights the five-, 10-, and 30-year US Treasury yields finding support at their respective year-to-date trendlines and pivot highs from the spring.
Not All Good Trades Are Profitable
This might sound crazy to the uninitiated, but I’d rather lose money on a good trade than make money on a poorly executed one.
Poor trades lead to bad habits and large losses – been there, done that.
On the flip side, taking a signal within your plan and managing risk are critical ingredients to any successful trading approach.
but … but … these are the allstars and they are reminding us that,
… taking losses is never fun. But making money is our first priority, not having fun. Sure, fun comes in second, but it’s not even close …
… It’s well-executed losses – such as the recent breakouts in bonds – that build character and longevity.
The hit goes on to detail bonds (TLT) and TECH (ARKK etf) correlation as well as the upcoming FOMC. Check it out and place your allstar bets!
Hedgopia: Even As S&P 500 Dividend Yield Falls Way Behind 10-Year T-Yield, Companies Likely To Resort To Buyback Reduction In Quarters Ahead
… At the end of 2022, the S&P 500 dividend yield was 1.74 percent, even as 10-year treasury notes were yielding 3.88 percent. This was eight quarters in a row in which the spread between the two was in negative territory (Chart 5). Buybacks have been compensating for this to attract investors, but even here managements will probably try to reduce buybacks this year given the earnings dynamics that lie ahead.
From WingOMetrics and SurplusProductivity.Com (via LinkedIN) is a look at Trimmed Mean CPI from 16% down to 2.99309668209826
Interesting as it then would / SHOULD help us all, collectively, POSITION FOR RATES … LPL
… But most investors don’t want to know where the 10-year Treasury yield has been, as interesting as it might be, but where it’s going. To get our bearings, we looked at a range of historical increases in the 10-year yield over a year and what it’s done in the following year. At a 0.5 percentage point (0.5%) move or higher in the last year, there has not been a clear historical bias toward higher or lower in the next year, but as the prior year move goes up from there, it became increasingly likely the 10-year yield would decrease in the next year, as did the average size of the decrease.
Finally, a longer-term TREND which may very well have been broken in 2022 AND which captures MY heart and mind … BLOOMBERG,
This year has seen the worst bond rout in at least a generation, but investors are more than ready to close the door on that episode and look forward to more normal programming in 2023. The decades-long bull run for Treasuries has been broken, but with the Federal Reserve’s rapid interest-rate hikes expected to cause a recession, the narrative has been building that the peak is in for yields.
That may well be the case, and it would be a riskier case than widely believed. That downtrend in yields has been decisively broken, signaling that a lot needs to go right for bonds before investors can breathe easy. Inflation has to come down a long way to satisfy the Fed, which is also expected to keep trimming its balance sheet. Add in the potential for fresh supply-chain disruptions from the war in Ukraine and expected outflows from Japanese investors as they take money home to higher interest rates there, and it is going to be no easy task to snap the current uptrend for yields.
With all THAT in mind, here’s a snapshot from the best in the strategy biz » a LINKthru TO this economic calendar of events for the week just ahead to help as you plan your trades and trade your plans,
Note to anyone contemplating 'quiet quitting' or 'lying down.' There is only one acceptable way to do this on the job. Please watch video for instructions: https://www.youtube.com/watch?v=r1Z9Vd53yhI


Thank you!
Note to anyone contemplating 'quiet quitting' or 'lying down.' There is only one acceptable way to do this on the job. Please watch video for instructions: https://www.youtube.com/watch?v=r1Z9Vd53yhI