More on this hike so you’ve got room to cut mantra in a moment.
Yields are apparently triangulatingat same time they were marginally overbought … I’m not taking much SIGNAL from the summer-time noise especially not on a Monday ahead of the Fed (Wednesday) and Q2 GDP Thursday.
The selloff could very well be a CONCESSION for supply of 2s (today), 5s (tomorrow) and 7yy (who get the benefit of the Fed being hindsight, Thursday)
Stepping back and noting that fixed income is on the backfoot ahead of another hike (one which COULD surprise to the upside as 100bps was a non-zero probability), makes some amount of common sense. Thinking then, at the very same time, about CUTS (priced, see WSJ) at the very same time, well, makes lot less sense.
Markets are, as always, attempting to skate to where the puck is gonna be, right?
… here is a snapshot OF USTs as of 705a:
… HEREis what another shop says be behind the price action, you know,
WHILE YOU SLEPT Treasury yields are lower and the curve steeper ahead of supply, the FOMC decision and ahead of some late week tier#1 economic data. DXY is lower (-0.25%) while front WTI futures are modestly higher (+0.9%). Asian stocks were lower, EU and UK share markets are modestly higher while ES futures are showing +0.5% here at 6:50am. Our overnight US rates flows saw a quiet Asian session with 2-way flows noted in the back-end (fast$ selling later offset by real$ buying). In London's AM hours our desk saw suppressed volumes with fast$ fading the bear steepening (5s30s and 10s30s) with Asian real$ also selling 20yrs outright. Overnight Treasury volume was about average overall with 30yrs (189%) seeing the highest relative average turnover overnight.
… As for duration, our first attachment offers and updated look at how the 5y5y (OIS) rate is so far respecting range resistance near 2.46% with short-term momentum (lower panel ) inching toward 'overbought' levels. This resistance is similarly derived as the ~2.71% resistance levels we've highlighted for both Tsy 5's and 10's. Indeed, our next attachment of Tsy 10yrs shows the apparent 'barrier of supply' near 2.71% in 10's that we've chatted about of late. Some might even say that the overall yield pattern in 10's since mid-April is one giant Head and Shoulders top. Either way, key range resistance remains near 2.71% in cash 10's and at ~2.46% in 5y5y rate.
… and for some MORE of the news you can use » IGMs Press Picks for today (25 July) to help weed thru the noise (some of which can be found over here at Finviz).
We expect the FOMC to stay focused on pushing rates to a restrictive position as quickly as possible, to help curb inflation
Monetary tightening into slowing growth remains the dominant global macro theme. Last week the ECB hiked by 50bp and we expect the Fed to hike by 75bp this week (see below). China's outlook is mixed, while PMIs slipped into contraction territory in Europe and the US. We cut our US GDP forecasts after bad news on housing, manufacturing and layoffs …
We have revised our economic outlook to include significantly higher inflation and weaker growth. A sustained rise in the unemployment rate begins in 4Q22. After reaching a peak rate of 3.625% in Dec. 2022, we see the Fed taking the first step toward normalizing the federal funds rate by end-2023.
… The pace of the balance sheet unwind will accelerate in September to the full caps of $60bn per month of Treasuries and $35bn per month of MBS. We expect QT to run in the background, and at this early stage continue expect the balance sheet to run off as planned toward an eventual $6.5tr SOMA portfolio. Following considerable debate later this year, we do not expect the Fed to sell MBS from its portfolio.
It would seem that the firms resident bear (stock jockey Mike Wilson) has finally gotten the attention of his colleagues. Checking in with Mr. Wilson then for his latest weekly missive where he asks,
Is the Market Trying to Price a Fed Pause? With equity markets seemingly shrugging off bad news on the economy and earnings, we explore the idea that it may be trying to get ahead of the eventual pause by the Fed that is always a bullish signal. The problem this time is that the pause is likely to come too late.
… Bonds have rallied sharply lately presumably due to the ongoing growth slowdown. Meanwhile, the stock market has traded well in the face of weaker economic and earnings data. Is this simply the bond market catching up to the equity market's view on growth, or is the equity market starting to contemplate a Fed pause in its usual attempt to kick save the cycle? We think it's more of the former but believe the equity market may try to dream a bit longer …
… So why would equity markets be thinking the Fed is about to pause or slow rate hikes or even QT? Part of the reason is the fact that they are having their desired effect on demand (see above) and so it seems quite plausible inflation could look considerably lower in 6 months time. Second, the bond market is sending similar signals with rate cuts now getting priced as early as the Fed's early February 2023 meeting and the terminal rate and 2 year yields starting to fall. This is very much in line with our own thinking and why we have been bullish on long duration Treasuries over the past several months which is supportive of our defensive sector preference. Of course, lower back end rates (both nominal and real) can also be interpreted as good for longer duration growth stocks, particularly relative to value/cyclicals. This helps explain not only the rally in the S&P 500 but also the relative outperformance of the Nasdaq and other growth indices relative to value stocks.
Exhibit 8: 2 Year Yields No Longer Rising
He ALSO provides a visual of FedFunds (Which Ellen doesn’t — makes ME wonder if she’s possibly embarrased at thought of having to utter words / thoughts of a rate CUT before this weeks rate HIKE),
… In looking at past cycles, there is always a period between the Fed's last hike and the eventual recession--i.e. the Fed is typically long done raising rates before the recession arrives. This is in sharp contrast to the European Central Bank which was still tightening when the last two recessions began. More importantly, this period between the last Fed hike and the eventual recession has been a good time to be long the S&P 500 and many stocks/sectors (Exhibit 7). In short, the Equity market always rallies when the Fed pauses it's tightening campaign prior to the oncoming recession. In some cases, it's significant and the S&P 500 usually makes a new all time high. The point here is that IF the market is starting to think the Fed is about to pause rate hikes after next week's move, this would provide the best fundamental rationale for why equity markets have rallied so sharply over the past few weeks and why it might signal a more durable low.
Exhibit 7: Fed Pause Before a Recession is Bullish for Stocks. This time likely to be different
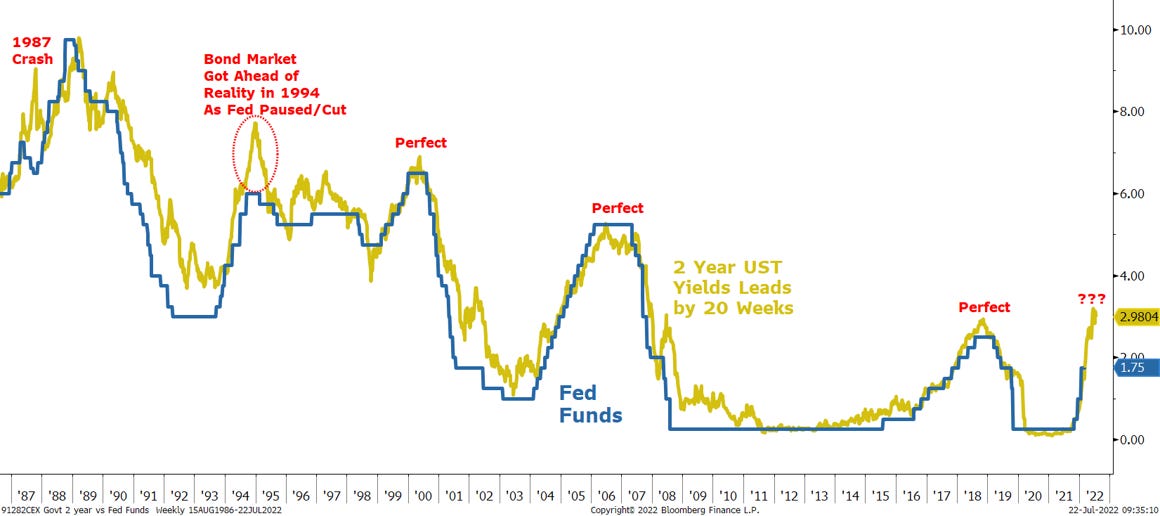
Finally, all I’m gonna say is that this one — an oldy but a goody — another iteration of how / why we shoulda known


