while WE slept: USTs unch(holding on to gains); bad data was actually bad (for stocks) and bonds still NOT dead yet. again...#Got2s? Stocks rooting for Seahawks (NFC) and I don't care...do you?
Yesterday I mentioned how I was still watching triangulating support (long bonds, specfically, vs 4.93).
This is NOT any sort of victory lap or ‘I told ya so’. It isn’t and I didn’t. This is just an uninformed view from a random guy without a seat at the show. No Bloomberg terminal, only a free TradingView account and an internet connection.
I KNOW there was some weak jobs data (stocks maybe missed the memo as it increases chances of a cut, right?) and I am now certain this weak data had something to do with the continued tech wreck and F2Q bid for bonds…
ZH: Initial Jobless Claims Jump As YTD Job Cuts Hit Highest Since 2009, AI Blamed
ZH: Job Openings Crater Most Since 2023 To Lowest In 5 Years As Payrolls Set For Negative Print
… there was also some more negative news after the bell …
ZH: Amazon Plunges After Forecasting 50% Surge In Capex To $200BN
…Well, we were wrong: the earnings were not good enough: the company missed on earnings and its guidance was rather week. And so before we even get to the biggest shock of the report - the company’s CapEx guidance - here is what the company reported for Q4:
EPS $1.95, missing estimates of $1.96... an ugly miss at the very top…
… and the fact of the matter IS price action tells you what you need to know and when you need to look for supportive funDUHmentals.
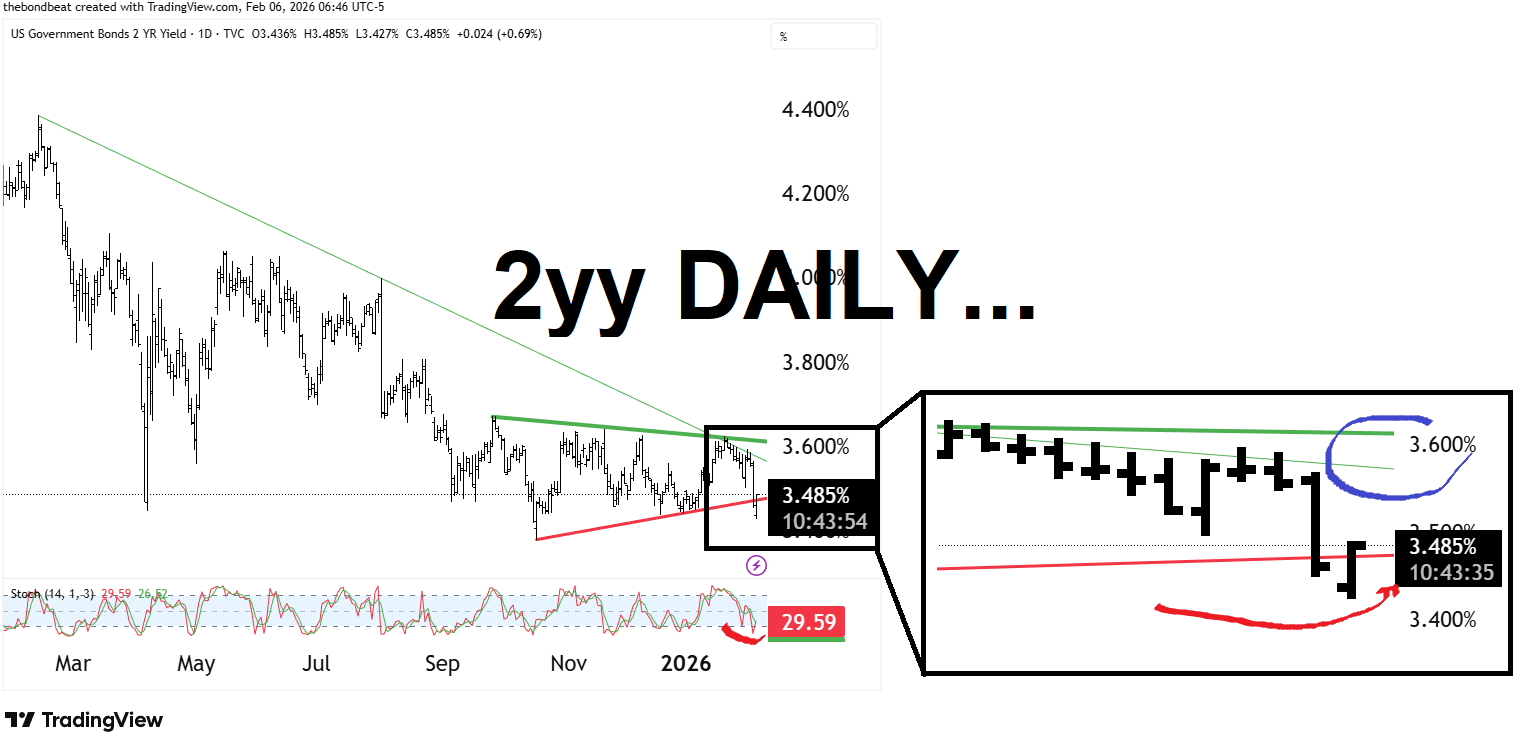
The DOWNTREND in yields remains in place. Shorter-term support HELD and in some cases — 2s — resistance is now being tested …
2yy DAILY: 3.615 to 3.47 — triangulated levels to watch (todays close) …
… this, as momentum (stochastics, bottom panel) overBOUGHT and appears to be correcting (favoring higher yields) and so, lets not rule out dipORtunity — a test of support (again) …
#Got2s? Perhaps a dipORtunity just ahead … watching …
The idea, here, though, is that the news seems to FOLLOW the price action. I draw MY TLINES and you draw yers.
Trends yer friend until it ends.
I’ll leave these TLINES up as a guide and shape-shift them as necessary. Likely to redraw some over the weekend as I contextualize things in different timeframe (ie weekly).
More later. Have a good start to the day and end of the week …
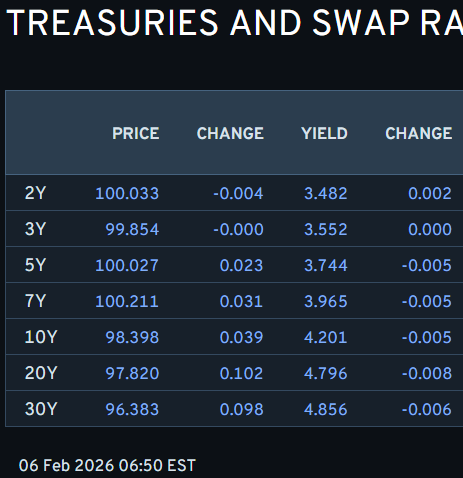
Onwards and upwards TO the reason many / most of you are likely here … whatever it may be on Global Wall’s mind but first … here is a snapshot OF USTs as of 650a:
… for somewhat MORE of the news you might be able to use … a few curated links for your dining and dancing pleasure …
NEWSQUAWK US Market Open: US equity futures entirely in the green, despite AMZN -7.7% pre-market; Informal US-Iran talks are underway … USTs hold onto recent gains, Bunds digest ECB speak whilst Gilts take a breather …USTs are firmer by a handful of ticks, remaining at the elevated levels seen in the prior session. As a reminder, the strength seen on Thursday was attributed to: a) risk-off sentiment, b) poor US jobs data, c) a dovish hold at the BoE. Newsflow is lacking this morning, aside from the recommencement of US-Iran talks in Oman – the key risk is that talks break down, leading to a potential US strike on Iran. Geopols aside, focus will be on the US data slate, which includes the UoM survey. Currently within a 112-06+ to 112-16+ range.
Finviz (for everything else I might have overlooked …)
Moving from some of the news to some of THE VIEWS of Global Wall you might be able to use …
Labor markets cooperating with rate cut plans and normally stocks would like that. Oh well … can’t ask for much more than weak data and downside risks …
Job openings in December moved down notably for the third consecutive month, to 6.5mn, indicating downside risks to labor demand conditions. This came alongside continued low labor market turnover, with hiring and separation rates at 3.3%, within the past year's range.
DATA showing labor mkt cracks and mkts respond … Also some end of day commentary …
BMO Jobless Claims 231k, Revelio -13.3k, TSY Rally BMO JOLTS Unexpectedly Drops to Lowest Since 2020; UST Rally Extends
…The tone-shift in US rates was alas a function of the fundamentals. Specifically, the curve bull-steepened following a combination of Challenger Job Cuts +117.8% (highest for a January since 2009), Initial Jobless Claims at 231k (highest since December), Revelio non-farm payrolls printing at -13.3k in January (lowest on record – data back to Jan. ‘21), and a sharp decline in JOLTS job openings (lowest since September 2020). These weaker employment proxies came in the wake of Wednesday’s disappointing ADP print of +22k versus the +45k consensus. It followed intuitively that yields dropped with the front-end of the market leading the move as duration underperformed. The 2s/10s curve pushed back above 73 bp to flirt with the steepest levels since 2022. In outright terms, while 10-year rates declined, the move simply represented a move back slightly below the 200-day moving-average of 4.23%. The price action was range confirming for the long end of the curve, which was a welcome development as next week’s refunding auctions are now on the radar…
…With 10-year rates back at the bottom of the 2-week range, we’re left to consider whether the market is due for a repricing to a lower yield plateau? To be sure, next week’s NFP/CPI combo will be a crucial determinant in this regard. As it currently stands, our tactical trading approach to the BLS employment report is to fade a bid in 10-year notes if: 1) NFP prints below 70k, but remains positive, and 2) UNR unexpectedly increases from 4.4% – but remains below 4.6%. We don’t think that a disappointment that conforms to these parameters would be sufficient to derail the Fed’s view that the labor market is stabilizing. Moreover, the 10-year refunding auction is 4.5 hours after the release of NFP – a setup that points to the need for a supply concession. Also, we’re looking for a CPI report on Friday that reinforces the prudence of a cautious approach to further rate cuts. Core-CPI is seen coming in at +0.3%, but the risks are skewed toward an upside surprise. Note that a +0.4% print would be the largest monthly gain in a year.
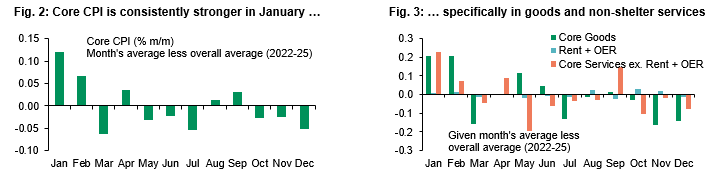
We expect positive residual seasonality to again assert itself in the US January CPI report, pushing core CPI to a firm 0.3% m/m print.
We see risks as broadly balanced, but a downside surprise may have more impact given expectations for positive residual seasonality and rising questions around tariff pass-through after uneven goods inflation data over Q4 2025.
We maintain an above-consensus, sticky glide path for core inflation this year, with firm goods prices and resilient non-shelter services inflation offsetting gradual cooling in shelter.
…Interestingly, that pattern echoes what we saw in 2000 as the dot-com bubble started to burst. Equities started to fall from the March 2000 as tech stocks saw significant declines. However, consumer staples, utilities and healthcare rallied significantly over the months ahead, and in September the S&P 500 actually came within a percentage point of its record high from six months earlier. So it shows that a market can absorb a prolonged rotation without obvious index-level stress for some time. But the longer and deeper the sell-off in a dominant sector becomes, the harder it is for the broader index to withstand the drag, and the continued losses for tech in 2000 ultimately meant the S&P 500 ended that year over -10% lower.
This latest sell-off has shown no sign of easing yet, and it got further momentum as Amazon reported after the close last night. Its net sales guidance was largely in line with expectations but this was accompanied by a sharp rise in planned capex spending, which is expected to reach $200bn this year, well above expectations. That spending also weighed on the operating income guidance ($16.5-21.5bn in the current quarter vs $22.2bn estimated) and pushed Amazon’s shares down by more than -10% in after-hours trading…
…The sell-off really wasn’t helped by the latest batch of US data, which helped to feed the more negative market narrative. Indeed, a crucial factor driving the market’s resilience this year despite various shocks has been the consistent data resilience. So any signs the data is softening would take away a key support that’s held things up amidst the volatility elsewhere. In terms of yesterday’s releases, the weekly initial jobless claims spiked up to an 8-week high of 231k in the week ending Jan 31 (vs. 212k expected). Then 90 minutes later, the JOLTS report showed that US job openings fell to just 6.542m in December (vs. 7.25m expected), which is their lowest level since 2020, coming in below every economist’s estimate on Bloomberg.
Those signs of labour market weakness meant investors priced in more Fed rate cuts this year, as the data was seen as offering them more space to ease policy. For instance, the amount of cuts priced by the December meeting was up +10.0bps on the day to 60bps. And in turn, that helped to push Treasury yields lower across the curve, with the 2yr yield (-10.3bps) seeing its biggest decline since August to 3.45%, whilst the 10yr yield (-9.5bps) fell to 4.18%.
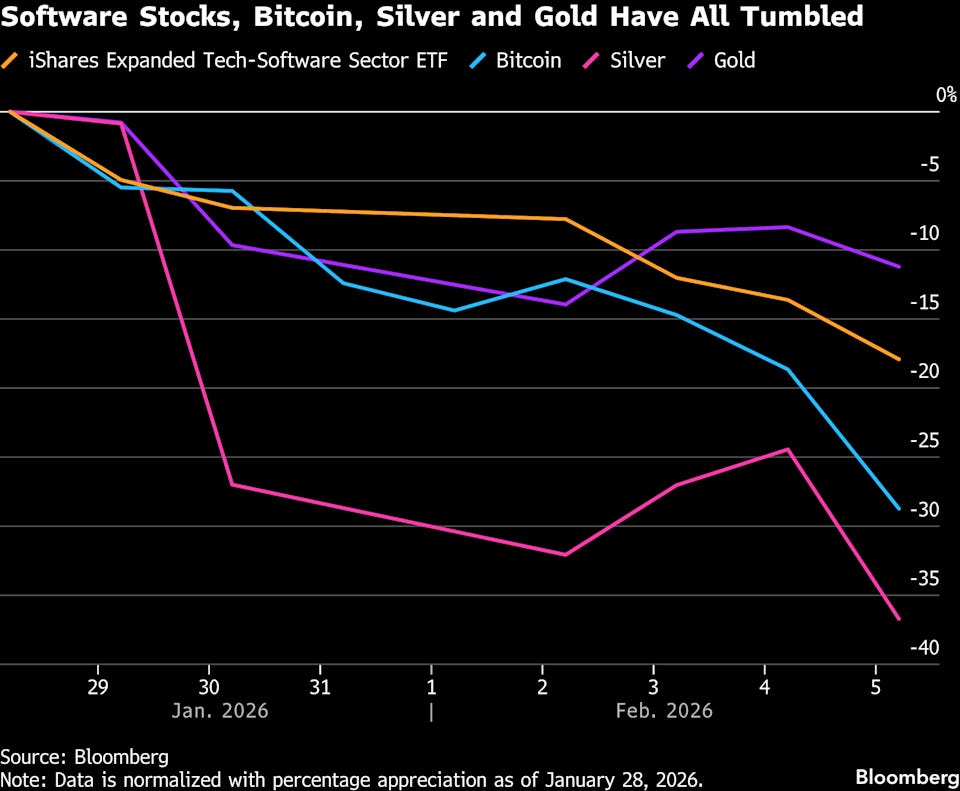
That bond rally got further support from the latest decline in commodity prices, which eased concerns about inflation. So Brent crude oil fell -2.75% to $67.55/bbl amidst the weaker data as well as news that US-Iran negotiations are set to go ahead in Oman today. And there was a fresh rout in precious metals, with gold prices (-3.74%) down to $4,779/oz, while silver (-19.57%) saw its second-sharpest decline on record to $70.92/oz. Following on the -26% fall last Friday, that left silver down -1% YTD, having been up +62% as of Wednesday last week, although it’s bounced back a bit overnight to move back into positive territory for the year, at $73.41/oz..
Classic risk OFF F2Q bid for bonds thanks largely TO … weak jobs data …
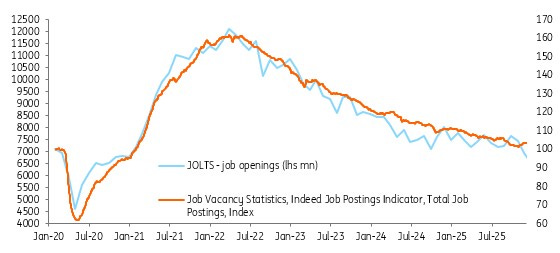
5 February 2026 ING US hiring slowdown points to weaker jobs numbers
An apparent slowdown in hiring suggests the Fed may have acted a little prematurely in downplaying the risks to the jobs aspect of its mandate at the January FOMC meeting. Major downward revisions to payrolls next week would add to the pressure to eventually resume rate cuts
…Job openings versus Indeed job postings data
5 February 2026 ING Rates Spark: US Treasuries turn tail and dive for safety
We had some dodgy US labour market data early on, but the turn of the knife came from the risk-off tone. Day two of these things is typically pivotal. We also update on the ECB and BoE – even though no changes, lots going on
A bit about the footprint of The Fed in a global markets context …
The nomination of Kevin Warsh as Chair of the Federal Reserve has brought renewed focus on the Fed’s presence in financial markets.
Key takeaways
Shrinking the balance sheet is possible, but requires reducing bank demand for reserves. Otherwise reserve drainage will disrupt funding markets.
Returning to an all-Treasury portfolio remains a slow process. Asset sales are highly unlikely.
Altering the Fed’s footprint requires coordination with Treasury. A smaller TGA would reduce Fed assets and bill issuance is important for reducing SOMA WAM.
QE has a higher bar, likely only when rates fall to the effective lower bound. Bill purchases to manage reserve liquidity may only be used sparingly.
Less Fed communication could increase market volatility, lead to higher term premiums, and mean greater reliance on data rather than FOMC signals.
Exhibit 1: The Treasury General Account has ballooned after the financial crisis and COVID. Cutting the TGA in half would allow the Fed to reduce its securities holdings by $500bn without altering reserve balances
This FAQ summarizes our thoughts on the key mechanisms, constraints, and implications of a smaller Fed footprint. Shrinking the Fed’s footprint is possible, but doing so is complex and includes meaningful trade‑offs. Any adjustment would likely occur gradually.
Key expectations
There are only two tools to reduce the size of the balance sheet: passive vs. active QT. Passive QT relies on securities maturing within caps set by the Fed to enable smooth, predictable balance‑sheet runoff, while active QT allows the Fed to sell chosen securities directly but risks greater volatility and higher realized losses.
Be careful what you ask for: balance‑sheet reduction drains liquidity. Shrinking assets lowers Fed liabilities—mainly ON RRP and reserve balances—tightening financial conditions and increasing volatility once reserves move from “ample” to “scarce.”
MBS runoff is slow without rate declines. Elevated mortgage rates have sharply limited prepayment speeds, meaning the Fed’s MBS portfolio would take years to run off naturally; faster reduction would require much lower mortgage rates or disruptive active sales.
Regulation shapes reserve demand. To meaningfully shrink the balance sheet, banks’ demand for reserves must fall—potentially requiring changes to liquidity regulations such as LCR, ILST, or what qualifies as Level 1 HQLA. Lower liquidity buffers could increase financial stability risks.
Treasury coordination matters. Adjustments to TGA targets or issuance mix (especially bill issuance) affect how balance‑sheet reduction flows through the system and influence the maturity structure of the Fed’s SOMA portfolio.
Everyone’s got a right to a VIEW and here’s what one person says ‘really matters’ …
06 Feb 2026 UBS: What really matters in volatile times
The volatility of some financial markets produces stirring financial media headlines. However, most major equity markets (other than the US) are up on the year. Precious metal volatility (up and down) has been too abrupt to generate major wealth effects. Crypto is not an asset, and is held by a tiny portion of society. It is unlikely that consumer behavior will change because of recent market moves.
US employment is important to consumer behavior; this week’s US government shutdown means we do not get the US employment report until next week. Overall, consumer behavior revealed credit card use, etc., and does not suggest strong concerns about the labor market, but a reluctance to hire is still being hinted at…
Said another way …
Supply and demand — for labor — remains outta balance and that would support rate cuts …
February 5, 2026 Wells Fargo: December JOLTS: Slide in Openings Signals Labor Demand Remains Weak
Summary The December JOLTS report underscored the labor market remains in a precarious position. Job openings fell to 6.5 million and are down around 10% over the past year. The ongoing slide suggests a turnaround in hiring conditions is not yet upon us. Turnover data also suggest labor market activity remains subdued. The hiring and quit rates remained near their lowest levels in roughly a decade in December, excluding the initial months of the pandemic.
The low hiring environment and subdued rate of workers voluntarily leaving their jobs risks pushing layoffs higher. The layoff rate remained at 1.1% in December, but more forward-looking data from Challenger show job cut announcements trending higher. While announcements have not risen to a degree that signal a mass loss in employment, the pickup is a reminder that firms are not opposed to cutting headcount when other options have been exhausted.
… Moving along TO a few other curated links from the intertubes. I HOPE you’ll find them as funTERtaining (dare I say useful) as I do … …
First up, the good Doctor SLOK says … FLATION not ONLY / all ‘bout housing …
February 6, 2026 Apollo: Inflation Outlook: It Is Not All About Housing
US GDP growth is accelerating because of the One Big Beautiful Bill, the AI boom and the ongoing industrial renaissance. As a result, inflation pressures are building, driven by higher wages, higher commodity prices and a weaker dollar, see charts below.
US GDP growth is accelerating because of the One Big Beautiful Bill, the AI boom and the ongoing industrial renaissance. As a result, inflation pressures are building, driven by higher wages, higher commodity prices and a weaker dollar, see charts below.
To The Terminal, batman, for a rundown of latest PAIN TRADE …
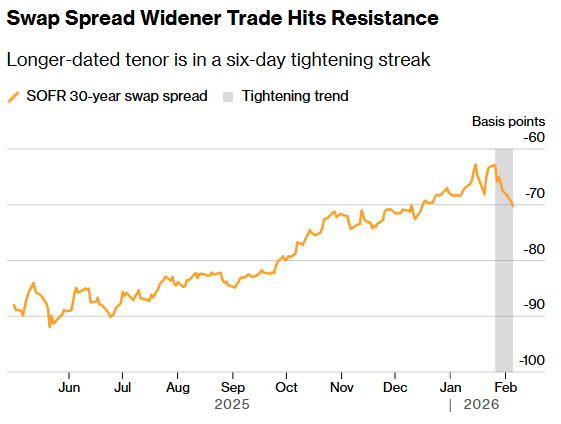
February 5, 2026 at 8:45 PM UTC Bloomberg: Crowded Hedge Fund Treasuries Bet Faces Risk of Rapid Unwind
A highly leveraged hedge fund strategy is flashing signs of strain amid concern that a potential shift in Federal Reserve balance-sheet policy and broader risks could fuel renewed volatility in bonds.
The trade, essentially a bet that Treasuries will outperform similar-maturity interest-rate swaps, widening the yield gap between the two, has come under pressure this week in the long end of the curve. Spreads there have narrowed to their tightest since mid-December. Some market watchers say the move bears the hallmarks of early deleveraging in crowded widener positions, which had delivered strong gains since rebounding from April’s tariff-driven selloff.
“There’s been a long march wider in 30-year swaps spreads from last year, and that trade is coming down a little bit,” said George Catrambone, head of fixed income at DWS Americas. “There’s probably some deleveraging going on and unwinds,” and the sector is prone to “less liquidity” at times as there’s a limited number of players in the market that far out the swaps curve, he added.
One growing worry among traders is that Kevin Warsh, President Donald Trump’s choice to succeed Jerome Powell as Federal Reserve chair, could seek to dramatically shrink the central bank’s balance sheet. Warsh has repeatedly criticized the expansion of Fed assets through so-called quantitative easing…
…Booming Trade A December Bank for International Settlements report put the value of the cash component of the swap spread trade at around $631 billion, more than doubling from $281 billion in the first quarter of 2024 and largely driving the growth of hedge fund exposure to Treasuries. That still trails the more popular basis trade strategy, which bets on discrepancies between cash bond yields and futures. Morgan Stanley recently estimated the cash-versus-futures basis trade at around $1.5 trillion.
Trading in many of these contracts is anonymous, making it difficult to identify the firms involved and the exact beneficiaries of the bets.
Ed Al-Hussainy, a portfolio manager at Columbia Threadneedle Investment, described the recent move in swap spreads as “a pullback from risk-on leveraged trades more broadly.”
“Investors are getting a bit more nervous about the level of rate volatility picking up and that can hurt these swap spread widening (less negative) trades quickly,” he said via email.
Dollar swap spreads tightened Thursday for a sixth-straight session. Treasury yields fell by the most in months as signs of weakness in the US job market helped deepen the retreat from stocks, commodities and cryptocurrencies and boost wagers on Fed policy easing.
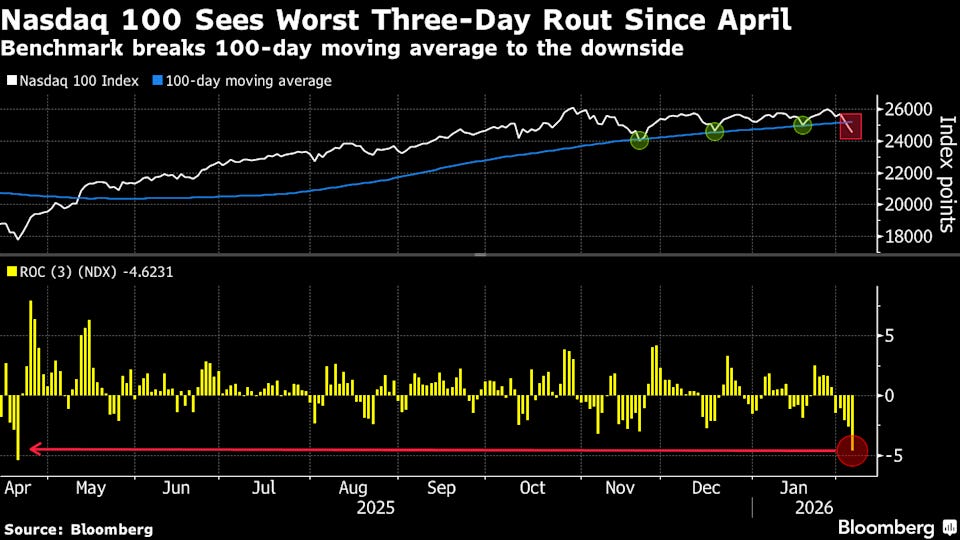
February 6, 2026 Bloomberg: Wall Street’s favorite trades collapse as sell-off deepens
(Bloomberg) -- All across Wall Street, day by day, the headlong rush into the most popular trades, from tech stocks to gold to cryptocurrencies, has given way to a sudden retreat from risk…
…“People are definitely going more defensive,” said Brian Frank, president and portfolio manager at Frank Funds. “It’s more of like a shoot first and ask questions later type environment.
The recent activity marks a strong shift from the mood on Wall Street heading into the year, when strategists were predicting that stocks were poised for the longest winning streak in nearly two decades. The forecasts rested on expectations that the AI boom would continue, the surprisingly resilient economy would keep bolstering corporate profits and that the Federal Reserve would dial down interest rates…
…Fresh labor-market data also added to the pressure on markets Thursday. New figures from Challenger, Gray & Christmas Inc. showed companies announced the largest number of job cuts for any January since the depths of the Great Recession in 2009, adding to concerns that economic momentum may be starting to crack.
The reversal was most dramatic for Bitcoin. After a meteoric rise for much of last year as Trump’s victory set off a speculative rush into cryptocurrencies, the market for such tokens has tumbled sharply this month as investors yanked out cash.
On Thursday, the selloff in Bitcoin deepened as the trading day wore on, dragging down other tokens, exchange-traded funds and the treasury companies like Strategy Inc. that hold vast sums of coins. By late afternoon in New York, it had slumped 13% to just over $63,000, wiping out roughly half its value since it hit a record high four months ago…
AND ‘bout the BIG game …
Carson: Do Stocks Want the Seahawks or Patriots To Win?
“The only place success comes before work is in the dictionary.” Vince Lombardi, Hall of Fame coach of the Green Bay Packers
This Sunday is the big game! The Seattle Seahawks versus the New England Patriots in Super Bowl 60.
First things first, don’t ever invest based on who wins the Super Bowl. Or what will happen at halftime, or the coin toss, or how bad the refs will be. With that out of the way, it is Super Bowl season, and that means it is time to talk about the always popular Super Bowl Indicator!
The Super Bowl Indicator suggests stocks rise for the full year when the Super Bowl winner has come from the original National Football League (now the NFC), but when an original American Football League (now the AFC) team has won, stocks fall. Of course, this is totally random, but it turns out that when looking at the previous 59 Super Bowls, stocks do better when an NFC team wins the big game…
A few final thoughts on tough jobs market …
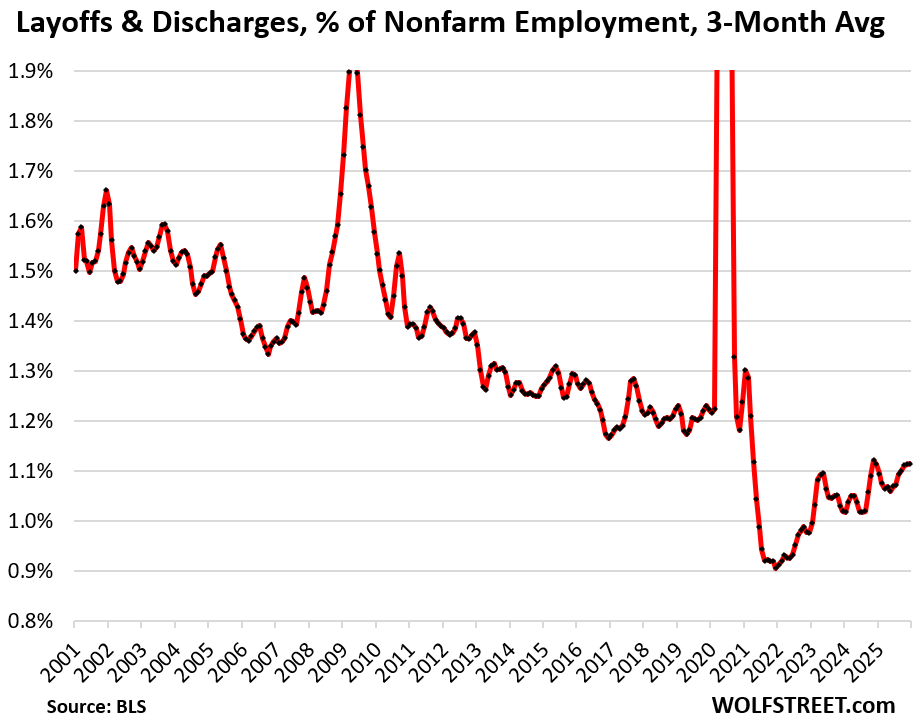
Feb 5, 2026 WolfST: Companies Hang on to their Workers, and Workers Cling to their Jobs: One More Factor why it’s Tough for Job Seekers
Much slower turnover in the labor force leaves fewer job openings to be filled…
…The ratio of layoffs & discharges to nonfarm payrolls takes into account the growth in employment over the years.
Layoffs & discharges amounted to just 1.1% of nonfarm payrolls, which would have been a record low before the pandemic in the JOLTS data, which goes back to 2001. It’s only during the labor shortages that the percentage was lower.
These relatively low layoffs and discharges translate into relatively fewer job openings, and less hiring to fill those job openings – less churn.
AND …
ENJOY the big game … THAT is all for now. Off to the day job…more over weekend …
Amazon's #'s ugly & Bezos owned WaPost gutted, 300 of 800 reporters fired as Sports & Mid East depts get eliminated, interesting. AI bots need to rent 'humans' lol good to know we ain't obsolete-yet. Go Hawks so as to further annoy my Niners friends 🤣


Amazon's #'s ugly & Bezos owned WaPost gutted, 300 of 800 reporters fired as Sports & Mid East depts get eliminated, interesting. AI bots need to rent 'humans' lol good to know we ain't obsolete-yet. Go Hawks so as to further annoy my Niners friends 🤣