while WE slept: USTs unch on light vol; #Fitch on China; SOFR BLOCK (trade) party? Food + Energy CPI index = X, please solve for X; recession probs falling
Good morning … yesterday was an interesting, risk OFF, F2Q bid for USTs (until, late day bid for stonks sticksaved the moment). By days end …
… US Treasuries posted a strong rally ahead of today’s US CPI release for March, with the 10yr yield (-5.8bps) seeing its biggest daily decline in over two weeks. That meant yields came off their highs for the year on Monday, and this morning we’ve seen a further -0.8bps decline to 4.35%. Meanwhile for equities, the S&P 500 saw a late rally to post a modest gain (+0.14%), with the index finding a more stable footing after last week’s decline. Nevertheless, the S&P 500 has now gone 7 consecutive sessions without a new record, which is the longest period without an all-time high since January, back when the S&P 500 surpassed its 2022 peak. So it makes a change from the pattern of very strong gains over recent months, with the index currently on a run of 5 consecutive monthly gains since November…
-DB Early Morning Reid, 10 April 2024
… Ahead of todays all-important CPI, there was some news on the Far East …
FitchRatings: Fitch Revises Outlook on China to Negative; Affirms at 'A+'
Tue 09 Apr, 2024 - 11:39 PM ETFitch Ratings - Hong Kong - 09 Apr 2024: Fitch Ratings has revised the Outlook on China's Long-Term Foreign-Currency Issuer Default Rating (IDR) to Negative from Stable, and affirmed the IDR at 'A+'…
… Good to see not just and always a US downgraded OUTLOOK story …
Be that as it may, sometimes, when catching up at days end, checking in on price action across various global macro inputs — yes FinTWIT is a source — occasionally there are visuals that do just make one stop and pause … here’s one such visual which made ME stop and think ahead of the days important impending ‘flation read …
at RBAdvisors (11:49 AM · Apr 9, 2024)
Gasoline prices often lead the headline #CPI. Gasoline prices have been accelerating and are now marginally higher than a year ago.
… and while this may / may NOT turn out to matter much to THEM (it always matters to ME as always go an extra bit outta my way to hit COSTCO when filling one of the (2) cars in ‘the fleet’), well … I think we regular folks ARE watching them prices at the pump … AND small biz … Same source(s) with another pre CPI hot take to consider …
at RBAdvisors (11:02 AM · Apr 9, 2024)
Small Business’s pricing plans often lead the #CPI. The latest NFIB Survey continues to suggest the CPI could be heading upward not downward toward the #Fed’s 2% goal.
… Whatever. I’m sure it’s nothing at all and so, by days end yesterday, it would seem best descriptor of what it was that happened once again offered by …
ZH: Markets Suffer Conniptions Ahead Of Crucial Consumer Price Print
… Stocks puked early (and dip-buyers stepped in). With around 30 mins left in the day Fed's Bostic said some shit and the market went into panic-bid mode. You decide if it made sense to rip higher:
*BOSTIC: IF JOB DATA SIGNALS PAIN TO COME, OPEN TO EARLIER CUTS
*BOSTIC: IF DISINFLATION PACE RESUMES, COULD PULL CUTS FORWARD
*BOSTIC: CPI COMING IN AT CONSENSUS WOULD BE WELCOME DEVELOPMENT
*BOSTIC: POSSIBLE MAY NEED TO DELAY CUTS "EVEN FURTHER OUT"
Seems like exactly more of the same 'data-dependent' crap from The Fed, but as you can see the algos loved it…
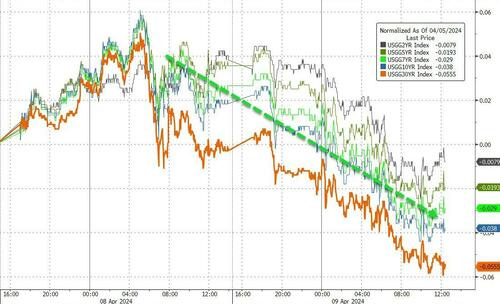
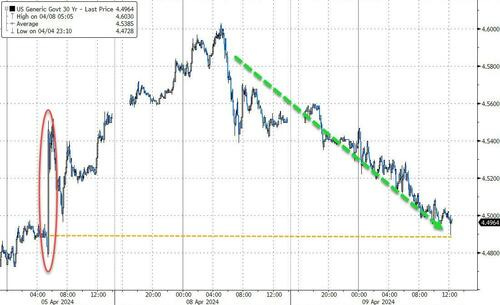
… Amid all this, Treasuries were bid with the long-end modestly outperforming (30Y -6bps, 2Y -4.5bps). Yields are down notably from yesterday's highs...
Source: Bloomberg
With the 30Y Yield having erased all of the post-payrolls spike now...
… anywho, friends and former bond market bandits had to take down 3s on the run and with stonks selling off, a risk OFF reflex TO bonds, well …
ZH: Ugly 3Y Auction Tails The Most In Over A Year As Foreign Buyers Flee Ahead Of CPI
… The internals were also ugly, with foreign demand fading as Indirects took down just 60.3%, the lowest since December's 52.1 (and below the 62.3 recent average), leaving 20.4 to Directs, the most since December, and Dealers awarded 19.31T, the most since, you guessed it, December.
… or perhaps it was simply the risk OFF nature of the morning driving a bid for bonds which then robbed those who might have bid on 3s of whatever concession there was?
Whether it was CPI fear or risk off is, well, beyond my opinionating these days as I’m a couple / few steps removed … So I’ll simply move along as we collectively look forward TO CPI, 10s and then FOMC minutes …
10yy: with bullish momentum, I’m watchin’ ~4.25% (TLINE ‘ish) resistance
… #got10s?
Maybe, just maybe I’m askin’ the wrong question. Shocking NOT shocking. Maybe this one worth a click before CPI …
Bloomberg: Bond Trader Places Record Futures Bet on Eve of Inflation Data
75,000 block trade in December SOFR futures is biggest ever
Wager helped drive gains for front-end Treasuries Tuesday
By Edward Bolingbroke
April 9, 2024 at 7:11 PM UTCA block trade in US short-term interest-rate futures Tuesday was the biggest on record and helped drive gains for the Treasury market.
The trade involved futures on the Secured Overnight Financing Rate, the successor product to eurodollar futures, which were retired last year. Launched in May 2018, SOFR futures have taken over as the principal tool for wagers on the interest rate set by the Federal Reserve.
Shortly after 9 a.m. New York time, 75,000 December 2024 SOFR futures contract changed hands via a block trade, which CME Group Inc. confirmed was the largest in the product to date. Prices subsequently rose, suggesting the trade was buyer-initiated, and Treasury yields slid further toward session lows. Block trades are privately negotiated, single-price transactions that meet a minimum size threshold.
An outright long position in the contract stands to increase in value if March consumer price index data to be released Wednesday is benign, leading to a revival in expectations the Fed may cut rates three times this year. It’s also possible the purchase was done to cover a short position, thereby reducing risk ahead of the data…
… OR the other side of the coin (and curve) …
Bloomberg: Barrage of Short Wagers Leaves Bonds Primed for Post-CPI Squeeze
Leveraged funds boost bearish bets for fist time since January
Tuesday rally suggests negative positioning may be overdone
Treasury bond traders have turned so bearish ahead of a key inflation report that they risk getting squeezed on a less than red-hot reading…
… Treasury Clients Short
JPMorgan’s latest survey of Treasury clients showed shorts rising 2ppts, leaving clients net neutral for the first time since April 17, 2023. On an outright basis, short positions remain the biggest since the start of the year while outright longs are the fewest since February.Hedge Funds Rebuild Futures Shorts
The latest CFTC data covering the week leading up to April 2 showed that leveraged funds extended their net short position for the first time since the end of January. The add to short positioning was equivalent to approximately 171,000 10-year note futures equivalents, with most of the net short being extended in the five-year note contract for a risk weighting of $6.8 million per basis point.
… YOU decide as all positions are said to be created equally … SOME are just, as we know, more equal than others … here is a snapshot OF USTs as of 705a:
… HERE is what this shop says be behind the price action overnight…
… WHILE YOU SLEPT
Treasuries are little changed ahead of this morning's US CPI print. DXY is modestly lower (-0.1%) while front WTI futures are modestly higher (+0.6%). Asian stocks were mixed, EU and UK share markets are all higher (SX5E +0.75%) while ES futures are showing +0.1% here at 7am. Our overnight US rates flows saw little change in prices during Asian hours amid selling in the front-end and buying in the back-end of the curve. After the London crossover, US rates activity stayed quiet with dip-buyers in the 7yr-10yr sector emerging again. Overnight Treasury volume was quite weak at ~70% of average, save for the just-auctioned 3yr (100%).… Further in, Treasury 5yr yields did breakout bearishly last week but they've just revisited their former range highs (~4.35%) from above. So there's also the potential for a false bearish breakout in Tsy 5yrs though, for now, the 4.35% area remains a technically consequential resistance level for 5's. The chart of Treasury 2's predictably has the same exact set-up as that just discussed for 5yrs- just replace 4.35% with 4.735% in the text and... voila!
… VOILA, indeed and moving along TO some MORE of the news you might be able to use…
IGMs Press Picks: April 10 2024
NEWSQUAWK: US Market Open: Contained trade ahead of US CPI … DXY and USTs broadly steady ahead of the main US events
Reuters Morning Bid: CPI vigil, Canada decides, China credit warning
Finviz (for everything else I might have overlooked …)
Moving from some of the news to some of THE VIEWS you might be able to use… here’s SOME of what Global Wall St is sayin’ …
DB: If financial conditions are this easy, is Fed policy that tight?
Two central pillars of modern macro are that the stance of monetary policy is best gauged relative to some measure of the neutral real policy rate and that policy affects the economy in large part through its impact on broad financial conditions.
Today’s COTD brings these ideas together. In light blue is the difference between the 5y TIPS yield and the contemporaneous HLW model estimate of r-star, or the neutral real policy rate. Because TIPS yields embed market expectations for the path of short-term real rates, this is a measure of the anticipated policy stance over the medium run (clouded some by risk premia in TIPS). In dark blue is the Fed Board’s Financial Conditions Impulse on Growth (FCI-G) measure (with one-year lookback), which assesses the extent to which broad financial conditions – various interest rates, stock prices, house prices and the dollar – pose headwinds or tailwinds to US economic activity.
The chart shows a relatively close relationship between these measures over recent decades. But the two have diverged notably over the past year, as the TIPS spread to r-star has hovered around 1-1.5% while financial conditions have eased significantly and are now providing a tailwind to growth. (The FCI-G with one-year lookback is in the 25th percentile of its long-run historical distribution; lower values indicate easier conditions.)
One possible explanation for the recent breakdown is mis-measurement of the neutral rate, which HLW currently puts at 0.73%, roughly 15bp above the median SEP projection. As we’ve highlighted many times, model estimates of spot r-star are subject to large forecast revisions, and the resilience in activity over this hiking cycle suggests neutral is materially higher than many model estimates and forecasts.
To dimension this, given current values of the 5y TIPS yield and FCI-G, it would take a neutral real rate of 1.7% to place these measures of the policy gap and financial conditions within two standard errors of their pre-Covid relationship. While we don’t take that number literally, it does reflect two genuine phenomena: broad financial conditions are not currently tight, and r-star is well above the Fed’s median projection of 0.6%. In short, the chart begs the question, “if financial conditions are this easy, is Fed policy really that tight?”
UBS (Donovan): Details, details
US March consumer price inflation data is due. Inflation is a complex subject (reasonably priced, widely available books could be written about it). Sadly, the world of hashtag economics reduces everything to a single data point (or at best, two). However, the details today really do matter.
Middle-income consumers are what drives US economic growth. Their spending power is not affected by headline consumer price inflation, but by data excluding the absurdity of owners’ equivalent rent (OER), which no one pays. OER inflation may be slowing today, but that does not imply greater spending power. Likewise, slowing car price inflation is also less relevant to spending power—most US consumers will likely not be buying a car this year…
Wells Fargo: Small Business Optimism Falls to an 11-Year Low
The NFIB Small Business Optimism Index fell for a third consecutive month in March, ultimately dropping to its lowest level since 2012. Firms reported sharply lower sales expectations from the previous month, and a net 36% of respondents expect the economy to worsen in the next six months. Price pressures and finding quality labor were the primary issues facing small businesses in March, although inflation has muscled its way back to being the foremost concern for most small businesses. Indeed, the net percentage of small business owners raising prices jumped to 28% from 21%, the highest share since October 2023. The labor market continues to plow ahead, helped along by robust labor supply growth. Firms seem to be having an easier time finding workers as the share of firms reporting a difficult-to-fill position fell to its lowest level in just over three years. That said, hiring intentions continued to move lower in March, falling to their lowest level since October 2016—not including the initial pandemic downturn. Small business optimism will likely remain suppressed going forward as firms continue to face difficulties stemming from rising prices, a strong labor market and uncertain demand outlook.
… And from Global Wall Street inbox TO the WWW,
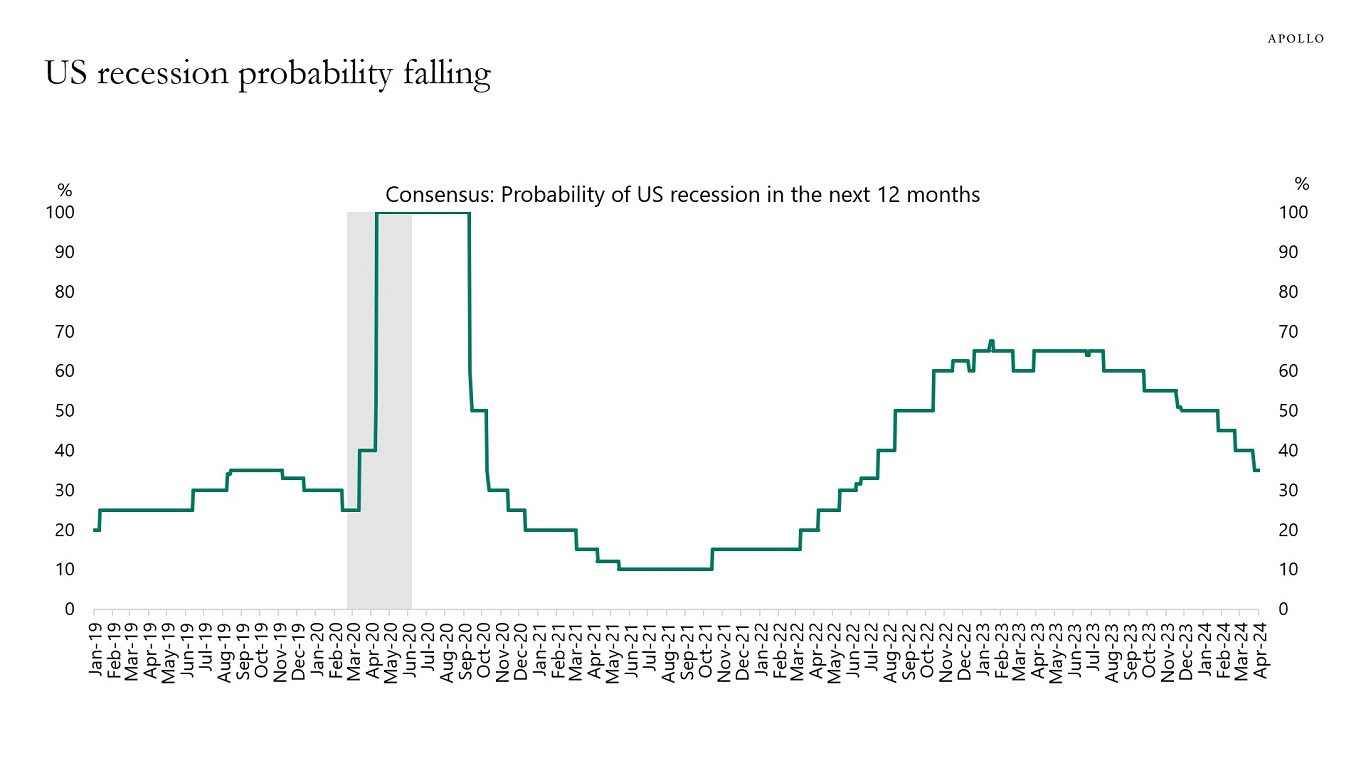
Apollo: US Recession Probability Declining
The consensus has been lowering the likelihood of a US recession over the next 12 months, see chart below.
AllStarCharts: Your Rising Rate Environment
There's an ugly rumor going around that interest rates are going down.
But if you bothered to look for yourself, you've noticed that the exact opposite is what's been happening.
The longer-term trend for interest rates obviously is NOT down. Bonds have been crashing for 4 years.
And even in the shorter-term, both the US 10-year and 30-year yields are hitting the highest levels since November.
So regardless of someone's time horizon, short-term or long-term, where is it that they see falling rates?
Is it that I'm more focused on the longer-duration bonds?
Because when I look at 1-year and 2-year yields I'm seeing the exact same thing.
I see the longer-term trends going from the lower left to the upper right. And the short-term trend higher as well, as both 1-year and 2-year yields are also hitting the highest levels since November.
Is that why metals keep rising?
… This is a Commodities thing.
And there are plenty of stocks benefiting from this trend. Even if you don't trade commodities (I don't), there are some monster trades setting up right now.
Bloomberg: People are angry to the 'anti-core' over inflation (Authers’ OpED)
Some Excel-Powered Political Punditry
Markets are entering a political distortion field. Readers may have noted that the debate is unusually polarized and angry at present, with seven months to go until US voters have to choose between two candidates whom most of them dislike. That’s having real effects on the economy and on markets already.Exhibit A is the usually very useful survey of small business optimism conducted by the National Federation of Independent Business. It’s been running a long time and has a good history as an economic leading indicator. Very few small business owners are bleeding-heart liberals, but this hasn’t compromised the survey in the past. Yet it certainly looks like that’s happening now. Somehow or other, their optimism has just dropped to a lower level than it ever touched during the worst of the pandemic. Indeed, it hasn’t been this low since December 2012, when they had to digest the surprisingly comfortable reelection of Barack Obama:
Other than that, pessimism has only been greater during the Global Financial Crisis, and — much more briefly — the dire days of 1975 and 1980 when the US was dealing with both economic recessions and humiliating international reverses (in Vietnam and Iran). Pessimism was never so deep during the Gulf War, or in the wake of the dot-com bubble, or even the pandemic. Reviewing history, we find that the election of Donald Trump led in swift order to the greatest optimism on record. Greater than the late 1990s? Really?
Nobody doubts that small business leaders are sincerely pessimistic, or that their negativity about prospects brings with it the risk of a self-fulfilling prophecy. If they hold off investments or hiring because of the grim outlook they foresee under Biden, that will be bad for the economy. But would they really think things were this bad if they weren’t viewing them through the polarized lens of 2024’s politics?
Then there’s the issue of US inflation, which we’ll learn a lot about in a few hours after you receive this with the publication of the consumer price index numbers for March. The great issue for central bankers is services inflation, particularly for shelter. Inflation is coming down; it’s not that high in historical terms any more, but it’s obvious that many people are genuinely still furious about it. Why?
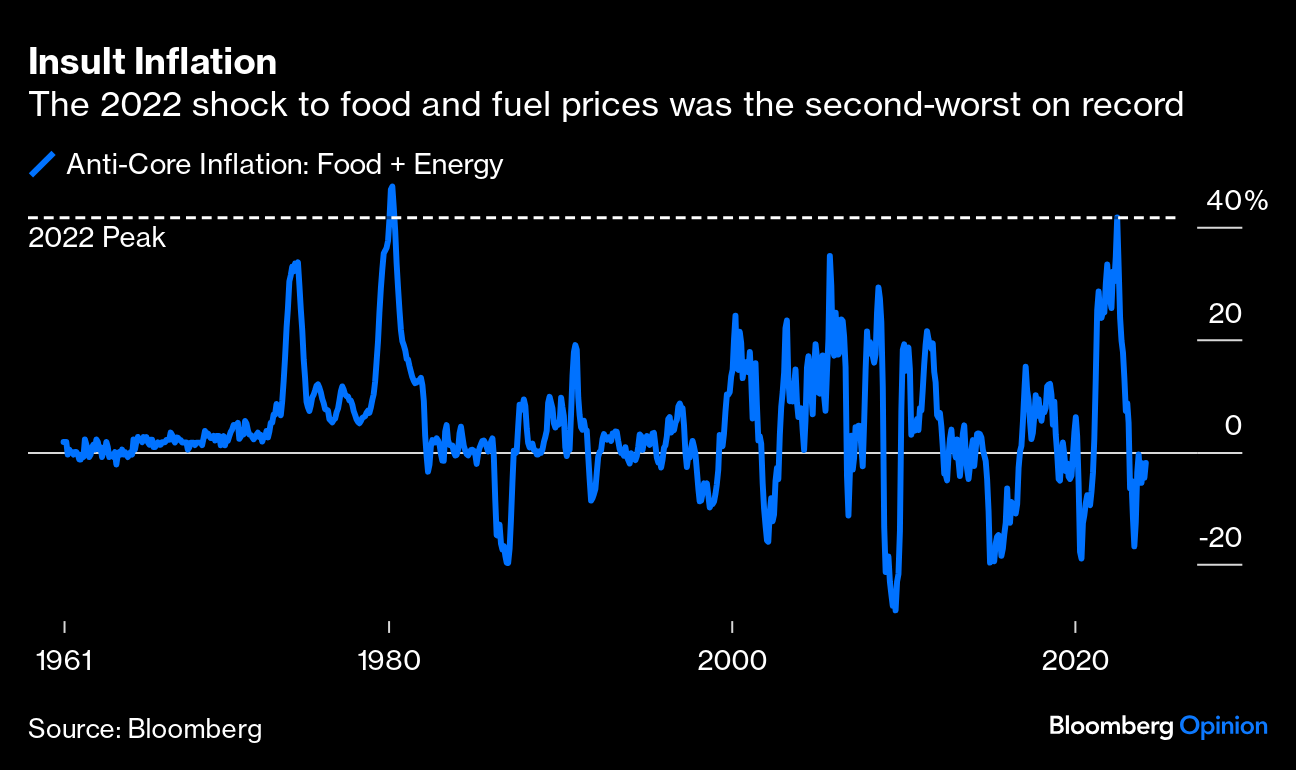
Points of Return published data on food inflation yesterday that helped get at the issue, but Jean Ergas of Tigress Financial Partners suggested to me that the crux of the issue for many consumers isn’t headline or core inflation, but food and fuel…
… This is how year-on-year inflation of this measure has moved since 1961. It’s been hugely variable, but the spike in the summer of 2022 was quite something. Indeed, it was the worst anti-core inflation in 42 years; it was higher even than during the horrors of the oil crisis of the 1970s. This is how bad it looks:
It’s not surprising that a spike of that severity would leave a mark and create a lasting stain on popular confidence in the current administration. However, it’s also important that this measure continues to be very erratic, and has been negative for several months now. Not only is the rate of inflation down, but prices themselves are actually falling. Will President Joe Biden get some credit?
Possibly not, for reasons that grow clear if we look at the growth in the index in itself (not its annual rate) going back to 1960. In general, it increases over time. The one huge exception came in the summer of 2008, when an incipient inflation crisis driven by a boom in commodity prices was suddenly thwarted by the global credit crisis. What’s interesting is that after the peak in June 2008, it took the anti-core 13 years to rise to a new high in March 2021, the second complete month of the Biden administration. Then it went ballistic:
In much the same way that the weird post-crisis decade got financiers used to rock-bottom rates and rising asset prices, it also provided a wholly anomalous interlude in which people got used to the notion that food and fuel costs don’t go up. Then when that was broken, it was done in style. There’s room for argument as to exactly how much of the blame for this attaches to a Biden administration that took office just as the pandemic was ending and inflation was starting its upswing. But viewed this way, it’s glaringly obvious why the spike would feel like an outright insult, breaking an implicit contract that had lasted more than a decade. Even with the index ticking downward, it’s also evident that people wouldn’t be in the mood to forgive whoever was in the hot seat. This was both insult and injury.
And in any case, arguments that such important matters as the price of food and fuel aren’t the administration’s fault aren’t going to help politically. The damage has been done. The March CPI data matter a lot to the near-term future of interest rates; it’s possible they don’t matter much to the question of who will be the next occupant of the White House.
… Finally ahead of CPI and all that is riding on it …
… THAT is all for now. Off to the day job…


Fed, ON HOLD Indefinitely............
The 99 Cent stores closing out west here won't help w/the Foodflation; 1 less cheap food option available :(