Tasnim News: Iran Announces New Control Zone in the Strait of Hormuz
Investing.COM: FARS says 2 missles hit US warship, US DENIES
Bloomberg: Oil Rises as Market Monitors US Plan to Help Ships Exit Hormuz
CNBC: Oil prices rise as Trump plans to ‘free’ ships stranded due to Mideast conflict
… AND a few thoughts …
Fitting start and end to the week (for me … out after today, story, excuse, explanation over the weekend, HERE) …
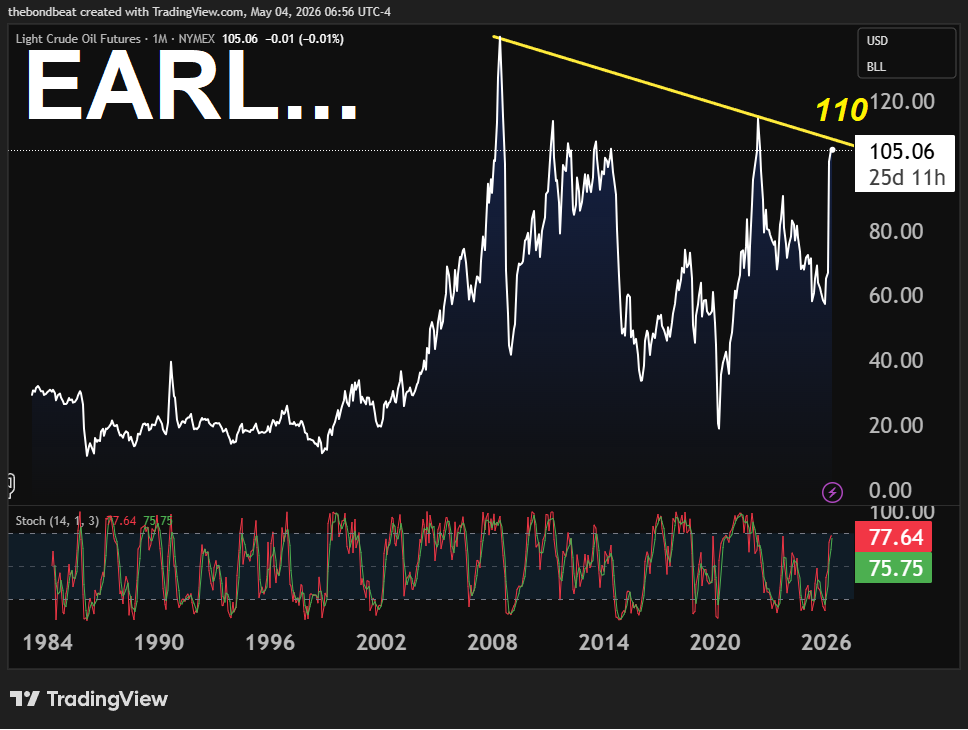
With the aformentioned headlines and EARL continuing to drive ALL other markets, and all other markets not knowing whatever next, well … I’ll lead with visual of EARL as much as it pains me to do so …
Pains me to be out of my ‘comfort zone’ but then, it would be fitting to see high / rising gas prices as I set to embark on a rather lengthy road trip … Moving during the pandemic was fun. Then, buying a used car during it, too … so why NOT then road trip with gas prices at these levels??
Forget it … EARL impacting all of us even those on Global Wall … over weekend some (JPM) raised year end f’casts and others remain long as rates rise. Trailing stops close. Today you’ll note below yet others marking to market their FOMC cut calls (punt ‘TIL 2027) and all makes sense and, well, when the facts change … you know the rest.
Wishing lots of luck to KWARSH and almost feel like JPOW one of the luckiest men in the room …
I’ll quit while I’m behind as I ask my BondBot Intern what’s on HIS mind …
Oil Headlines, Bond Headaches, and the Strait of “Wait…What?”
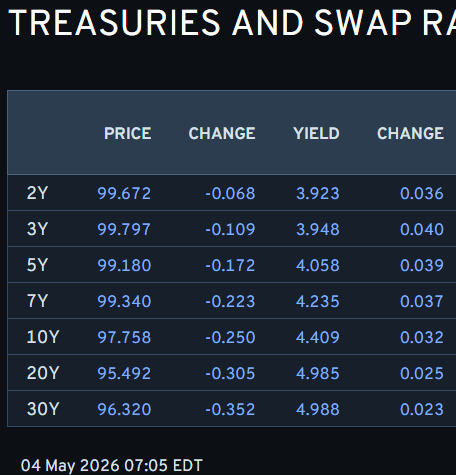
Since Friday’s 4pm close, Treasuries did what they always do when geopolitics turns into theater—yields popped, then thought better of it. The 10Y flirted higher toward ~4.55%, 30Y nudged ~4.70%, while the 2Y held near ~4.95% as oil spiked on “Iran shot / U.S. didn’t notice” headlines and the Strait of Hormuz opened, closed, and reopened like a bad retail store. Equities wobbled, then shrugged.
Why? Bonds are pricing a familiar cocktail: higher energy = sticky inflation = Fed staying grumpy.
For Main Street, that means mortgages stay expensive and relief stays theoretical.
Punchline: The bond market doesn’t trade headlines—it trades the hangover.
… indeed, it does … Moving on …
Onwards and upwards TO the reason many / most of you are likely here … whatever it may be on Global Wall’s mind but first … here is a snapshot OF USTs as of 705a:
… for somewhat MORE of the news you might be able to use … a few curated links for your dining and dancing pleasure …
NEWSQUAWK US Market Open: Trump says US is to “guide” ships through the Strait, though Iran threatens attacks on those attempting to enter … A slightly bearish start to the week, though conditions are thin on account of holidays in China, Japan and the UK … USTs down to a 110-15+ trough this morning, hit by an uptick in energy, which reverberated through on a wider airing of comments from Iran regarding the US’ activity around Hormuz. At most, USTs have been lower by 5+ ticks. Ahead, we await remarks from Fed’s Williams and then the financing estimates ahead of refunding later in the week.
Finviz (for everything else I might have overlooked …)
Moving from some of the news to some of THE VIEWS of Global Wall you might be able to use … NOTING, too, WEEKEND OBSERVATIONS (click HERE) offered something from bulls, bears and those who’ve CHANGE (increased) year end yield targets …
A large British bank UPDATING FED CALL … when the facts change, they change, what do you do, sir …
With energy prices expected to be elevated throughout 2027 amid the Iran conflict, we mark up the trajectory of core inflation and nudge down our growth forecasts. With the timeline for bringing down inflation elongated, we now expect only one 25bp Fed cut through end-2027, in March 2027.
Our oil strategist’s updated price projections (Energy Sigma: Shifting gears, May 1, 2026) now assume that Brent prices will peak at $115/b in the current quarter before edging down only gradually to $100/b in Q4 2026, averaging $100/b for the year as a whole. He also maintains his view that risks are skewed toward higher prices if the Strait of Hormuz disruption does not improve in the coming weeks. The revised trajectory of WTI has been marked up similarly, with the price peaking at $105/b in Q2 and averaging $93/b for the year. While the year average has moved up by $10 (WTI) for 2026, the persistence is higher in the current scenario relative to our prior baseline…
…We view risks around our baseline more balanced than previously, though we continue to view risks to oil prices and the inflation outlook as tilted to the upside, if disruptions to traffic through the Strait of Hormuz persist. In that case, we would expect the FOMC to delay rate cuts even further. Conversely, if the unemployment rate were to rise suddenly – eg, as a result of a sharp slowing in consumer spending or a drop in real investment – we would expect the FOMC to cut more rapidly and aggressively…
A historic oil supply shock has so far failed to derail global markets, as inventories and prior overproduction cushion the blow. But every passing week now increases the risk to the world economy.
…The world has some runway, but now every week hurts more But every passing week now hurts the world economy more. There are no more new tankers arriving, and the world is eating into its inventories at a much quicker pace; our estimate is that inventory drawdowns are now up to as much as 80mn barrels a week. We suspect the IEA report for April will paint a much darker inventory picture than it did in March. The SPR release is not indefinite either, and some countries (including the US) are running fairly low on SPR reserves.
Furthermore, keep in mind that consumers and businesses do not consume oil, they consume refined products. In that regard, the US DOE inventory report from last week is worth reviewing: distillate (eg, diesel, jet fuel) days of supply on the most recent week of demand stood at just over 18 days, versus a five-year seasonally-adjusted average of over 23 days; gasoline looks better at over 22 days (just a day shy of the five-year average), but consider that the US is only now preparing for its summer driving season.
So how much longer is the runway for the world economy? Our guesstimate is that summer 2022 is a reasonable point of comparison. Oil prices were near current levels that year for a few months as the Russia-Ukraine conflict kicked off. But compounding matters further in 2022 was the fact that global inventories were significantly lower than now (before adjusting for demand). Our best guess is that – if status quo persists – inventories will be in a similar precarious state by late May.
In other words, the next few weeks are the runway that the world economy has left, before demand destruction really kicks in. In The day after (the Middle East conflict ends), our oil analyst estimated that delaying normalization of the Strait to end of May from end of April was worth $20/bbl for Q2 26 ($130/b Brent vs $110), and $13/bbl for the full year ($111 vs $98). The clock is ticking.
Time for caution We have been generally positive on risk assets through much of this crisis. As early as March 11, in ‘60 Million Frenchmen cannot be wrong,’ we argued that markets were pricing in a benign outcome for this crisis, but for good reason. In the quarterly Global Outlook, Cracks, but not a crater, released on March 26, we recommended overweighting global equities over fixed income, even as the Iran war raged on. And on March 24, our equity analysts increased their earnings and S&P price targets in Discounting doubt: Raising ’26 SPX EPS.
Since then, US earnings have delivered – in spades. But after one of the strongest April months on record for equities, we worry that markets have decided that the energy shock simply doesn’t matter anymore. If so, we disagree – this is a crisis delayed, but not yet averted. It is time, we think, to turn cautious on risk assets.
The analogy is a household that loses its income and lives off savings. Month one feels fine. Month two is manageable. Month four is when you start skipping things. The world economy is somewhere around month two. The savings account is still positive. The bills are still being paid. But the balance is declining, and nobody has found a new job yet.
The buffers worked. They were designed for exactly this. But they were designed for a disruption, not a new normal. And every week that passes without a resolution moves us a bit closer to the point where the insurance runs out.
Thanks for reading The BondBeat! Subscribe for free to receive new posts and support my work.
May 3, 2026 MS IDEA: Sunday Start | What’s Next in Global Macro: 11 Seconds
…Taken together, we think this presents a worse skew for credit versus equities. Continued strength in spending may support broader markets but mean heavy credit supply and upward pressure on spreads. If spending weakens, the broader hit to sentiment and risk appetite could catch credit in its wake.
Yet an even stronger thread running through this story is its competitive nature. The biggest AI spenders are some of the largest, wealthiest companies in history. They see AI as a long-term opportunity with an enormous total addressable market. The stakes, and the difference between being ‘first’ and ‘fourth’, are enormous.
If that seems like a fair assessment, something else follows: (relative) price insensitivity. Less sensitivity to what the components cost. Less sensitivity to what the borrowing costs. Less sensitivity to short-term swings in the share price. What matters is winning a race that still has many miles to run.
How that evolves has macro implications too. Kevin Warsh, nominee to be the next Fed Chair, believes that these investments can boost productivity and justify lower interest rates (see last week’s Start for more on this debate). But price-insensitive demand for the AI buildout could also put upward pressure on prices, as it is already doing for everything from memory to power.
How fast this investment grows, how price-insensitive the spenders are, and how productive the new models become are all major debates playing out in real time. But for those of us who will never design a chip or construct an LLM or wire 11,000 GPUs together, there is still something powerful about watching formidable competitors, battling it out mile after mile in one heck of a race.
Central banks are broadly in a holding pattern, prioritizing flexibility as energy shocks dominate the outlook. Policy paths are increasingly driven by two-sided risks…
…We begin with the Fed. The April FOMC meeting marked a shift in tone, indicating the committee’s view that the easing cycle would be pushed further into the future. The dissents and Powell’s comment showed us that the bar for rate cuts got much higher. Given the strength of US growth and five years of above-target inflation, the global oil supply shock means the Committee is in no rush to cut rates. If the inflation path remains unchanged, with tariff inflation receding and oil-driven inflation largely excluded from core, we see cuts pushed from Sep-26 to 1Q27, when the disinflation will be more apparent. If inflation goes and stays higher, however, the cuts could disappear. Powell did retain optionality, describing policy as only mildly restrictive while explicitly not ruling out hikes.
Exhibit 1: The FOMC meeting indicated a higher bar for cuts, and we see cuts pushed out to 1Q27. The ECB highlighted two-sided risks but more growth data are necessary.
Resiliency this earnings season is broader than appreciated with a median stock EPS growth rate of 16% and a beat rate of 6% (strongest in four years). Further, EPS revisions breadth has resumed its ascent with the momentum coming from Semis, Financials, Industrials and Consumer Cyclicals.
…Moving Parts on the Monetary Policy Side: The Fed signaled a less dovish reaction function at last week’s FOMC meeting given solid growth/labor data and the potential for commodity-led inflation risk. While the Fed is now in the transition period to a new Chair, Kevin Warsh also alluded to a patient approach around further rate cuts at his Senate confirmation hearing. With the bond market pricing out cuts, investors are focused on potential equity market impacts. Our work shows that equity index returns are historically strong (mid-teens range) over a 12-month period when the Fed is on hold and earnings growth is above the long-term median (8%). Index upside is only slightly stronger (high-teens range) when the Fed is cutting and earnings growth is above the long-term median. The bottom line is that a strong earnings backdrop, which we expect over the next 12 months, is the main driver of upside in both outcomes. The near-term risk from the Fed is more related to liquidity tightness if they were to underestimate how much capital the real economy is now using for investment and the rolling recovery. Markets could periodically reflect this risk via higher bond volatility and/or tension in funding markets. A stronger dollar could also play a role in this dynamic. The Treasury (Buybacks) and Fed (Reserve Management Purchases) have tools in place to deal with tensions should they arise and are likely to do so in a reactive, rather than proactive manner.
…Fed and Treasury Impacts on Markets Over the past several months, the bond market has gradually priced out the cuts that were assumed coming into the year and is even now pricing in a greater chance of hikes than cuts through July of next year, albeit modestly. If we were to ask most equity market investors for their view on how the Fed has pivoted this year, almost all would likely indicate the Fed has turned incrementally hawkish. Looking just at the rates dynamic, we would agree and it’s one of the primary reasons why equity multiples corrected so much over the past 6 months (S&P 500 P/E down -18% peak-to-trough and still down around -10%). As the exhibit below shows, the recent P/E rise from the lows has outpaced the re-pricing of fed funds futures for October 2026.
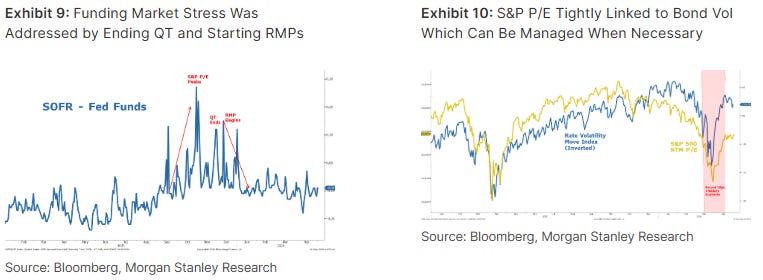
Exhibit 8: P/E Multiples Took A Hit Amid Iran Conflict and Fed Re-Pricing; They Have Stabilized but Remain ~10% below Peak
However, this ignores a very important aspect of activity by the Treasury and Fed over the past 6 months in an effort to control bond volatility and funding market stability. As noted in our research for months, the equity market correction began last fall with a tightening in funding markets. This is also when P/E multiples peaked for the S&P 500 and equities more broadly. The Fed noticed this stress at the time and decided to end QT earlier than planned to address it. When that action failed to fully calm the funding market stress, the Fed decided to reactivate asset purchases with its Reserve Management Purchases in December which had its desired effect (Exhibit 9). This injection of liquidity quickly translated into a stable P/E near 22x, but led to a surge in gold and silver prices as some market participants viewed these asset purchases as simply another form of QE and/or monetization of the debt via greater bill issuance to be sopped up by the Fed.
As noted, the decline in P/Es was severe in March at the index level, and it was much more significant for certain parts of the equity complex. Besides the repricing of the policy rate, we believe rising bond volatility also played a role and got the attention of both the Fed and Treasury as is typical. Enter Treasury buybacks which increased substantially in March and April to $100-125B ($1T+ annualized). In our view, this had its desired effect of reducing bond volatility substantially (Exhibit 10). As a side effect, it also helped to propel equity multiples higher. Net-net, this decrease in bond vol and slightly less hawkish pricing on Oct fed funds can help to explain the rebound in equity multiples to where we are trading today (21x). Looking just at Exhibit 8, one might argue multiples have outpaced their implied move. But, when looking at Exhibit 10, one could argue multiples could rise more.
The answer likely lies somewhere in between, and the fact that earnings results are far exceeding expectations is another argument for higher, not lower multiples. We have been arguing for months that the correction in valuations more than accounted for the risks facing the market. That argument is even stronger in the case of the hyperscaler/Mag 7 stocks which we upgraded near the end of the correction in early April. Just like with the S&P 500, multiples have rebounded, but arguably not as much as they could or should. We think the liquidity risks are keeping a lid on valuations but are unlikely to be material enough to cause valuations to compress in a notable way without a new shock…
US President Trump posted on social media that the US will “guide” commercial shipping through the Strait of Hormuz. Media reports suggest this will not involve naval escorts. Iran’s parliamentary security committee head Aziz called the posts delusional. The oil market reaction gives weight to the Iranian view. US gasoline prices are approaching USD 4.5 per US gallon, which is an incentive for the administration to use calming rhetoric to guide markets. This has less impact as the point of physical shortages moves closer.
There is a pontification of central bank speakers on the agenda—no fewer than six from the European Central Bank (ECB). There is genuine uncertainty about ECB policy, so signals of what the central bankers are looking at would be helpful. Federal Reserve president Williams is also speaking. As a competent economist, William’s words carry weight…
Finally, stocks going from lower left ot upper right AND in addition TO economic calendars offered over the weekend …
The stock market balloon is climbing higher, and the burners are firing. It isn’t all hot air that is lifting stock prices. It’s also earnings revisions, which are increasing for 2026 and 2027. Growth stocks and the Magnificent-7 have reasserted leadership over the past month. Small caps and the Russell 2000 are at fresh record highs too. Investor sentiment remains surprisingly lackluster, leaving plenty of upside for the balloon. Even the soft spot in private credit is showing signs of stabilizing.
The question is whether the balloon is actually a bubble. We don’t think so. Consider the following:
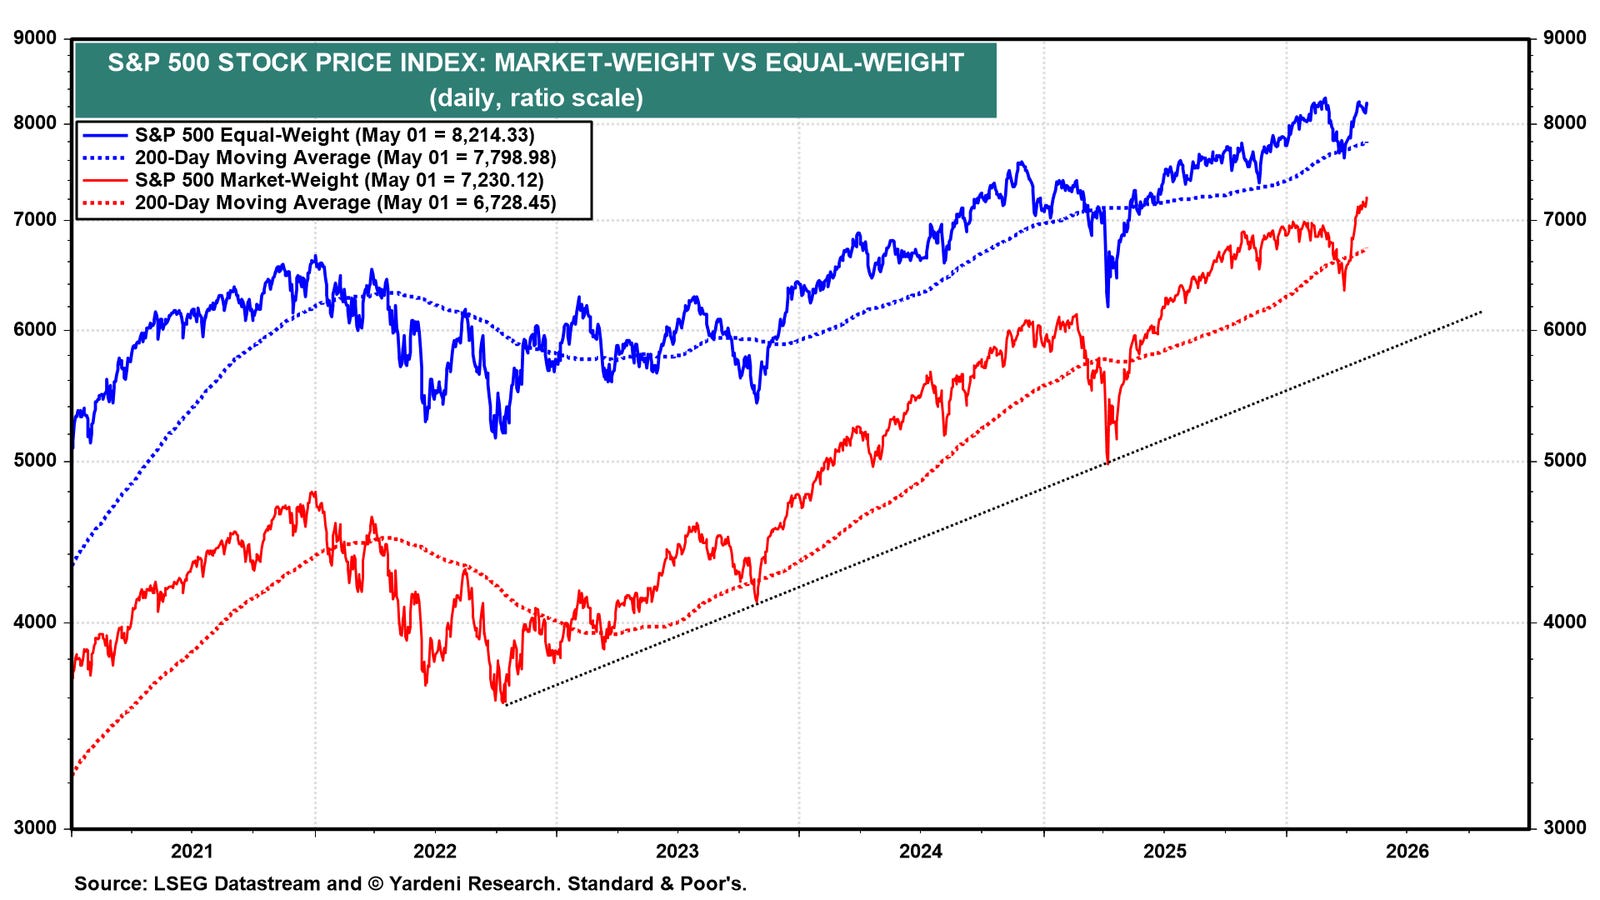
(1) Stock prices. The S&P 500 market-cap-weighted and equal-weighted indexes have rebounded significantly since they bottomed on March 30 (chart). The former has risen to a record high, and we expect the latter to follow suit. Both of their 200-day moving averages (dma) are trending higher.
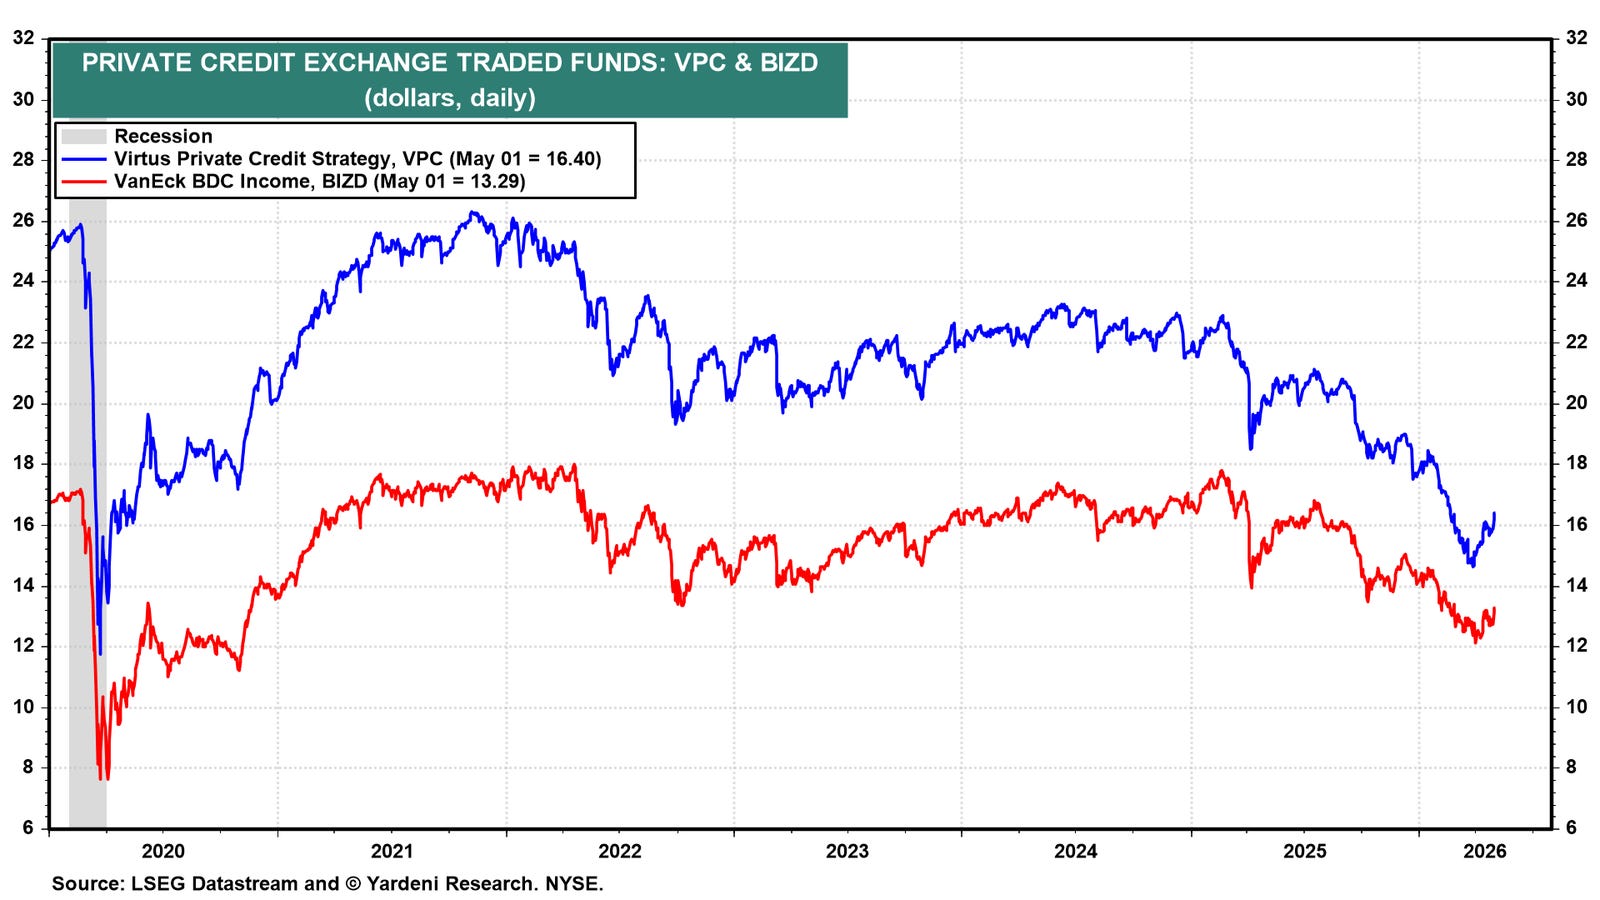
…Investors are starting to nibble on private credit ETFs (chart). The Virtus Private Credit ETF (VPC) and VanEck BDC Income ETF (BIZD) both have rebounded off their recent lows (chart). Commercial bank loans and leases continue to rise, reinforcing our Financials thesis that the stress in the credit market is localized rather than systemic.
(2) Earnings. S&P 500 forward operating earnings has hit a fresh record high of $346.19 per share (chart). Consensus EPS estimates now stand at $327.87 for 2026 and $380.79 for 2027, and both appear still to be rising. Forward earnings is the single best leading indicator of stock prices, and it continues to point higher…
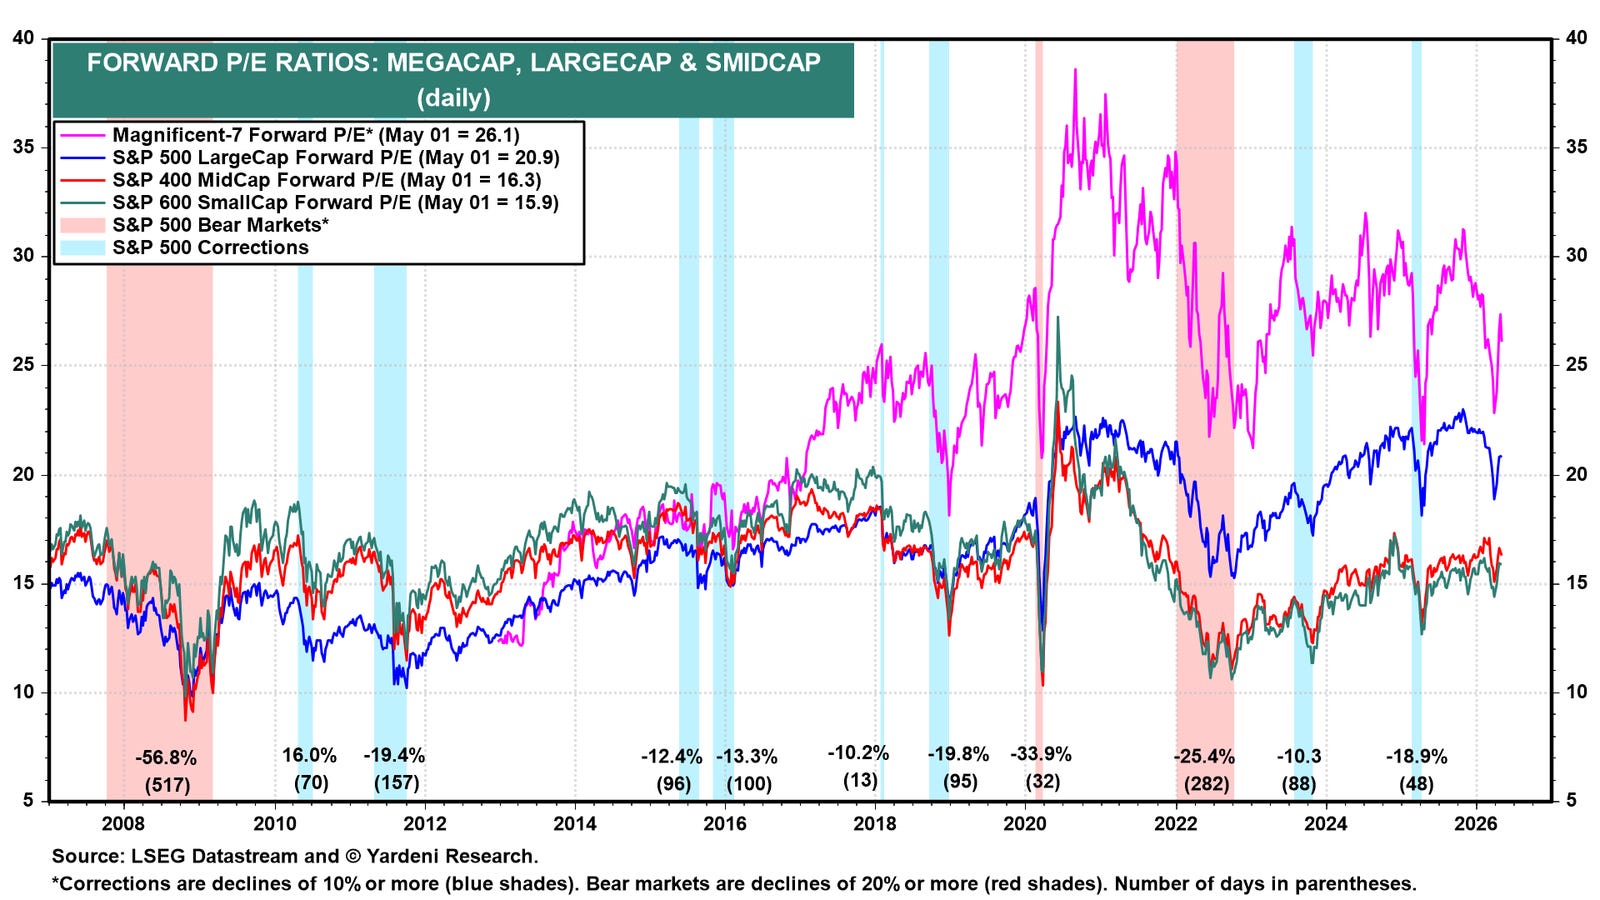
…3) Valuation. US stocks are still cheaper than they were at the end of last year.The forward P/E of the S&P 500 is at 20.9, well below the 23.0 peak at year-end 2025. MidCap’s forward P/E is at 16.3, and SmallCap’s is at 15.9. Both are still cheap relative to their own histories. Even the Magnificent-7’s forward P/E of 26.1 is well off its peak of last October (chart).
The week ahead is chock-full of labor market indicators. In addition, nine Talking Fed Heads on the Federal Open Mouth Committee are on the speaking circuit, with Williams, Bowman, and Goolsbee coming up twice. Despite the elevated oil prices, the stock market continues to levitate to new highs. The price of a barrel of West Texas Intermediate crude hit $110.10 intraweek and closed on Friday at $102.48. Brent crude hit as high as $120.65 during the week and closed at $108.72. The S&P 500 finished the week at another record high regardless.
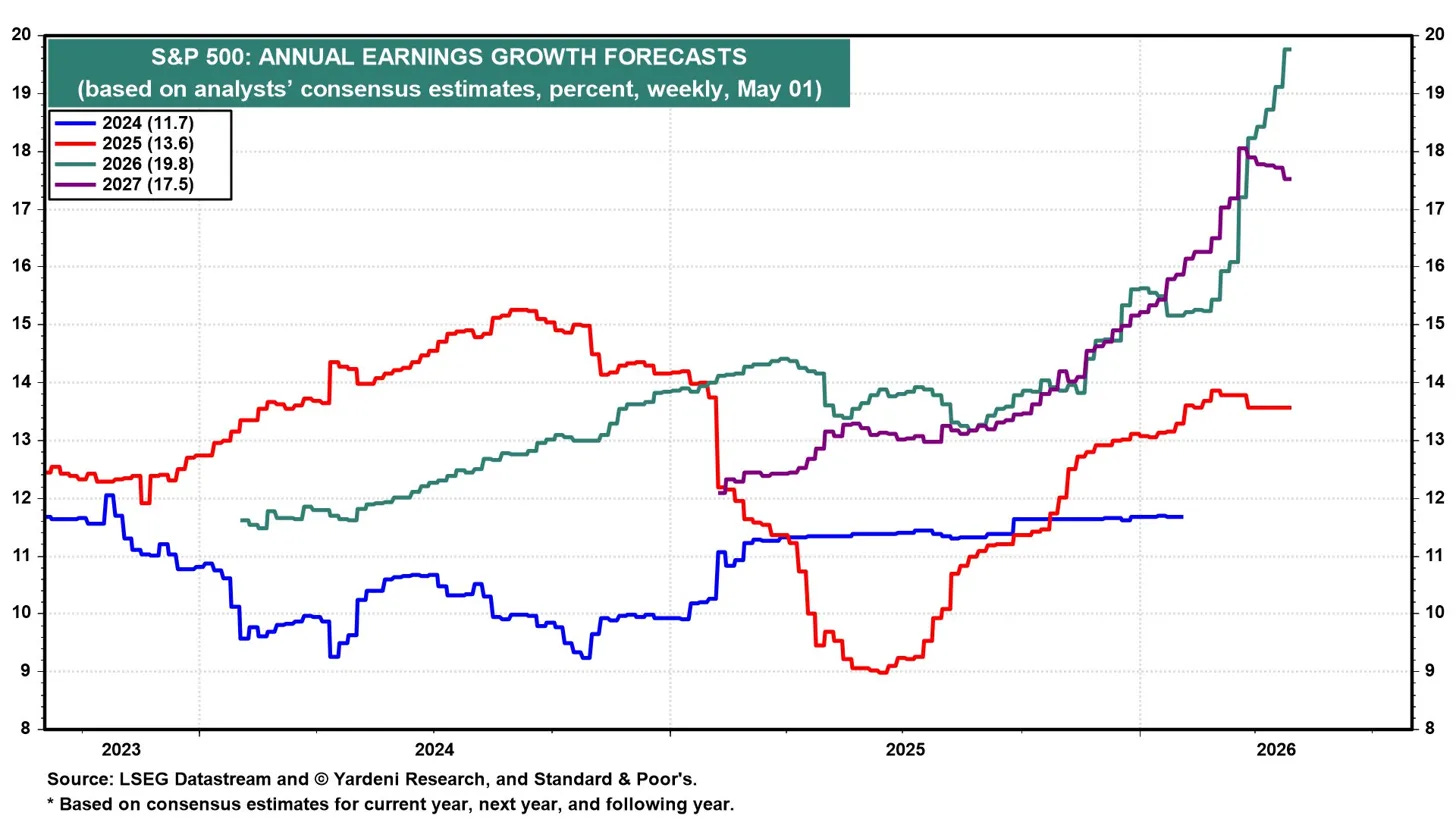
The Q1 earnings reporting season is going strong. Roughly 44% of S&P 500 companies reported results last week. Big names scheduled to report this week include Palantir, AMD, McDonald’s, and Arm. The industry analysts’ consensus forecast for S&P 500 companies’ aggregate earnings growth in 2026 has climbed to 19.8%, well above the 11.7% and 13.6% figures posted in 2024 and 2025 (chart). The double-digit marathon should continue in 2027, with the analysts collectively forecasting a 17.5% gain. They certainly are in sync with our Roaring 2020s narrative!
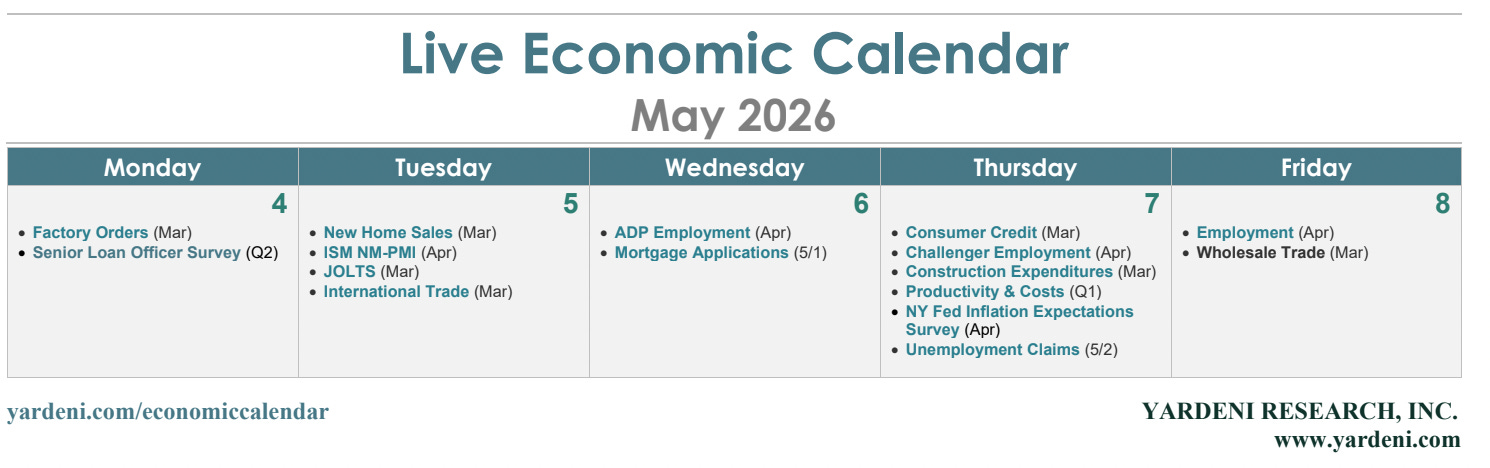
With that said, let’s take a look at the key releases most likely to shape investors’ thinking on business activity, the state of the consumer, the labor market, and inflation this week:
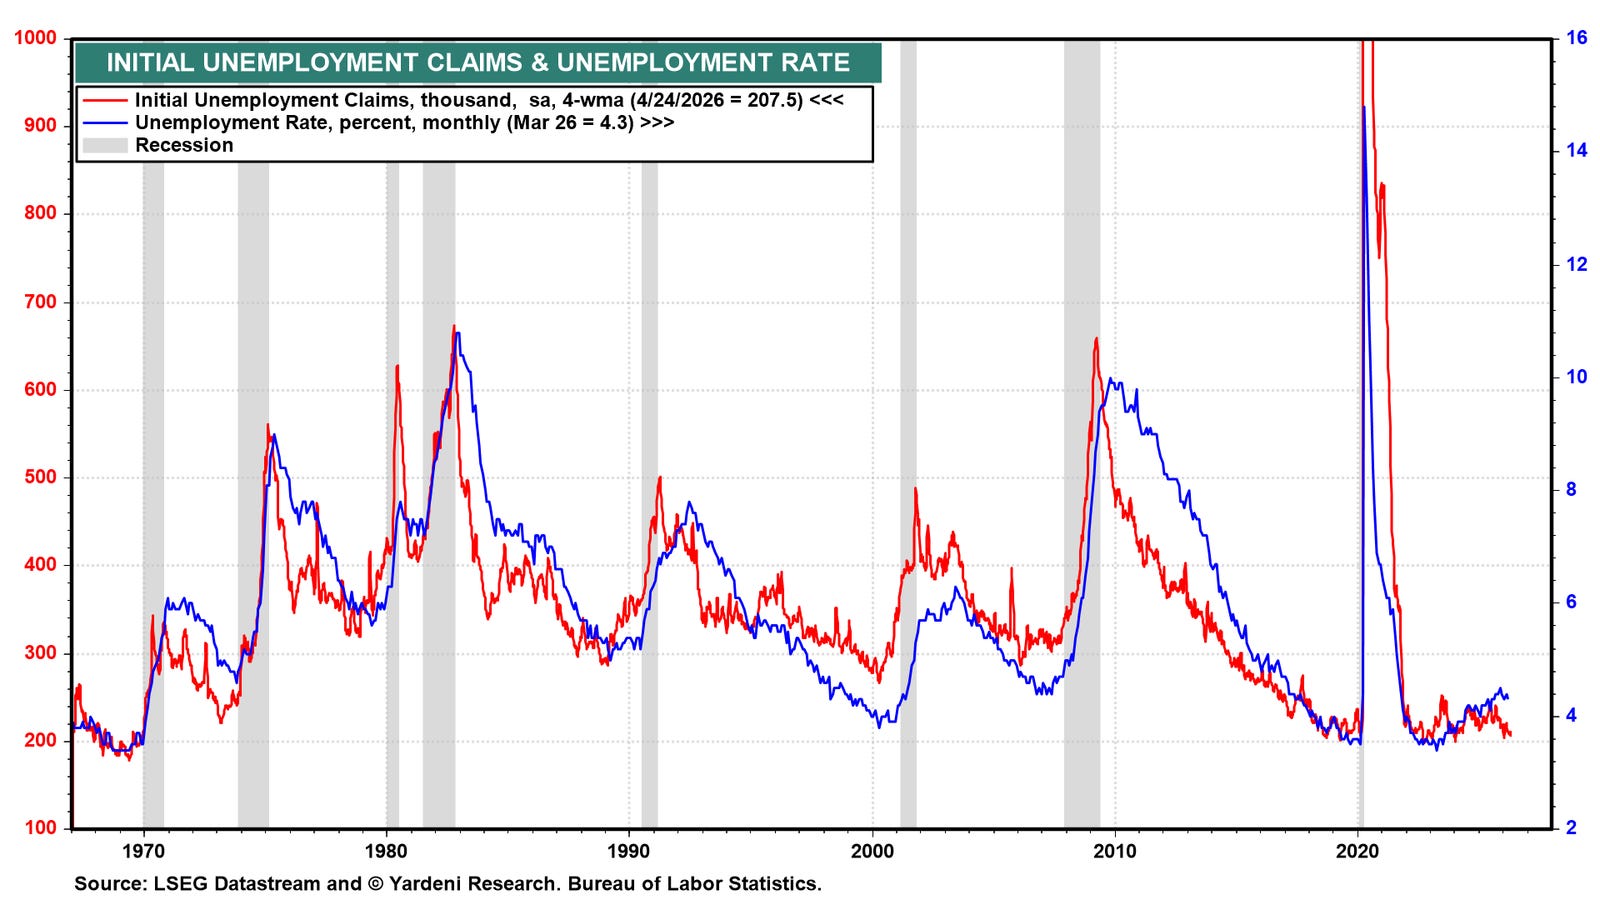
(1) Employment. April’s employment report (Fri) is the headliner for the week. The unemployment rate is likely to tick down to 4.2% based on its relationship with initial unemployment claims (Thu), which have been falling in recent weeks (chart).
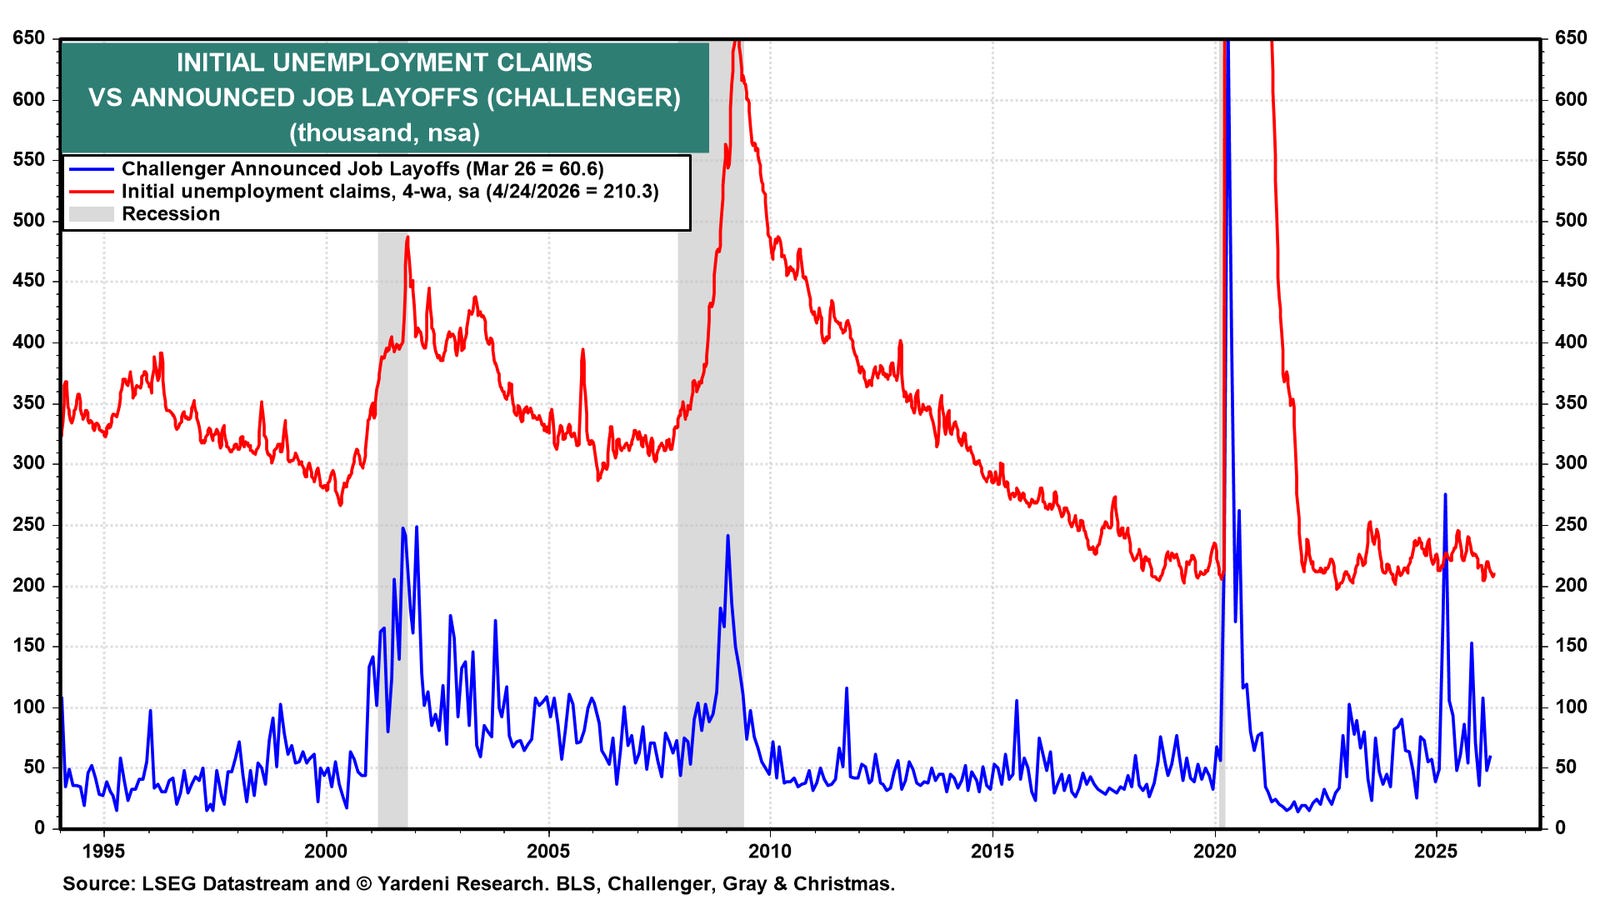
Jobless claims also suggest that the Challenger measure of layoffs (Thu) remained low in April (chart).
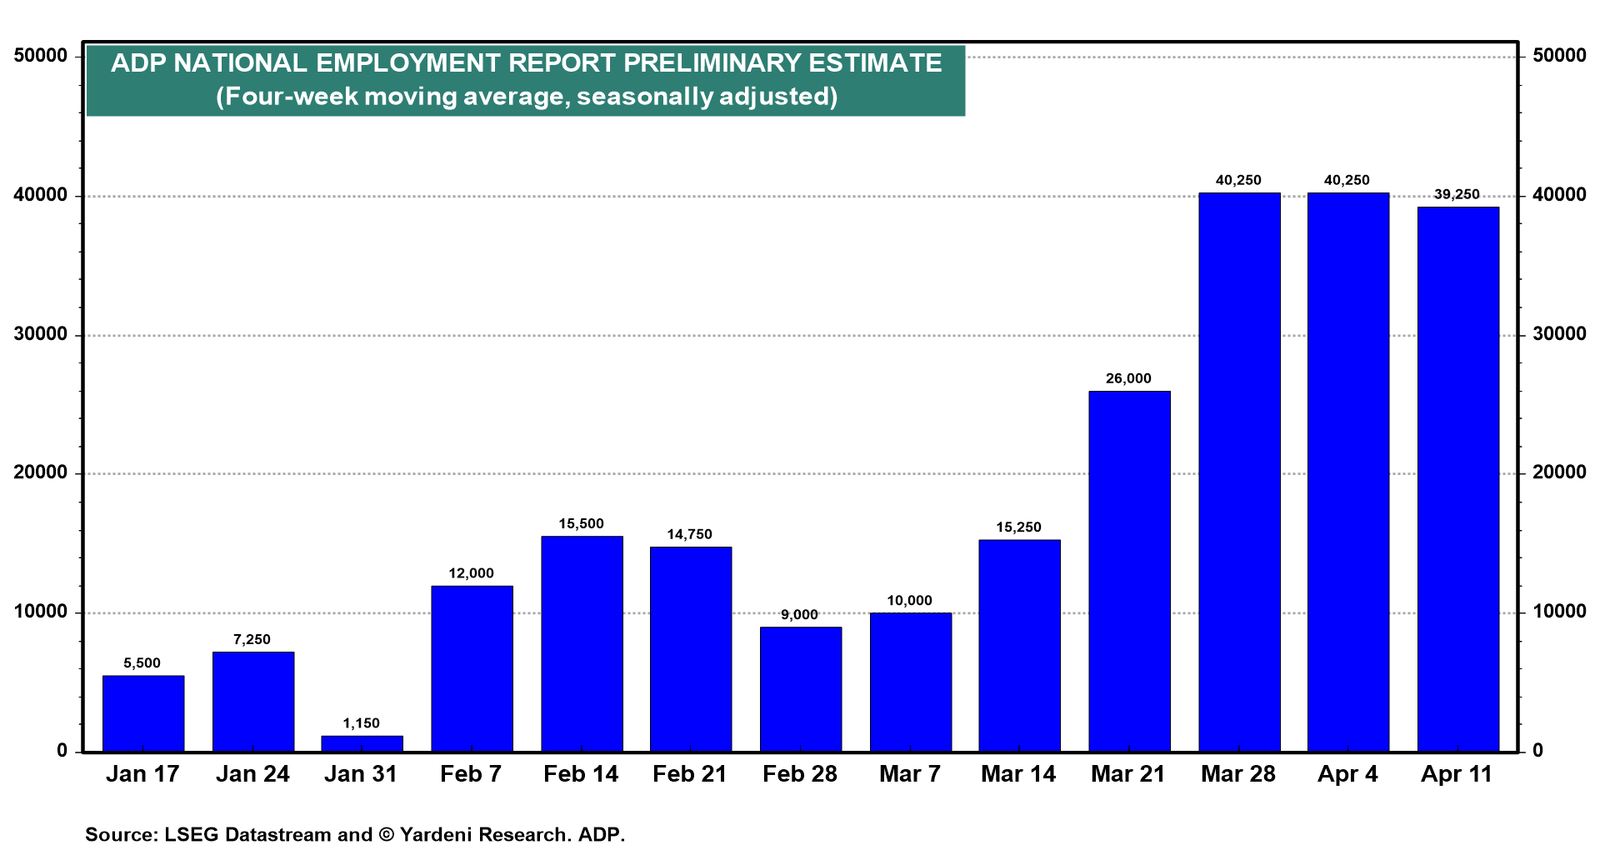
The ADP weekly employment report suggests that the monthly report (Wed) for April will show a solid increase in private industry payrolls (chart).
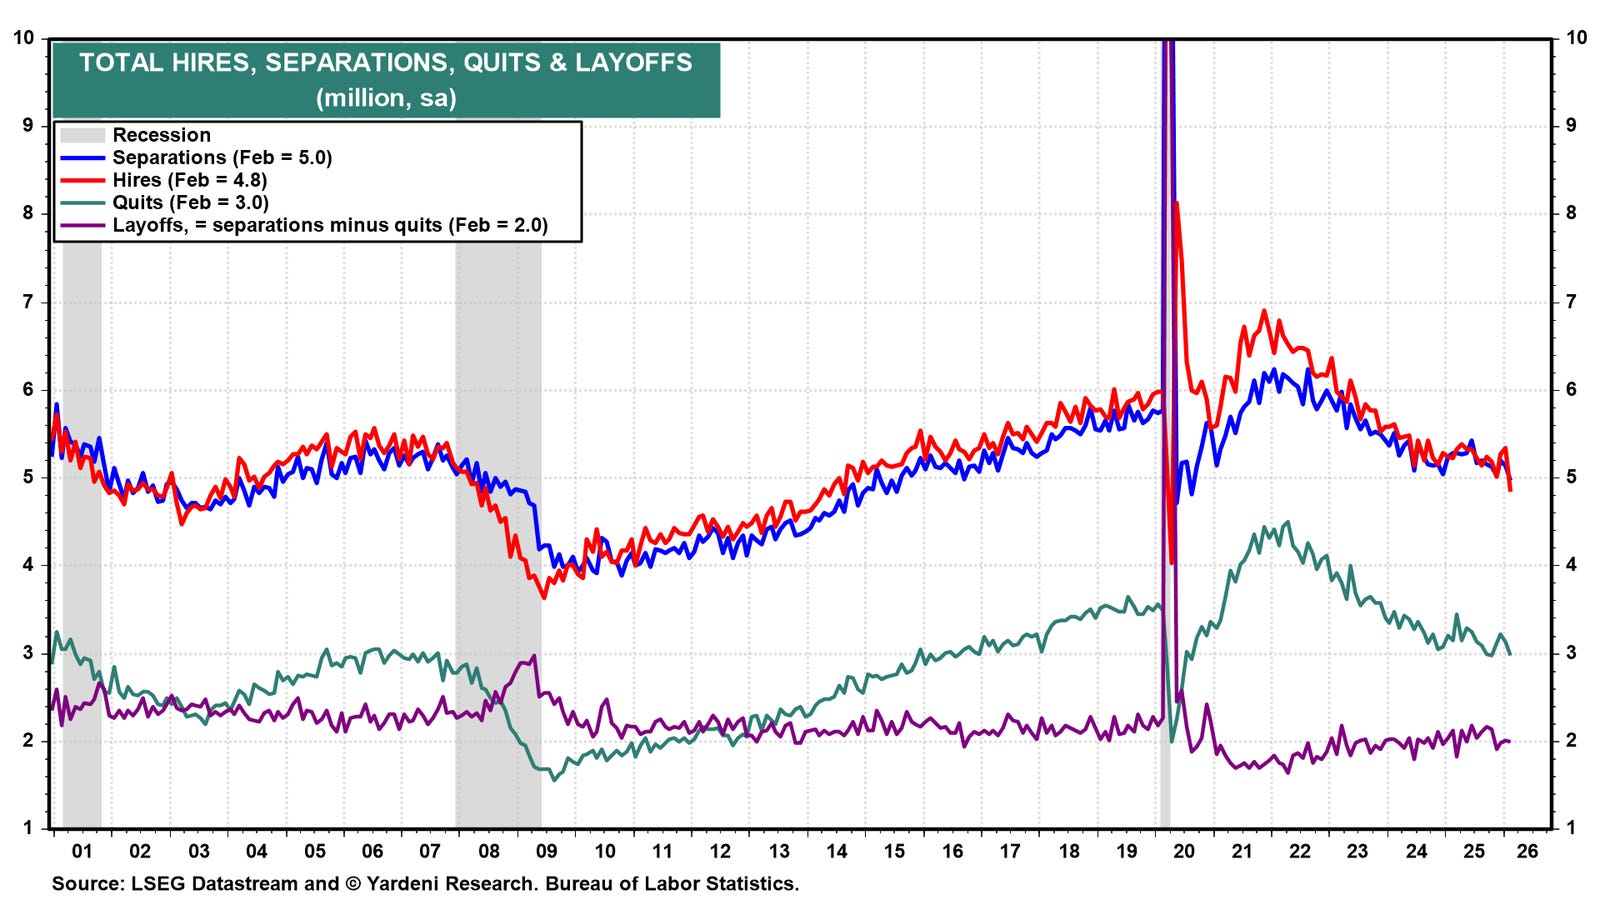
March JOLTS data (Tue) are unlikely to differ much from February’s results (chart). We do expect to see more job openings and hiring activity in April based on the recent decline in jobless claims and increase in ADP weekly payrolls.
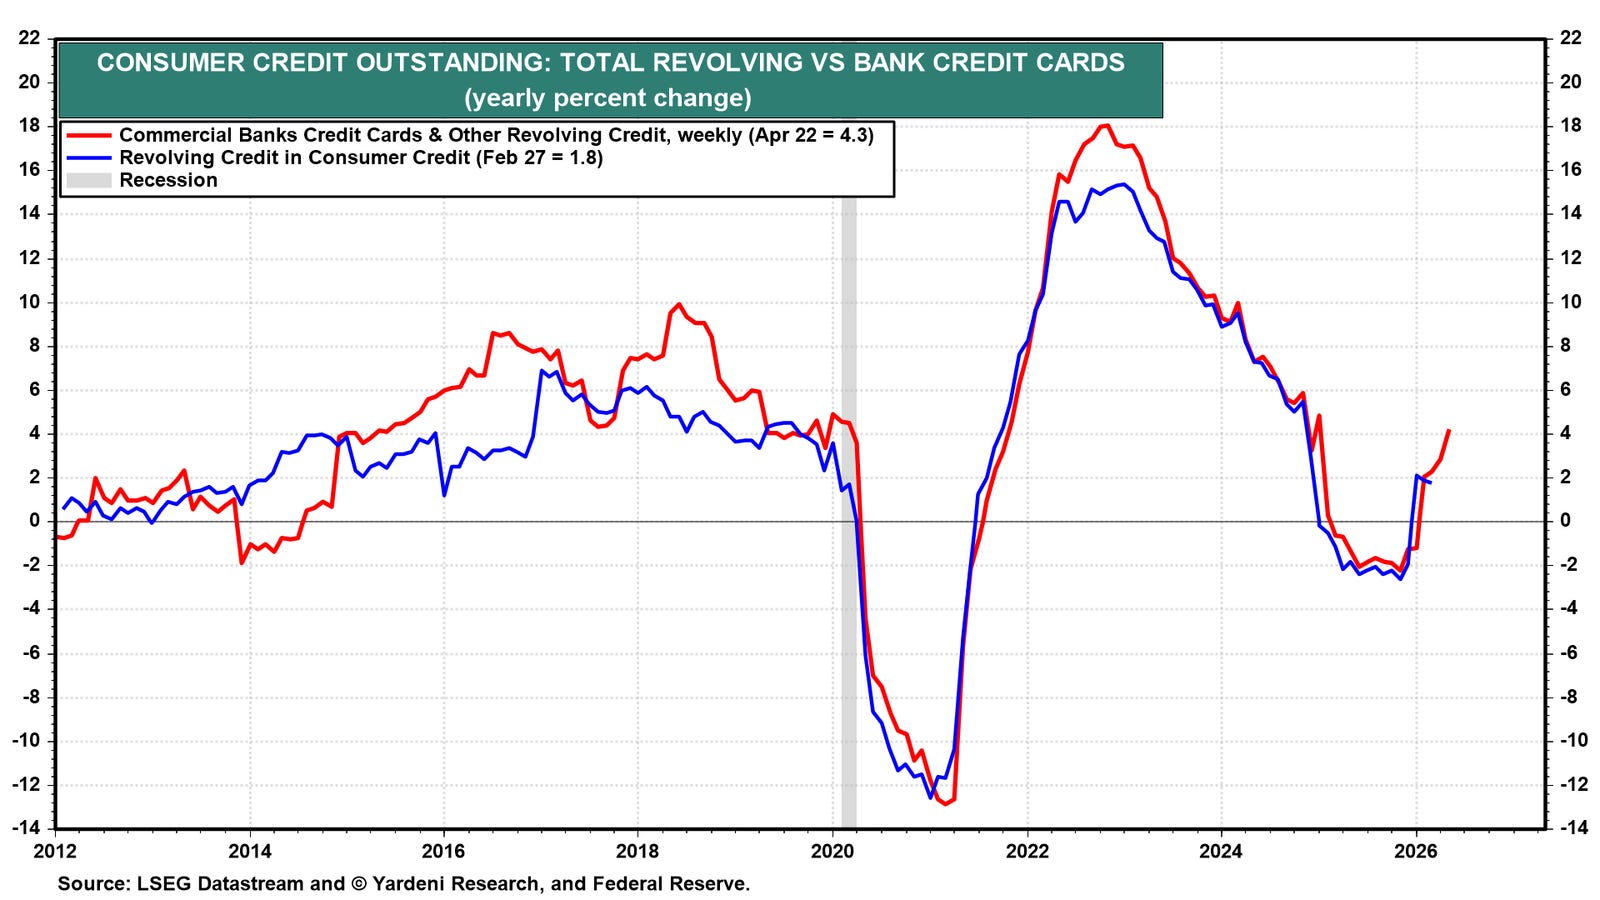
…(3) Consumer credit. March consumer credit (Thu) data are likely to show a strong increase in revolving credit, based on comparable weekly data for commercial banks (chart).
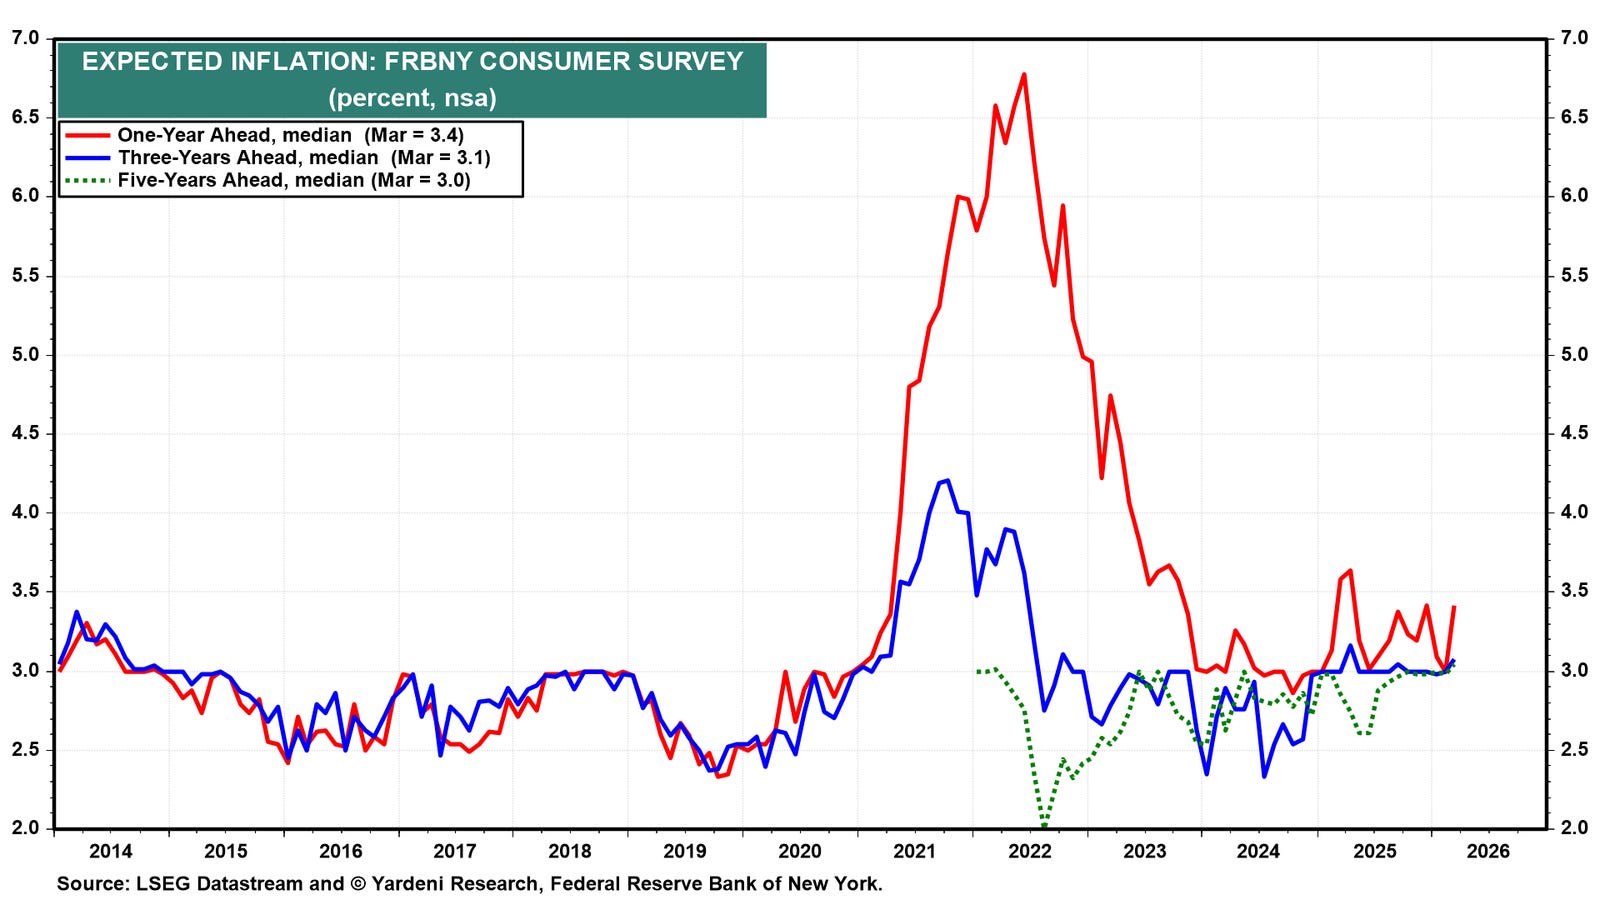
…(5) NY Fed inflation expectations. The NY Fed’s Inflation Expectations release (Thu) for April is likely to show a jump in the year-ahead measure closer to 4.0%, up from 3.4% in March (chart). That should reflect higher gasoline prices.
… Moving along TO a few other curated links from the intertubes. I HOPE you’ll find them as funTERtaining (dare I say useful) as I do … …
First up, the good Doctor SLOK said, over the weekend, AI good for jobs …
May 03, 2026 Apollo: Cheaper Booking Created More Demand for Humans
Online booking was supposed to wipe out the travel agent. It did not. Jevons paradox explains why: cheaper travel booking created more total travel demand, and some of that flowed back to human agents for complex trips, luxury travel and corporate accounts, see chart below.
The Theory: Improve efficiency \(\rightarrow \) cost goes down \(\rightarrow \) demand goes up \(\rightarrow \) total use goes up.
The Paradox: We try to save resources by being efficient, but we end up using more.
Origin: In 1865, economist William Stanley Jevons noticed that when steam engines became more efficient at using coal, factories didn’t use less coal. Instead, they built more engines, causing coal consumption to triple. [1, 2, 3]
Terminal DOT COM for a view …
May 4, 2026 at 4:00 AM UTC Bloomberg: Why Markets Think the US Is Winning the Blockade Europe, on the other hand...
…The Strait of Hormuz has now been double-blockaded — by both the US and Iran — for three weeks. There’s a “ceasefire,” in terms of no longer bombing terrestrial targets, but both sides continue to use force and threats of violence against each other while ratcheting up damage.
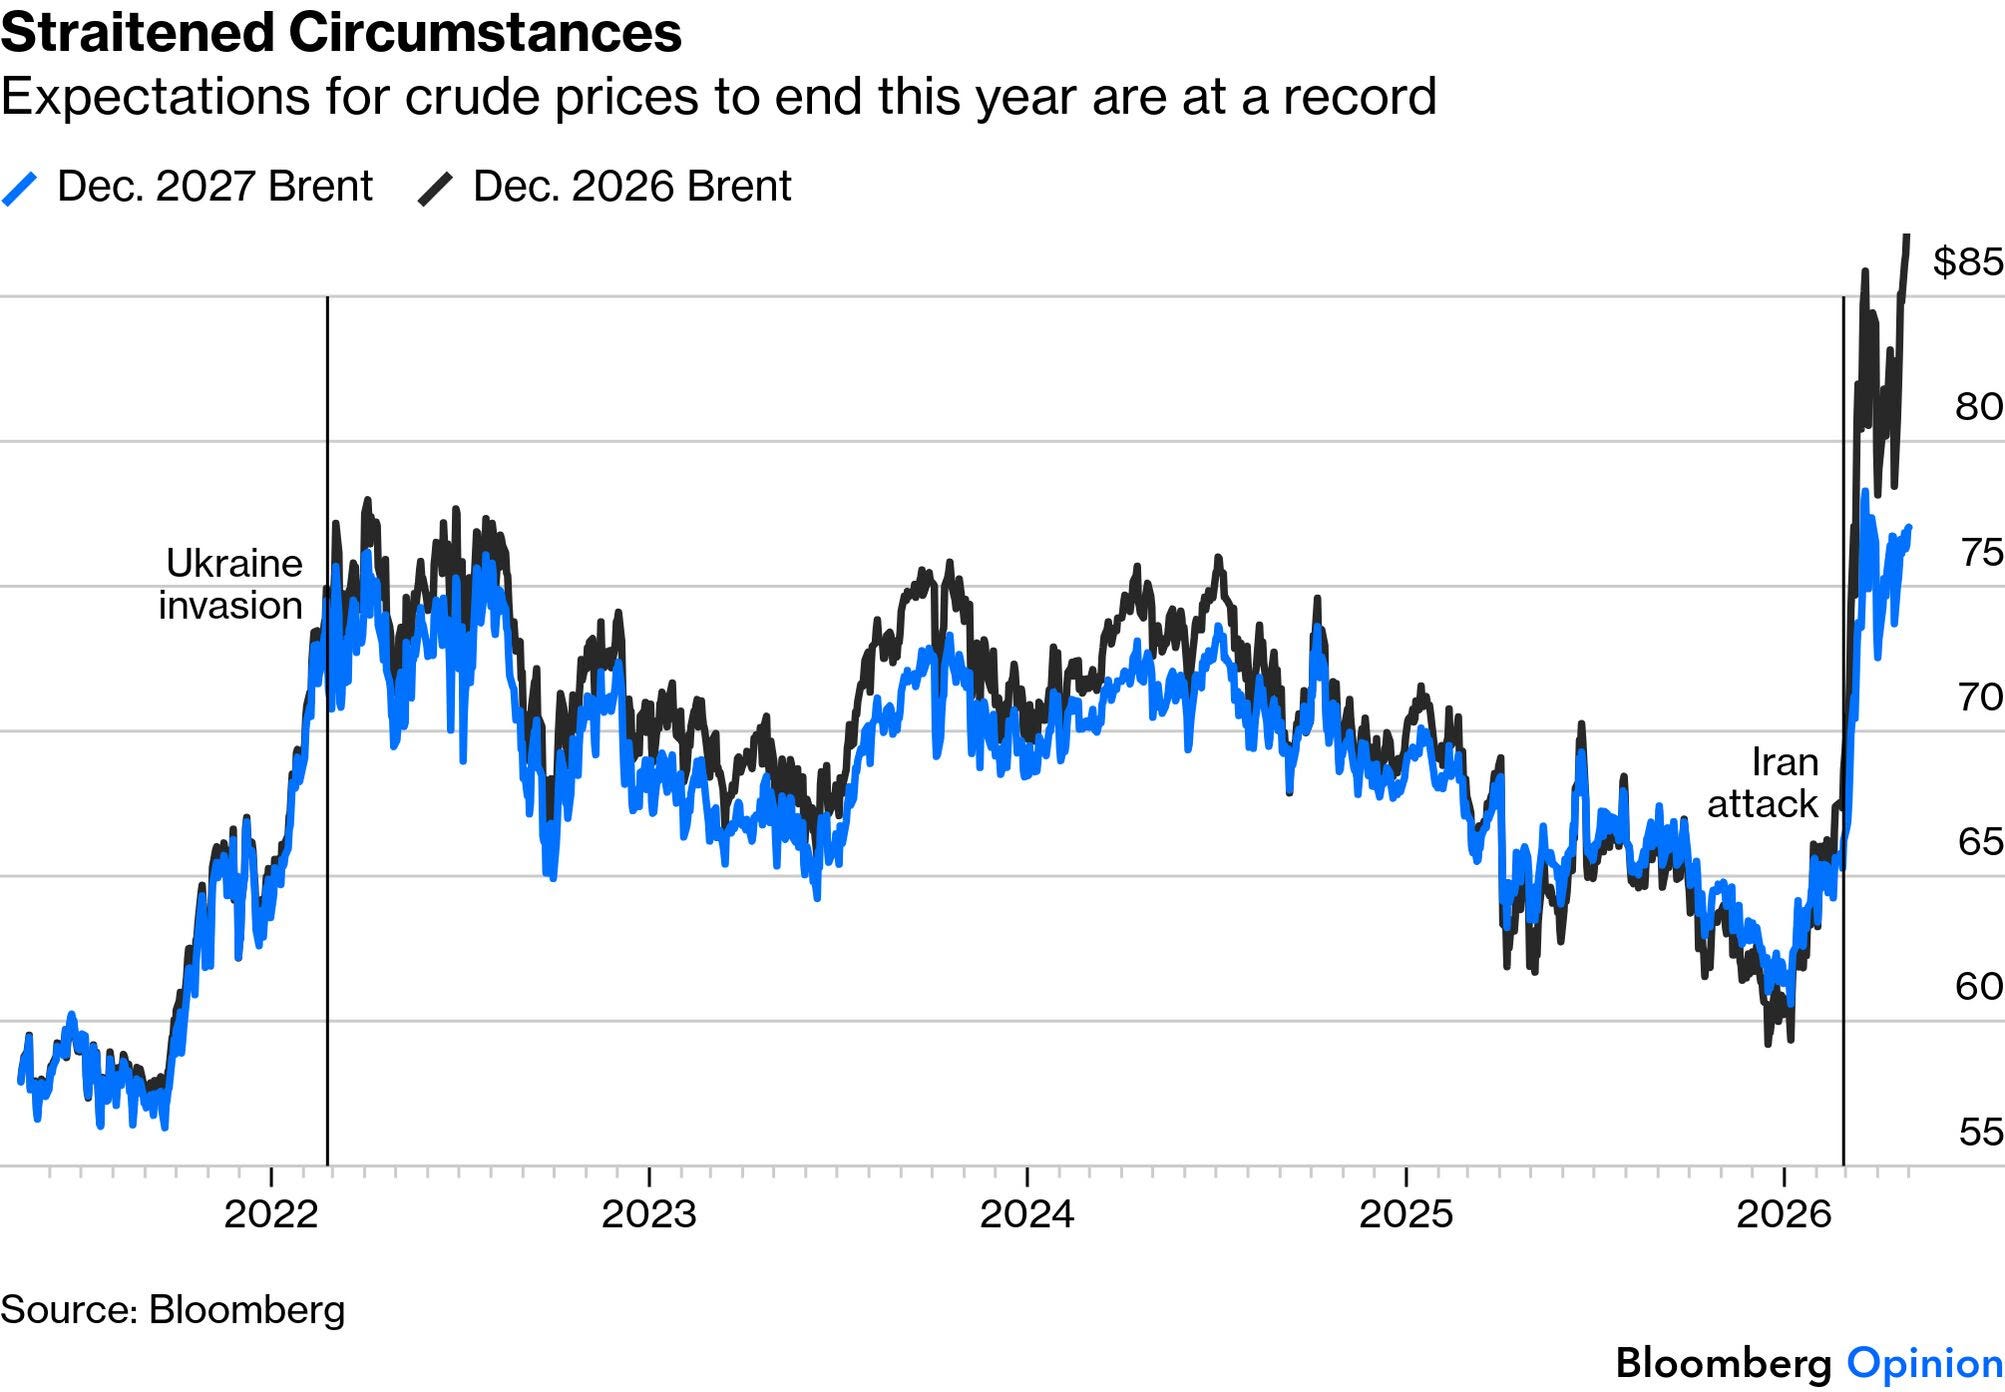
Who exactly is winning? The most obvious case is that the standoff, by throttling supplies of oil and other vital commodities through the Strait, is building up the economic pain for the US and its allies. It takes time for oil to cross oceans and reach its destination, and for well-established inventories to deplete, but markets say the effects will be tough and lasting. Brent crude for the end of this year is at a new high, while 2027 prices are also elevated:
It’s obviously not an acceptable long-term position for the US, which is now launching a new plan to help ships through Iran’s blockade. But financial markets are behaving as though the war is over. That is a critical advantage for the US. Robin Brooks of the Brookings Institution argues strongly here that the blockade is working. He breaks down the strategy into three effects on Iran: starving it of exports, forcing it to run out of storage capacity, and capital flight. The first two take time to hurt, but he suggests capital is already fleeing…
…Constant Pain
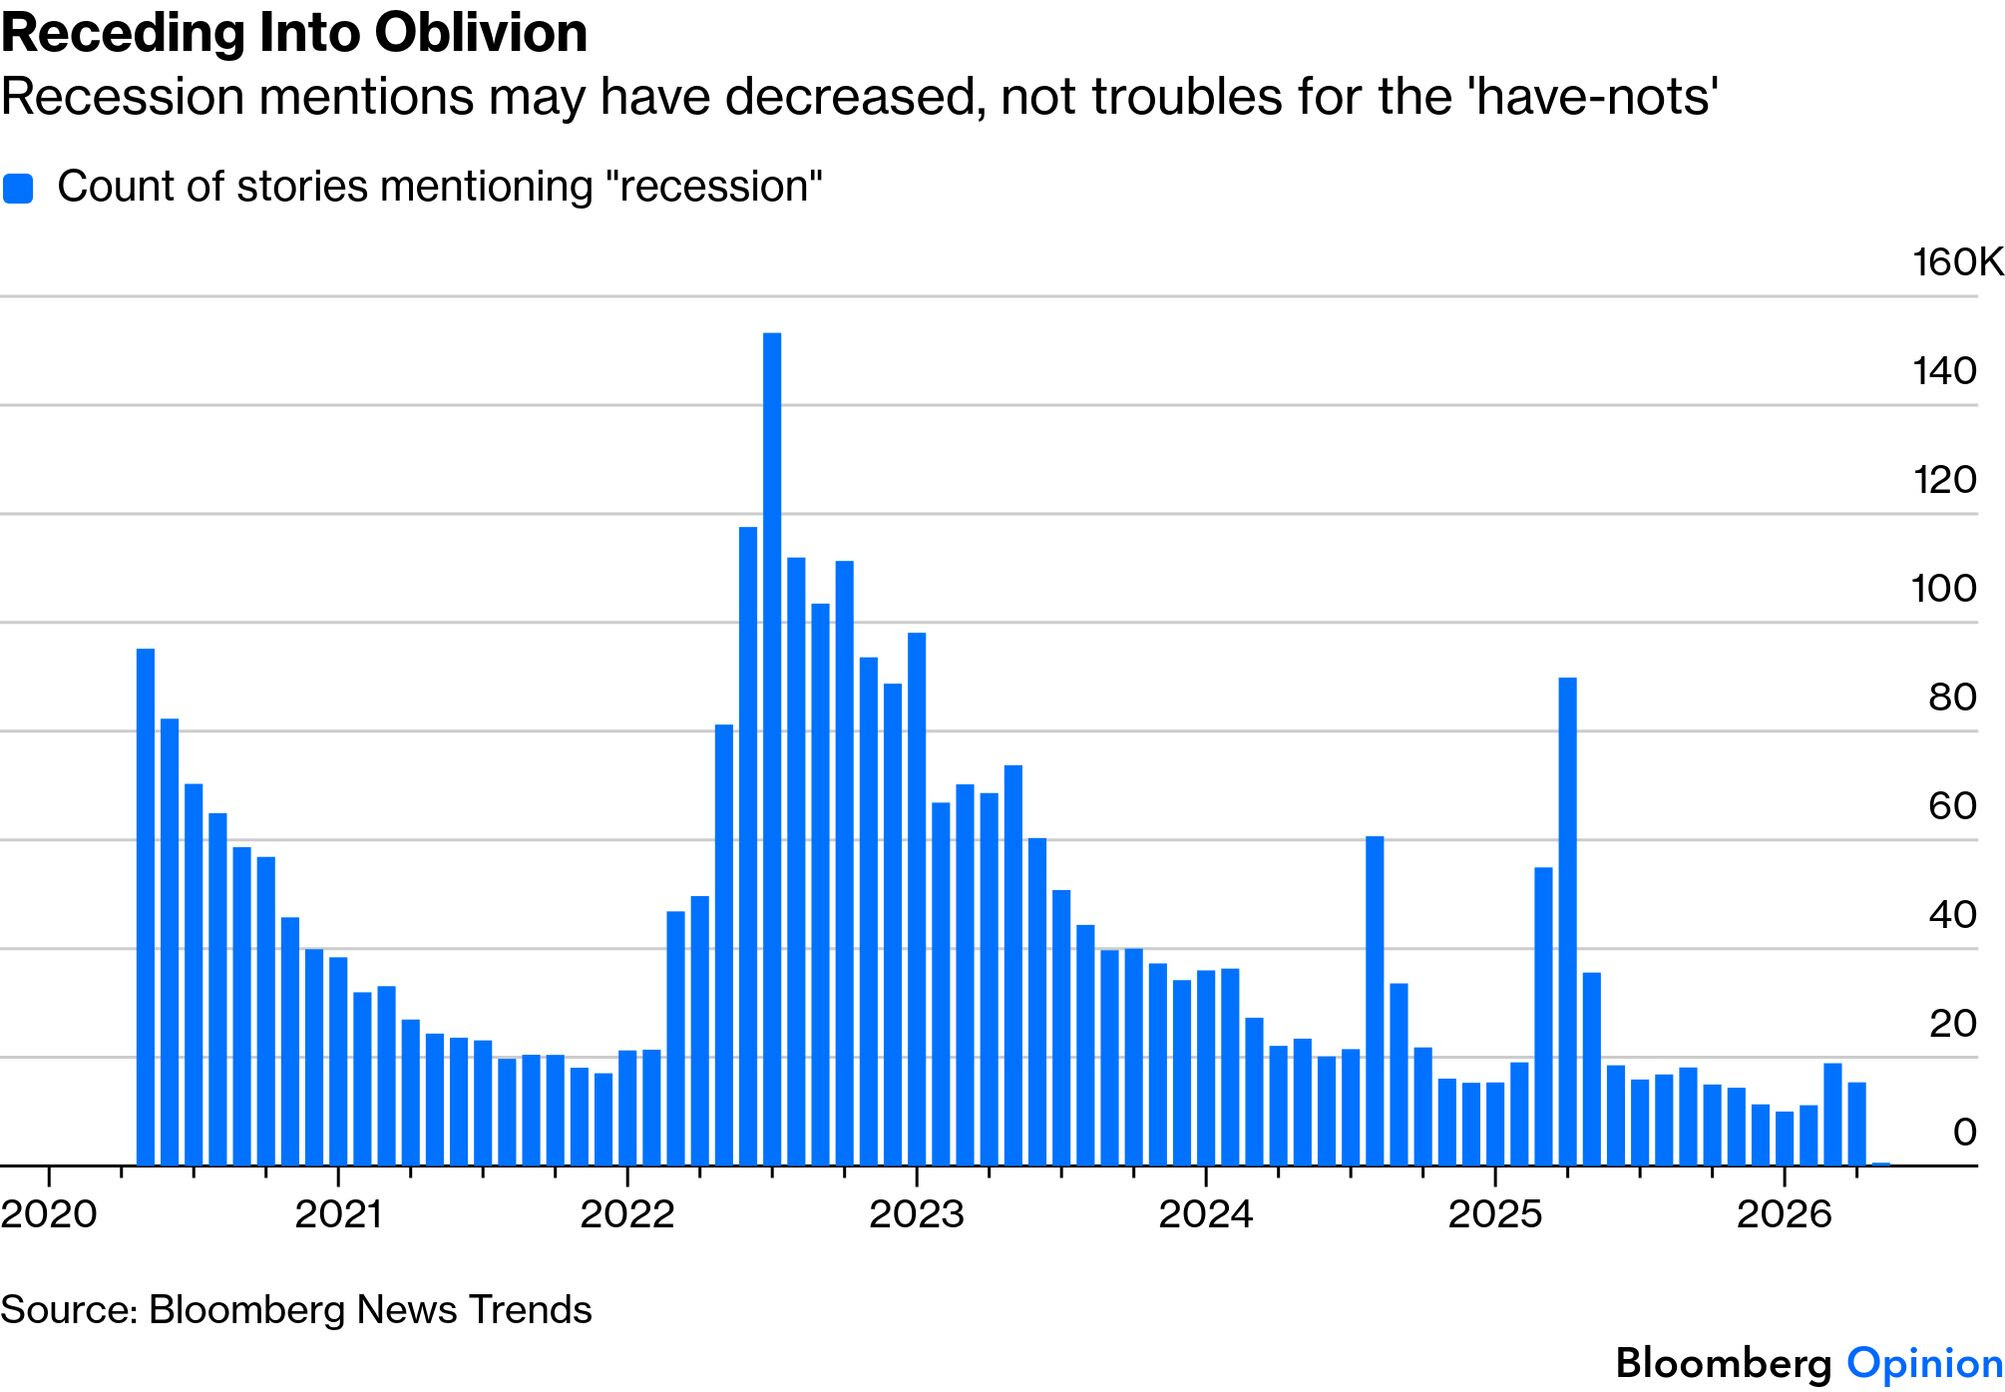
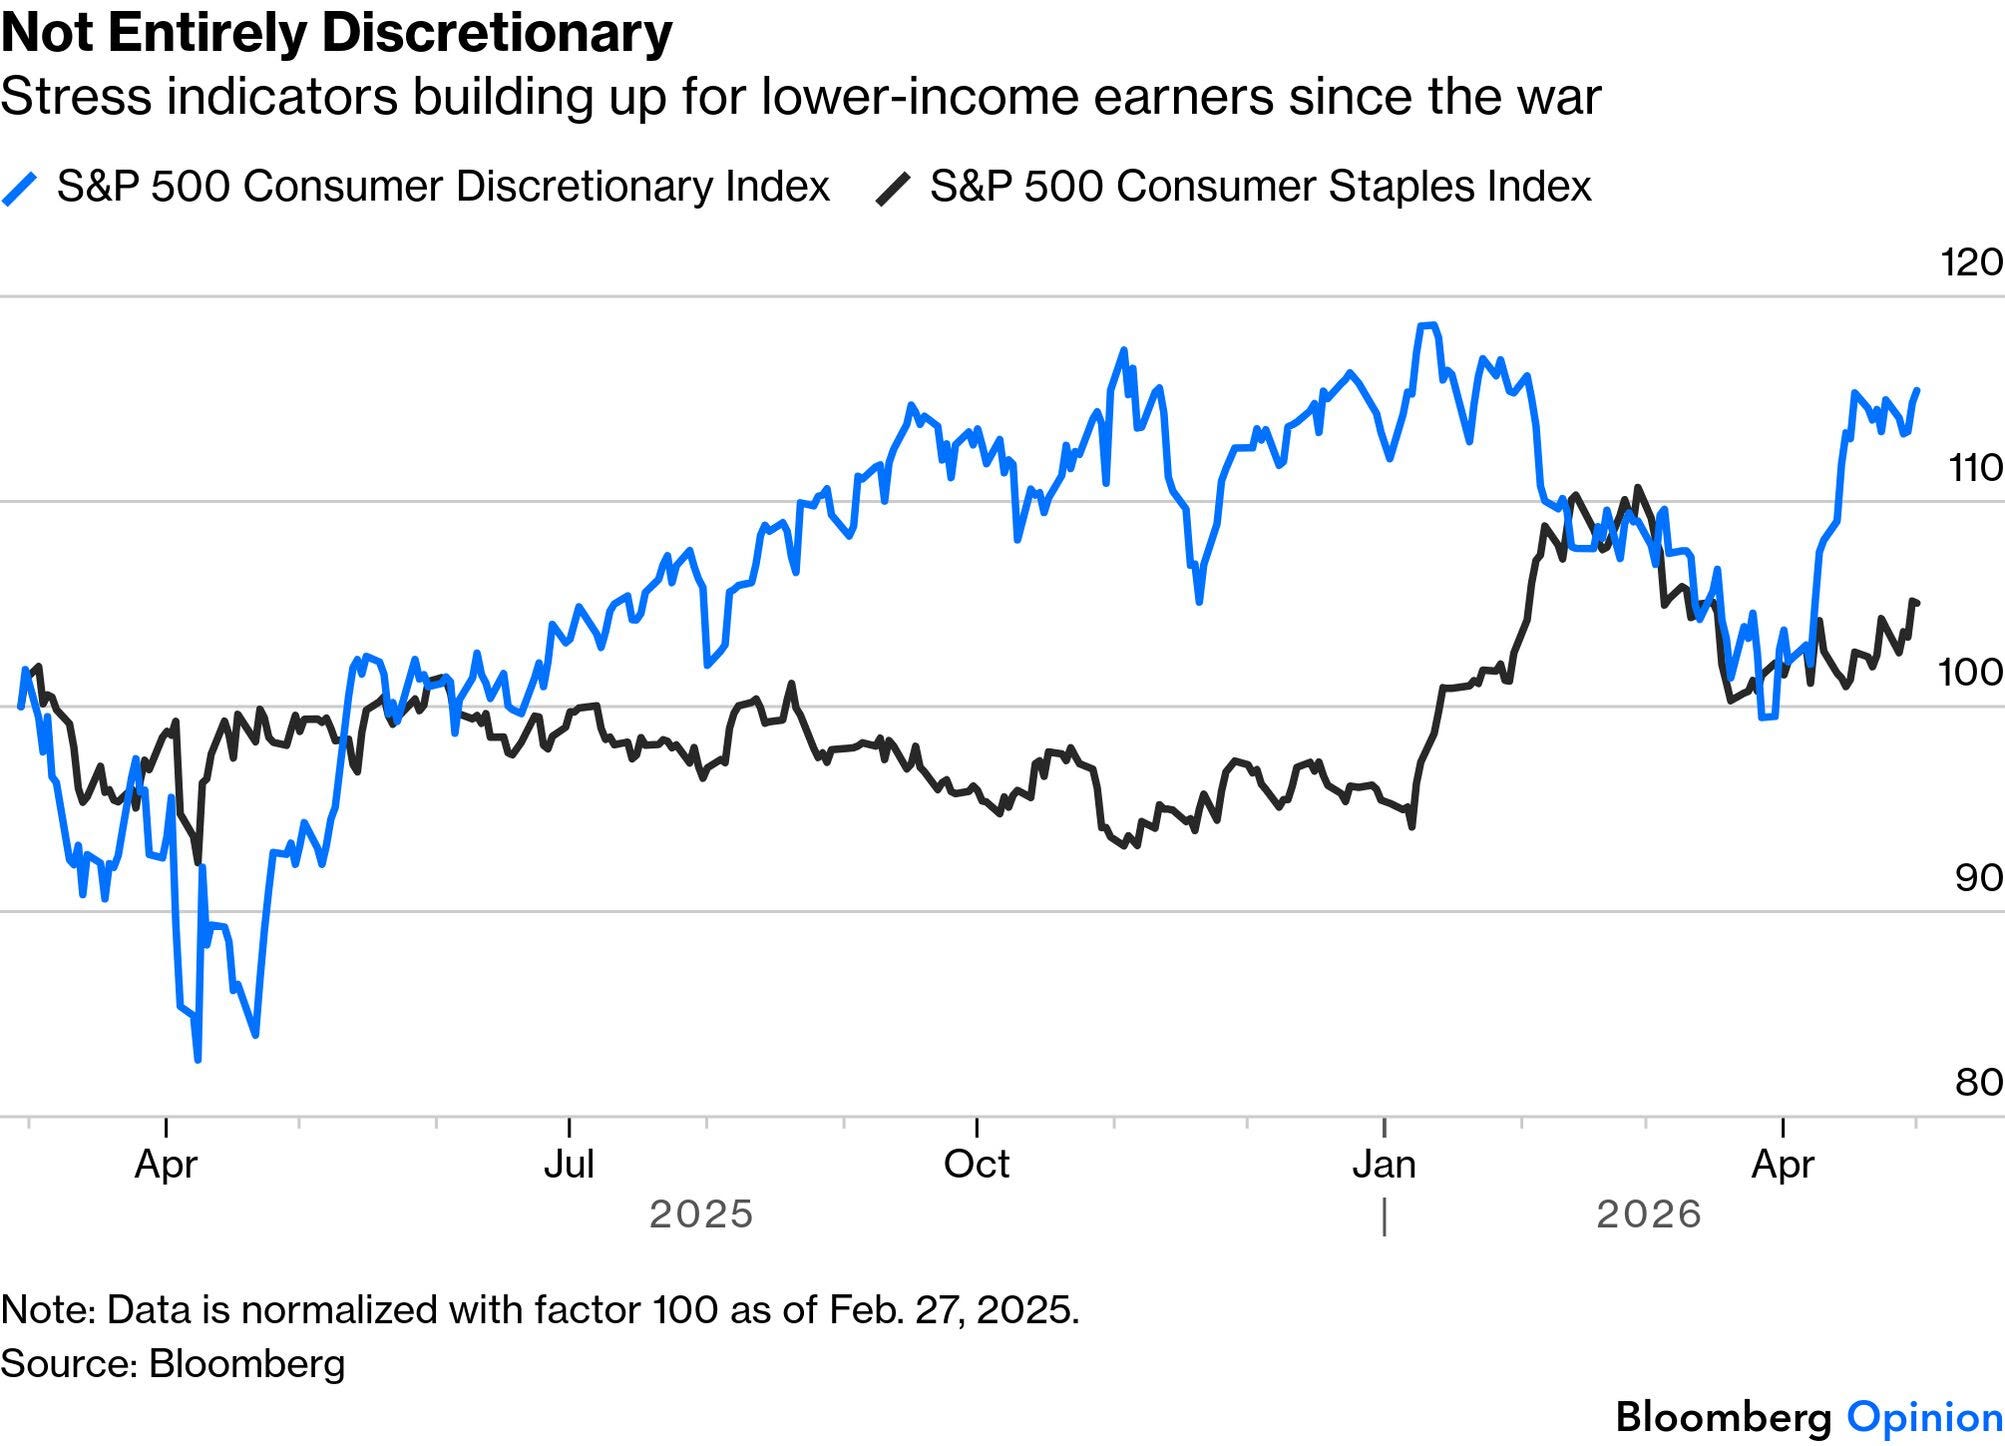
After the pandemic, as the Federal Reserve wrestled to rein in runaway inflation, the US economy flirted with recession. But somehow, it kept soaring, largely propped up by the unprecedented spending on artificial intelligence by mega caps. But while its continuing strength is an advantage for the US in its war, the recession for lower-income earners grows ever more obvious. That fueled the affordability crisis that propelled President Donald Trump back to White House. Mentions of “recession” have collapsed since their 2022 peak, but little suggests that the “have-nots” are basking in the glory of the near-perfect wartime markets:
Trump’s tariff brinkmanship and then his military campaign in Iran have threatened to reignite inflation, with gas prices at the pump now exceeding $4 a gallon. A recent rally in consumer staples shows the growing strain as consumer confidence sinks to fresh lows.
How to make sense of this? BCA Research’s chief strategist, Felix Vezina-Poirier, notes that while markets are driven by the economy, they also drive economic life through financial conditions, wealth effects, and input prices. That wealth effect is especially important in a K-shaped economy: consumption for the upper part of the K depends on capital income and wealth effects, while the lower part depends on wages.
Consumer discretionary stocks have lagged, largely thanks to their lack of tech firepower, but they’re staging a respectable rally. It looks like the “haves” remain in the game and are spending money:
The New York Fed’s Economic Heterogeneity Indicators show retail spending driven by high-income households earning more than $125,000 per year. To quote the bank’s researchers, “reliance on a single segment of the economy has important implications for spending growth and its fragility, as well as for economic vulnerability and policy.”
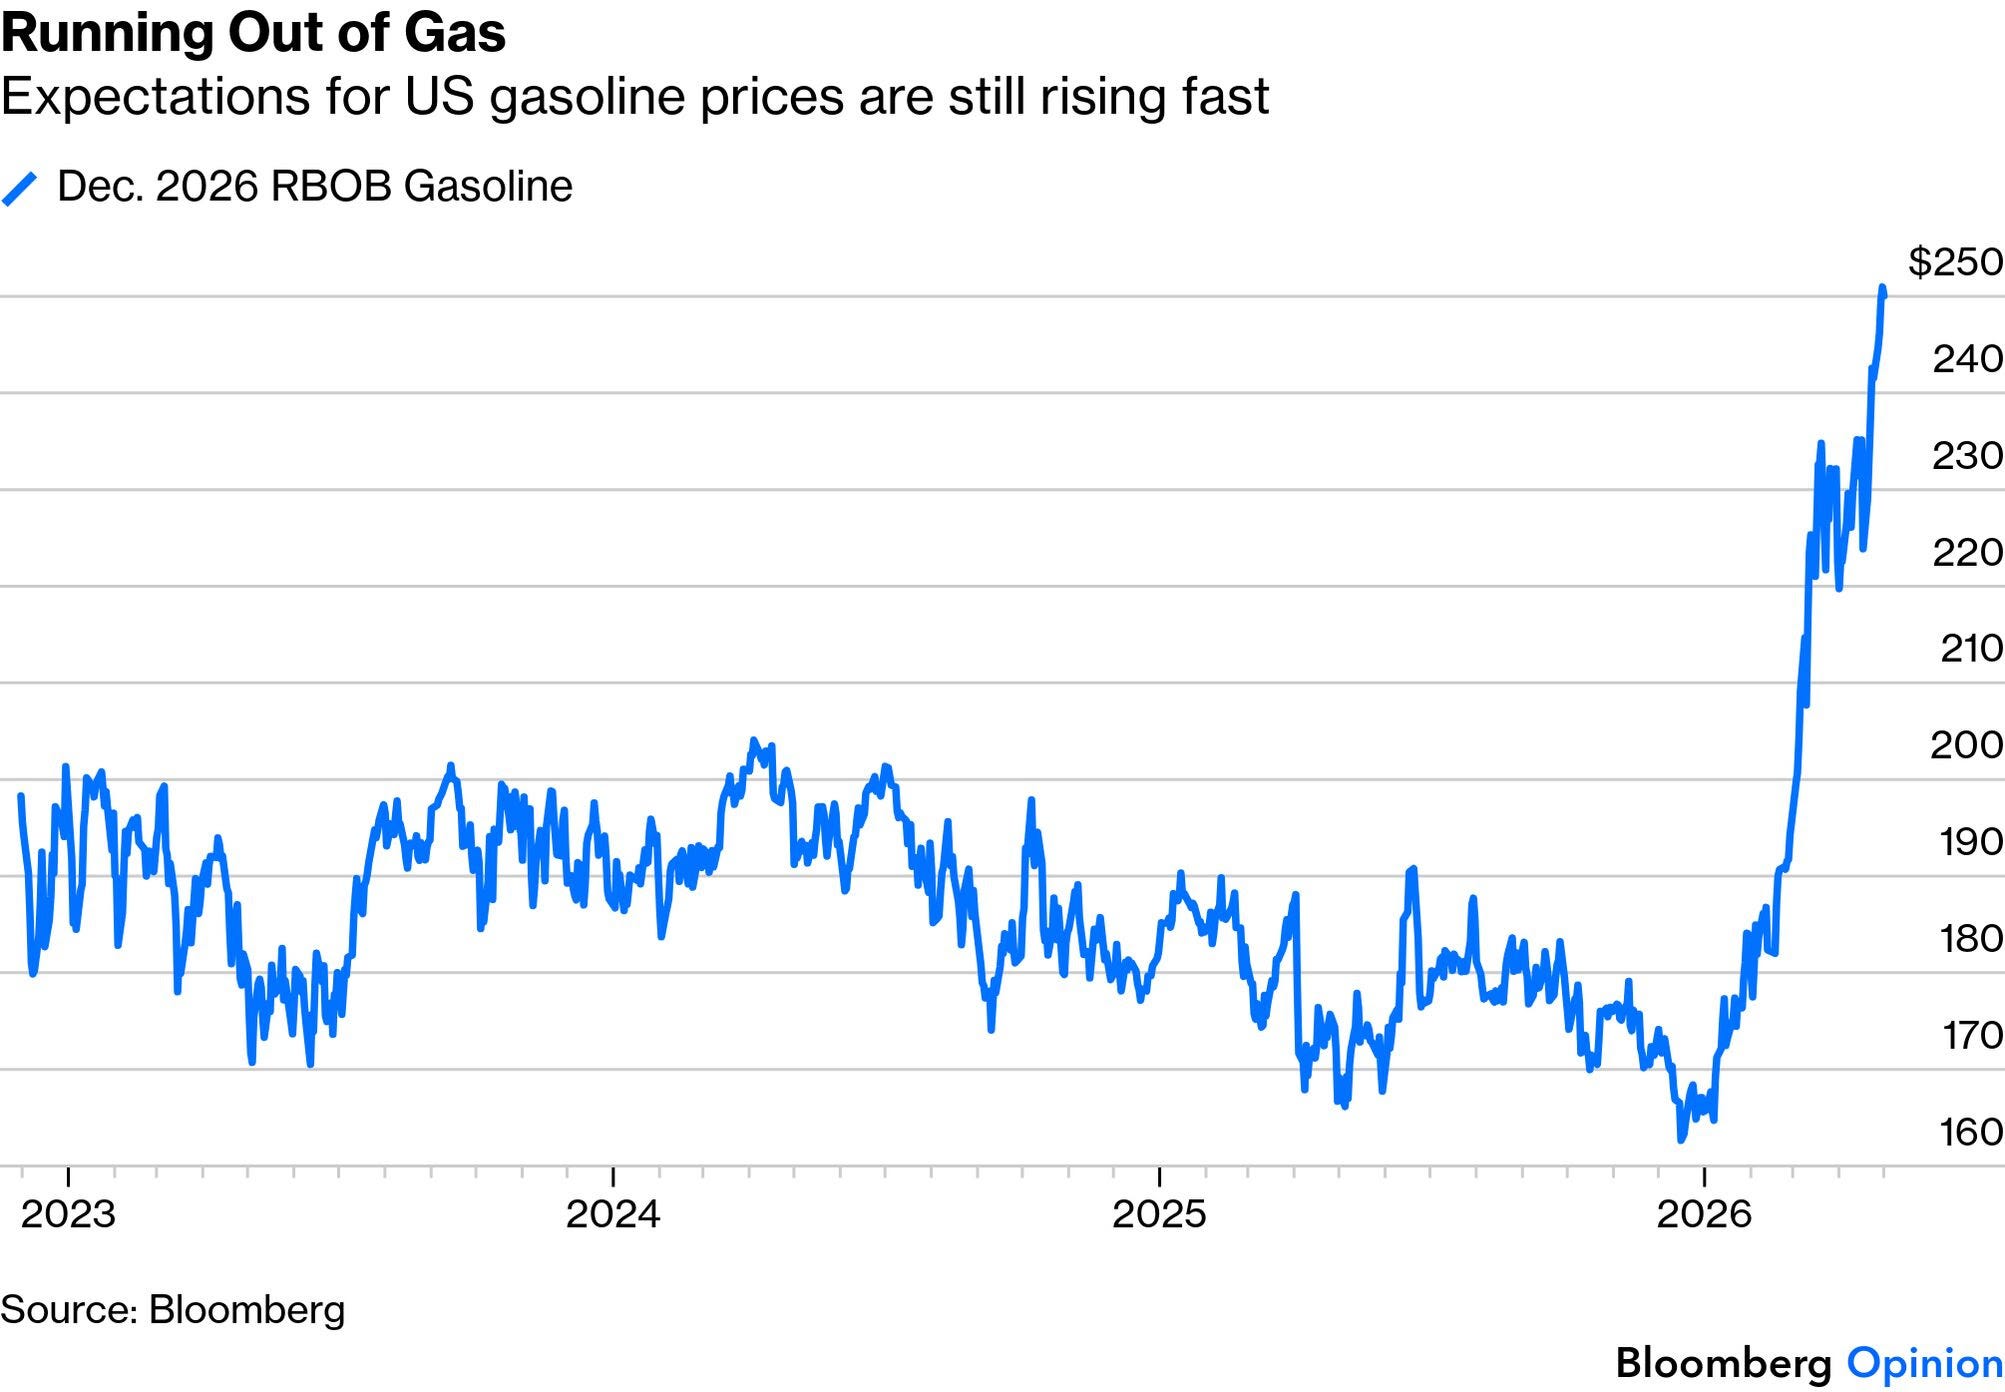
How long can lower-income households hold out? The temporary boost to incomes from tax refunds is fading now that tax day has passed. Sam Tombs of Pantheon Macro sees this leaving households increasingly exposed to surging gas prices.
He estimates that oil prices would translate into a roughly 1% quarter-on-quarter, annualized decline in real after-tax income in the second quarter. At the same time, the savings rate is already low at 3.9%, so people have limited capacity to absorb this shock. Futures are pricing ever more expensive gasoline at the end of this year:
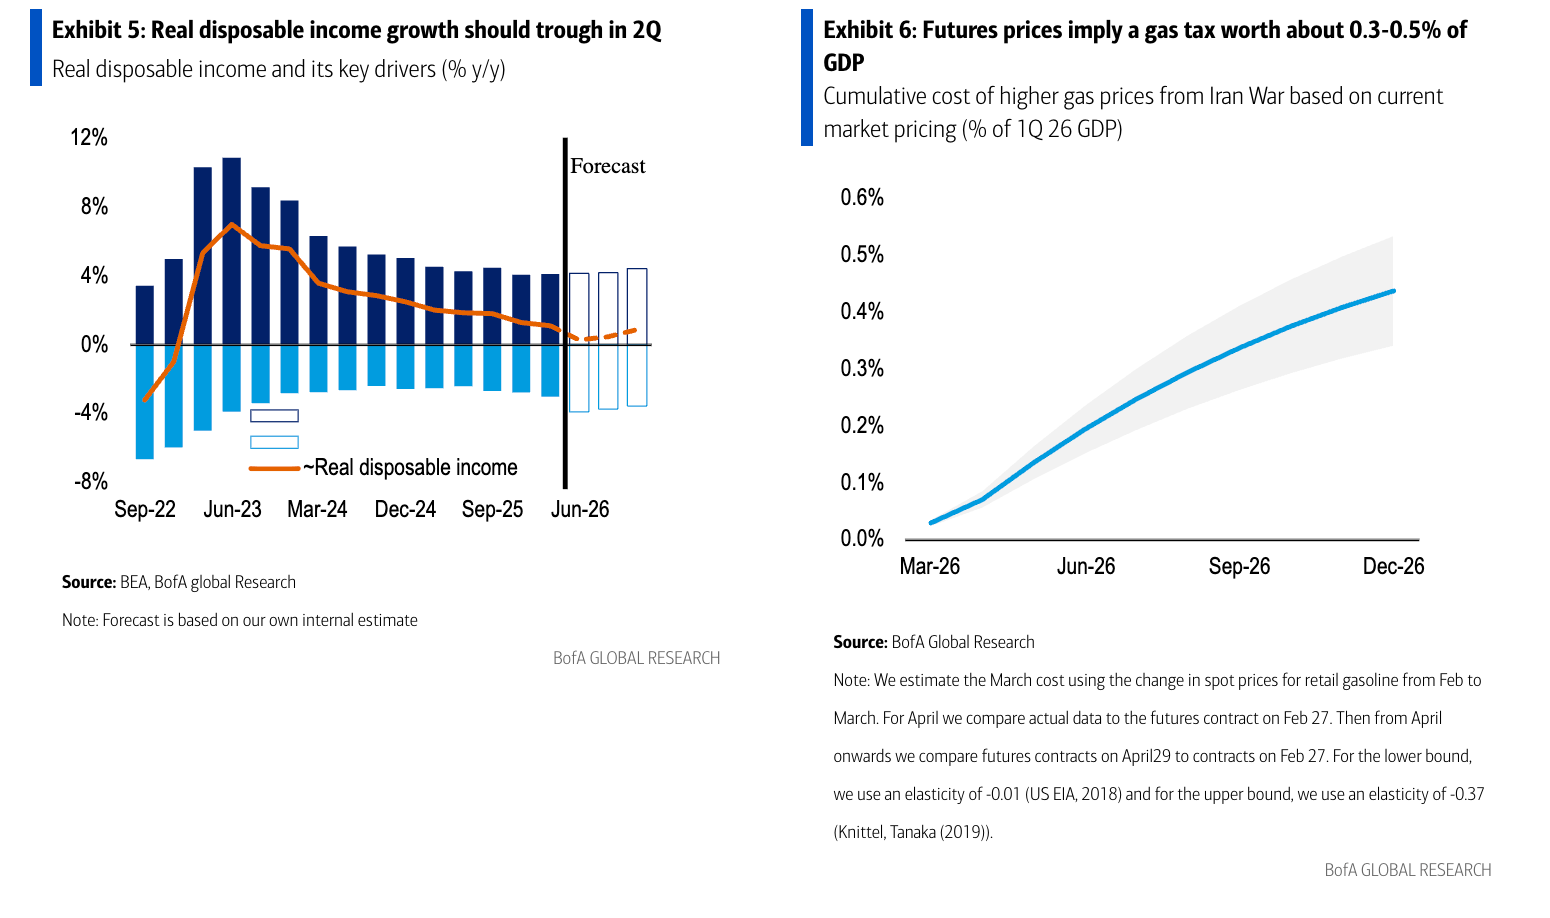
Confidence that the consumer and the broader economy can weather the energy shock rests on the assumption that oil prices don’t push up much further. Aditya Bhave of Bank of America notes that higher gas prices have already eroded nearly half of the income boost from tax refunds; to gauge the road ahead, he compares current wholesale gasoline futures with levels observed on Feb. 27, before the war, to estimate the additional burden on households:
We estimate the full-year “gas tax” to be around 0.5% of GDP. That is about equal to the boost we estimate from the One Big Beautiful Bill or AI capex. This drag could be much higher as we only focus on gasoline, and the energy shock should drive up the costs of other goods and services.
Futures may be unduly pessimistic. But if the shock is more persistent, then growth in disposable income could go negative, as the chart shows:
For now, the mega-caps’ capex is masking the disparity between the haves and have-nots.
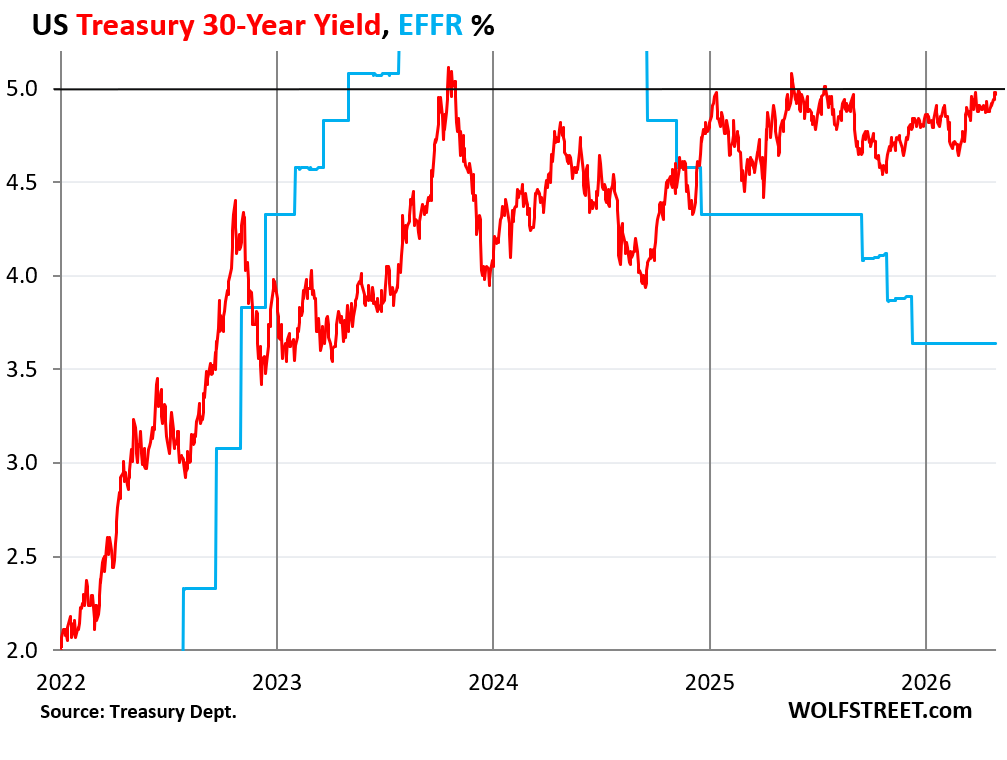
Finally, as Uncle Scott sold USTs last week, a few visuals of the yields meeting inflation …
May 3, 2026 WolfST: The US Government sold $723 billion of Treasury Securities this Week. Inflation Jumped and Met T-bill Yields - 30-year Treasury yield looks like it’s setting up to break out past 5%. A rate cut while inflation is heating up could do it.
…The 30-year Treasury yield had gone over 5% briefly on Thursday morning following the inflation data and on Friday settled at 4.97%. It has gone over 5% several times briefly since October 2023. And the fluctuations back down have been getting smaller and smaller.
It looks like the yield wants to break out to the upside past the 5% line. A rate cut while inflation is heating up all over the place could do it. If the bond market thinks that the next Fed, under chair Warsh, will “look through” inflation and let inflation ride, on the hopes that future efficiencies from AI or whatever will knock it back down someday, it could light a fire under long-term yields.