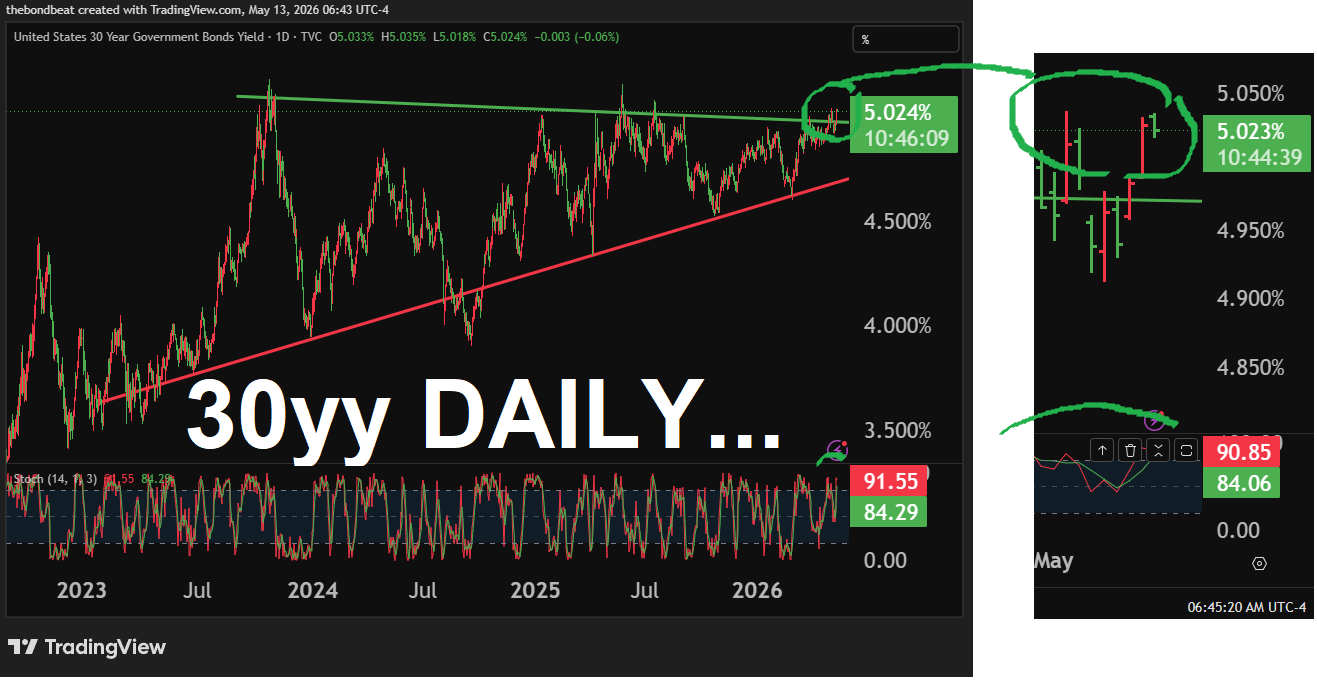
while WE slept: USTs stable (just off yest lows); #GotBONDS? "...Holdouts against the tide - the case for Fed cuts..." (RTRS on Citi and MUFG, aka 'the holdouts')
Bonds. Jay BONDS. No time for puts … STILL continuing to get through inbox and reacclimate to NOT road-trippin’ AND having one less of the ‘Things’ at home. Thoughts still feel very disjointed and yesterday’s point of data / ray of light serve only to muddy the waters a bit.
Feeling strongest that as Global Wall jacks UP equity price targets and push OUT rate CUTS (or romance idea of hikes) it becomes easier to ‘fade’.
#DipOrTunity feels like the right word and I apologize for overuse …
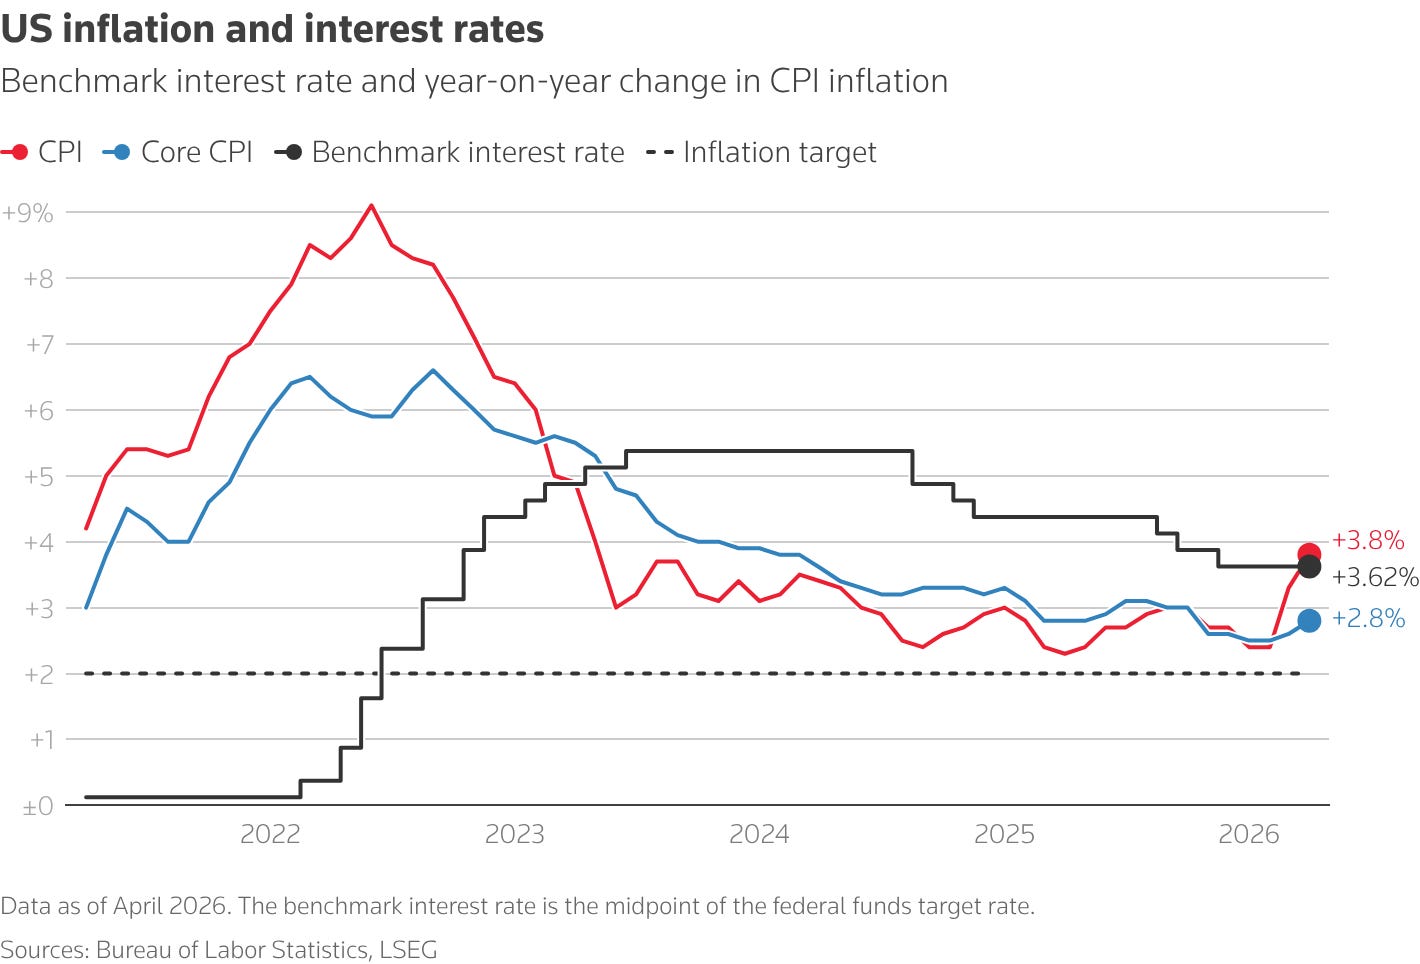
HOT CPI (more in a min and from Global Wall below) sparked sell-off in rates complex and that makes some amount of common sense…hey, we’ve got inflation > FF and well above ‘target’ (RTRS graphic below). We’ve got negative REAL earnings YET spending appears to remain robust?There are lots of crosscurrents to consider and one of the more relevant / better question is IF this is THE (or a) #DipOrTunity ahead of the month’s last bout of long bonds …
It has only been higher for a handful of days in the last 19 years. And it is now just 8 basis points from a new 19-year high.
#DipOrTunity? … let us HOPE (not a strategy, noted HERE) as most all of Global Wall has recently jacked UP year end equity targets … Crazy as it may / may not be AND despite / because of yesterday’s less than optimal 10yr auction …
ZH: Dismal, Tailing 10Y Auction Sees Lowest Foreign Demand Since Jan 2025 As Yields Soar
… Again, data clearly set the tone for the mess …
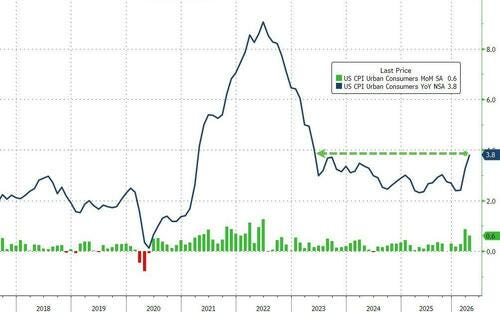
ZH: US Consumer Prices Are Rising At Their Fastest Pace In 3 Years
Headline CPI rose 0.6% MoM (as expected), pulling headline up 3.8% YoY (hotter than the 3.7% expected) and the hottest since May 2023...
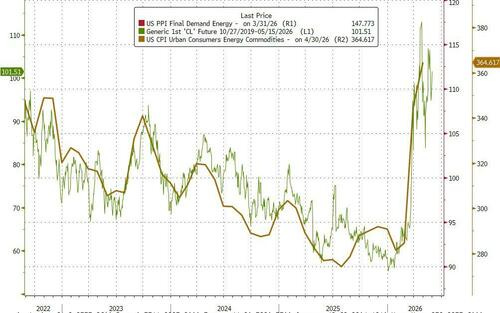
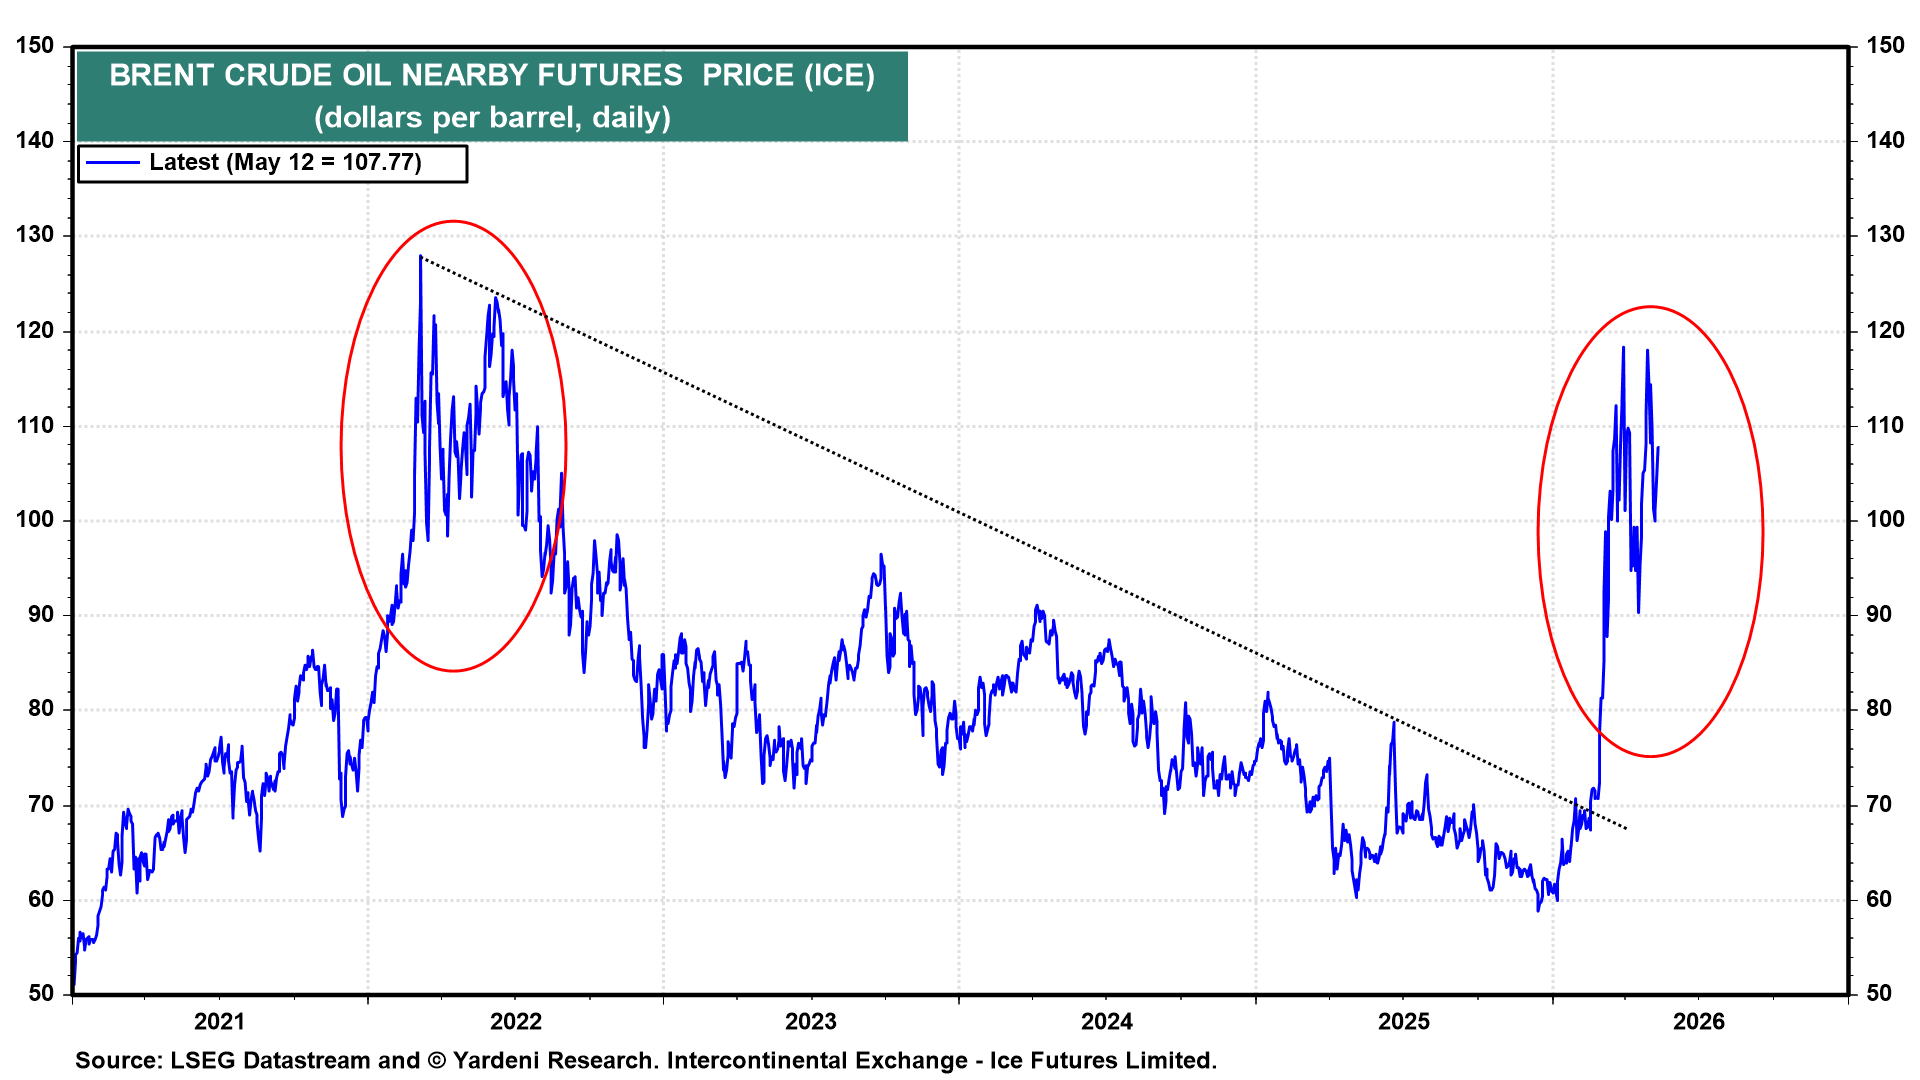
…But, the surge in the Energy subcomponent of CPI is perhaps peaking as oil has stabilized/eased.
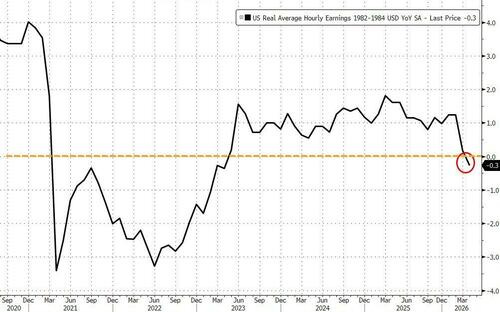
… Perhaps most notably, Real Wages are shrinking on a YoY basis (for the first time since April 2023)...
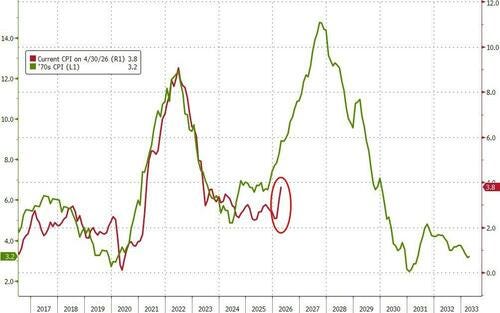
Finally, are we really ready for a 70s-style rebound in inflation?
… sorry, but I just can’t find better best combo of data, BBG visuals and snark. Well, maybe this …
WolfST: CPI Inflation Blows Past Fed Rates as Core Services, Gasoline, Electricity, and Food Spike. Fed’s “Real” Rates Are now Negative - The Bureau of Labor Statistics finally corrected part of the CPI distortions in September, October, and November.
… More from Global Wall below … but for now, things summarized in a single Reuters graphic …
Reuters: Locked in a stalemate with Iran, Trump heads to China
…The growing economic toll of the Middle East conflict has started to weigh on markets, following Tuesday’s hotter-than-expected U.S. inflation data.
Graphics are produced by Reuters..
… OFFSET to what would appear to be case for hikes? Sure, we’ve got that …
May 13, 2026 Robin J Brooks: Is US inflation picking up? There’s NO sign underlying inflation is picking up despite yesterday’s “hot” CPI
…I should clarify upfront that I’m an inflation “dove.” It feels to me like we’re on the cusp of a major automation wave in white-collar jobs that are heavily administrative and repetitive. There’ll be lots of people chasing far fewer jobs in coming years, which will put downward pressure on wages. I just can’t see how - with that as a backdrop - underlying inflation has room to pick up, even with everything that’s going on now…
Bonds Smell Smoke, Stocks Smell AI, and the Fed Smells Trouble
Treasuries got clubbed after a hot CPI print, sticky $100+ oil, and Trump boarding Air Force One for Beijing with Jensen Huang like he’s assembling the Avengers of semiconductor diplomacy. The 10-year blew out toward 4.46%, 30-years flirted with 5%, and 2-years jumped as traders quietly replaced “rate cuts” with “uh… hikes?” Oil stayed north of $100 as the Persian Gulf circus rolls on, while Nasdaq futures stabilized on hopes Trump-China talks thaw the AI chip freeze…
…Today’s market felt like 2022 wearing an NVIDIA hoodie: inflation on fire, bonds panicking, and stocks pretending AI can refinance your mortgage.
… not bad, dare I say, getting incrementally better? Learning and soon to fully replace me :) …
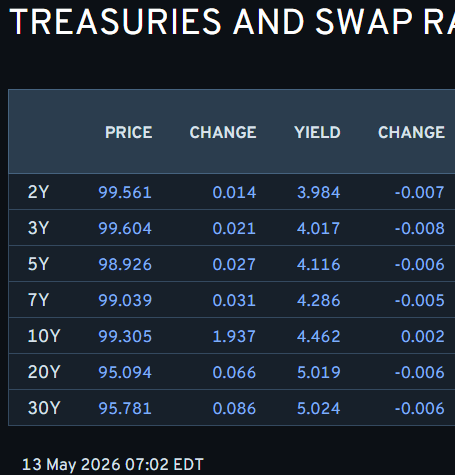
Onwards and upwards TO the reason many / most of you are likely here … whatever it may be on Global Wall’s mind but first … here is a snapshot OF USTs as of 702a:
… for somewhat MORE of the news you might be able to use … a few curated links for your dining and dancing pleasure …
NEWSQUAWK US Market Open: Equities broadly in the green with US/China summit looming; GBP continues lower as domestic politics dominates … Global fixed benchmarks are flat/incrementally firmer, Gilts find reprieve after recent pressure … USTs are firmer by a couple of ticks and currently trade within a narrow 109-31+ to 110-04 range, but ultimately residing near the prior day’s trough at 110-01. As a reminder, US paper was pressured on Tuesday amidst higher energy prices and after a hotter-than-expected US CPI report, which has led markets to reprice hawkishly. Most recently, UBS pushed back its call for a cut at the Fed to December 2026 and March 2027 (prev. forecast cuts in September and December). Focus today will be on US PPI and a flurry of Fed speakers.
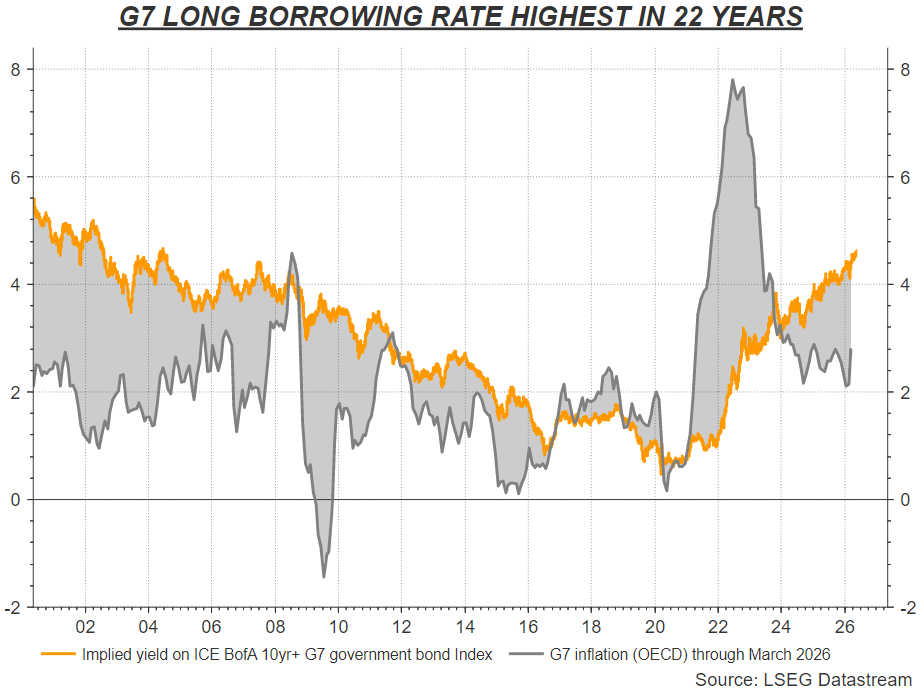
The relentless rise in long-term government borrowing costs shows no sign of abating, and the list of aggravators is growing by the day. If you’ve been in thrall to gravity-defying stock markets this year, look no further to see where stress is building in world markets.
Debt, oil, inflation and interest-rate risks are combining with domestic political and geopolitical uncertainty, and with ebbing official and private-sector demand for long bonds, to push borrowing costs in the Group of Seven (G7) advanced economies on aggregate to the highest in more than 20 years.
Graphics are produced by Reuters.
…Today’s key chart
Graphics are produced by Reuters.
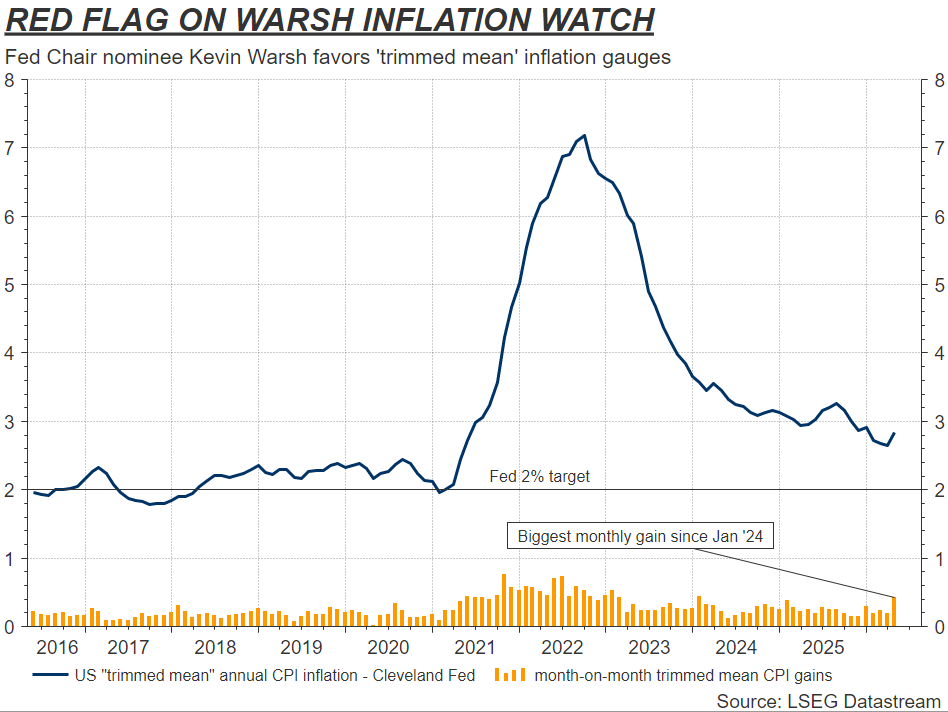
U.S. consumer inflation jumped again in April, with the annual rate posting its largest gain in three years. Incoming Fed Chair Kevin Warsh says he favors looking at “trimmed mean” inflation cuts that strip out the more extreme price moves each month. But the Cleveland Fed’s “trimmed mean” CPI for April also showed its biggest monthly gain since January 2024, with the annual rate rising to 2.8%.
…Holdouts against the tide - the case for Fed cuts The U.S. interest rate outlook has turned decidedly hawkish since the Iran war started, completely wiping out market expectations for Federal Reserve cuts this year. But not everyone has thrown in the towel.
Before the conflict began on February 28, rates futures markets were pricing in around 50 basis points of easing by year end, partly because President Donald Trump’s nominee for Fed Chair, Kevin Warsh, was expected to be more committed to lowering borrowing costs.
But the historic energy shock set off by the war has upended the rates picture. Headline annual inflation is inching near 4% - double the Fed’s target - and the Fed is now expected to remain on hold all year. If it does move, it will be to tighten, current pricing shows.
Many economists have removed their 2026 rate cut calls or pushed them back to next year. But economists at Citi and MUFG are among the few who still think the Fed will be forced to act forcefully this year. Why? Because they believe the economy and labor market are weaker than they appear…
Finviz (for everything else I might have overlooked …)
Moving from some of the news to some of THE VIEWS of Global Wall you might be able to use … Most all of what follows is at very least somewhat connected TO the days CPI release …
A large British operation looking PAST housing quirk …
April core CPI accelerated 18bp, to 0.38%, boosted by the one-off upward adjustment to rents and OER CPI. Core goods inflation was soft, indicating waning tariff pressures. We keep our front-month forecasts unchanged, with core CPI expected to increase 3.0% Q4/Q4 this year…
…The upward adjustment to shelter was widely anticipated by economists, the markets and likely the Fed, providing little reason to extrapolate from this particular print. That said, the run of elevated core PCE prints will likely keep the FOMC on the sidelines. We expect the Fed to remain attuned to developments in energy prices and potential supply chain issues stemming from the closure of the Strait of Hormuz in the coming months, and we maintain our call for the Fed to keep rates unchanged for the rest of the year, followed by a 25bp cut in March 2027.
Askin’ the right questions, problem is, nobody knows …
May 12, 2026 BMO Close: Inflation Realized, More to Come?
…Further taking the edge off the slight upside surprise in core-CPI were oneoff jumps in Rent (+0.55%) and OER (+0.53%) as the BLS backfilled the government shutdown-related distortions…
We’re comfortable looking past this adjustment which was a meaningful contributor to the reacceleration of coreservices inflation, which gained +0.5% in April. On the flipside, supercore – core-services ex-Rent/OER – picked up to +0.45% from +0.18% in March. The gain wasn’t particularly troubling given the noise in the update and the fact that nominal wages were benign in April – indicating no immediate evidence of a wage-inflation spiral underlying the latest figures. Moreover, anyone looking for evidence of tariff pass-through from the trade war was left disappointed as core goods rose just +0.034% in April versus the +0.107% March move, marking a four-month low. Recall that Powell’s rationale for leaving rates unchanged this year has been the Committee’s need for confirmation that tariff pass-through was isolated to one-time price adjustments rather than persistent, demand-driven consumer price inflation. Said differently, it was a benign read from the perspective of the fallout from the trade war.
However, it didn’t answer the question of how much the war in the Middle East will impact consumers’ forward inflation expectations…
…In considering the implications from the update, note that real average hourly earnings on a yearly basis were negative for the first time in three years. If nothing else, this is troubling when considering real personal spending in the coming months….
Flowers and ‘FLATION in full bloom …
12 May 2026 DB: US Economic Notes - April CPI recap: Inflation in full bloom
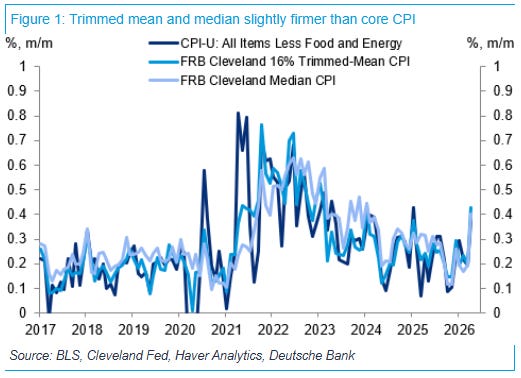
April’s headline CPI (+0.64% vs +0.87% in March) came in slightly hotter than we expected. However, core CPI (+0.38% vs. 0.20%) came in right in line with our expectations. The year-over-year rate for headline jumped 50bps to 3.8%, while that for core picked up to 2.8% (from 2.6%).
On the core goods side, declines in household furnishings and medical care commodities helped to offset continued strength in apparel, likely a function of delayed pass-through from tariffs, as well as information technology commodities, which could be a function of AI demand.
Services were strong, both because of the expected payback in rents from last October’s government shutdown disrupting data collection, as well as energy bleedthrough into core from airline fares and delivery services.
In terms of the readthrough into core PCE, we are tracking a +0.32% April print, up slightly from +0.30% pre-CPI. This would have the year-over-year rate tick up a tenth to 3.3%. Tomorrow’s PPI data will provide more precision around this estimate.
Recent Fed communications have leaned more hawkish. At the moment, downside risks to the labor market appear to be receding while upside inflation risks are becoming more openly acknowledged. As these risks have become more balanced, our base case remains for the Fed to stay on an indefinite hold, though uncertainty around this outcome remains elevated.
…Turning to rates first, that CPI print and worries over sustained costs from a prolonged conflict drove the 10yr Treasury yield (+4.9bps) to 4.46%, its highest since June 2025. The moves were similar for 2yr (+3.7bps to 3.99%) and 30yr yields (+3.9bps to 5.02%), with the latter now just 7bps below the post-2007 high it reached in May last year. That higher US April CPI print showed headline inflation rising +0.6%m/m as expected (+3.8% y/y vs +3.7% y/y exp.) but core inflation slightly beating consensus estimates (+0.4%m/m vs +0.3%m/m and +2.8%y/y vs +2.7%y/y exp.).
In addition to the upside surprise in core, there were a few concerning details within the data. The effects of the Middle East conflict pushed up categories like energy (+3.8% m/m), airfares (+2.8% m/m) and postage and delivery services (+3.5% m/m), while grocery prices (+0.68% m/m) saw their largest monthly rise since 2022. And the Cleveland Fed’s trimmed mean CPI measure came in at +0.43% m/m, its sharpest monthly rise since January 2024. Kevin Warsh has been a proponent of looking more at this measure. Unfortunately it doesn’t seem to be moving in the dovish direction he expected. For more on the release and implications, see our US economists’ reaction piece here.
The hawkish market interpretation was later reinforced by comments from Chicago Fed Goolsbee, who said that the print was “worse than expected” with services inflation being amongst the worst affected. In response, the amount of fed hikes priced by next April rose to a new high of 20bps (+6.0bps on the day). The next big watchpoint for the Fed will be today’s PPI report for April, which our US analysts expect to rise +0.5% for headline and +0.3% for core. So that’s a tough inflation backdrop as Kevin Warsh takes over as Fed Chair later this week, with the Senate confirming him to the Fed Board in a 51-45 vote yesterday while the final vote to confirm him to a 4-year term as Chair is expected today…
Ceilings not floors …
12 May 2026 ING Rates Spark: Hard to see a ceiling for gilt yields
Gilt yields can continue to rise, not just because of political risks, but also on the back of the Bank of England’s quantitative tightening. Meanwhile, US Treasuries continue to feel pain from the never-ending shuttering of the Strait, with April CPI data already high, and set to rise further in the coming months. Not great for core bonds generally
…US inflation added to the pain for Treasuries Tuesday saw headline US CPI inflation come in at 3.8% year-on-year for April. It was 2.4% before the war. That’s a 140bp uplift, and it’s not done. As it is, we’re set to hit 4% in May. Core hits 3% down the line. A persistence to the war and we risk adding to that. Getting to 5% inflation is quite probable if it goes on and on. From here, we likely have another week of waiting and watching the war given the China summit distraction, with the Strait remaining shut tight. All the while, Treasury yields are pressured higher.
The 10yr, now at 4.45%, has 4.5% in its sights. And once there, it will meet buyers, as that’s a level that flags a structural buy for many players. That said, it can just as easily sail on higher, especially as there is no easing in price pressures to help calm things down. The rise in yields post the CPI release was through higher inflation expectations and higher real yields, and there was also an edge higher in the swap spread. All quite tame so far. More re-pricing rather than outright selling.
But it risks getting less tame ahead. The Fed can’t cut here. And risk assets are pushing the boundaries of positivity (or have been). It’s a cocktail that Treasuries really should not feel comfortable with. Tuesday saw a 10yr auction test. There was a slight tail, which is never great, but no big issue. This, and the 30yr auction on Wednesday, are being helped by the concession built in the past couple of weeks (even if that concession is set to build further, in our view).
US CPI ran "hot"; oil rose as Iran truce hopes faded; USTs sold off after 10y auction tailed; UK political risk pressured gilts and GBP; EM FX weakened; S&P 500 -0.2%; Brent +3.3%; DXY at 98.31 (+0.4%); US 10y at 4.46 (+4.9bp).
…US rates sold off across the curve after April CPI exceeded expectations and reinforced concerns that higher energy prices were feeding into broader inflation pressure (2y: +3.6bp; 10y: +4.9bp; 30y: +4.1bp). Headline CPI rose 0.6% m/m and 3.8% y/y, while core CPI rose 0.4% m/m and 2.8% y/y, with services and supercore components drawing attention. The selloff was initially contained, but duration cheapened into supply as the Treasury sold $42bn of 10y notes at 4.468%, tailing the 4.464% when-issued level. Demand metrics were softer, with the bid-to-cover at 2.40 versus 2.43 previously and dealers taking 12% of the auction. Breakevens rose as the inflation impulse remained front-end led, with the 2y breakeven up 5.7bp and the 5y breakeven up 2.1bp. The combination of sticky inflation, higher oil, and weaker auction demand kept the curve under pressure into the close…
May 12, 2026 Morgan Stanley Insight: Global Strategy Mid-Year Outlook: Constructive, Not Complacent
Strong macro and micro fundamentals—reinforced by a powerful AI‑driven capex cycle—support risk assets despite energy‑led volatility widening return dispersion. With the growing role of credit markets in funding AI capex a headwind for spreads, the balance of risks continues to favor DM equities.
Global equities – DM to outperform: DM equity expected returns in the low-teens are compelling. While the upside is similar across DM, a favorable bull-bear skew and strong earnings from positive operating leverage tilt us toward the US. Sector preferences: US — Industrials, Hyperscalers, Financials, Consumer Discretionary Goods; Europe — Semis, Utilities, Tobacco, Energy, Banks, Telecoms; Asia / EM – Industrials, Semis / Memory, Energy & Materials.
…Equities – US leads the pack: Expect DM equities with returns in our base case in the 12- 13% range to moderately outperform EM equities. US, Europe and Japan have similar upsides but bull-bear skew and strong earnings make us favor the US. S&P 500 at 8,300 by 2Q27, MSCI Europe at 2700 by 2Q27.
…Key Investment Ideas
This mid-year outlook builds on three themes we have emphasized since last year: running the cycle hot, public to private rebalancing, and a broadening of earnings and performance.
We see the rolling recovery continuing to progress, driven by a strong earnings environment as positive operating leverage persists.
Our mid-year 2027 S&P 500 price target is 8,300 (20.5x forward EPS of $404). We see 2026 EPS of $339 (23% growth), 2027 EPS of $380 (12% growth), and 2028 EPS of $429 (13% growth).
We favor Financials, Industrials, Consumer Discretionary Goods, and the hyperscalers.
G10 rates – curve performance is key: In the US, expect 2s10s to flatten to 40bp in 2Q26, then steepen to 70bp by end-2027, about 15bp steeper than forwards. The front-end drives the curve steepening, while term premium, supply, and oil uncertainty restrain the long end and constrain a bullish duration view. JGBs offer the most risk-adjusted value versus forwards…
…US Treasuries: Oil Tails, Steeper Than Forwards Key Investment Ideas
USTs may cheapen versus forwards first, but ultimately outperform as the Fed path reprices lower. Early 2Q26 underperformance reflects oil and demand tails, but by 4Q27 2y and 10y yields sit 48bp and 33bp below forwards, led by front-end and belly performance as the distribution migrates back to baseline.
Investors should focus more on curve performance. We expect 2s10s to flatten to 40bp in 2Q26, then steepen to 70bp by end-2027, about 15bp steeper than forwards. The front-end drives the curve steepening, while term premium, supply, and oil uncertainty restrain the long end and constrain a bullish duration view.
Treasury performance relative to SOFR swaps should stay supported by bills, buybacks, Fed RMPs, and regulation. Breakevens stay elevated into end-2026, then ease, while 10y real yields rise toward 1.95% by mid-2027. Nominal gains come from lower inflation compensation more than lower real yields; swaps lag.
Our baseline assumes markets look through the oil shock. Oil stabilizes near $90/bbl in 2026 and falls toward $80/bbl in 2027; US growth slows in mid-2026, but avoids recession as AI capex and fiscal support absorb the hit to real incomes. The outcome for oil provides the caveat: one quarter is a relative-price squeeze, but a second quarter of disruption becomes a policy problem. If gasoline balances stay tight, prices must do more clearing through demand destruction.
Our UST baseline starts as a probability-weighted path of the five scenarios presented by our economists, not a clean read-through from the economics baseline. In 2Q26, we applied the following probabilities: 40% baseline, 15% US aggregate demand, 10% AI productivity, 15% global oil-led recession, and 20% permanent oil premium. The distribution then narrows: baseline probability rises to 50% by 4Q26, 70% by 2Q27, 80% by 3Q27, and 100% by 4Q27. The path keeps both oil tails alive early, then lets the curve migrate back toward baseline as those tails expire.
Our forecast path first cheapens USTs versus forwards, then richens them. The Fed midpoint holds at 3.625% in 2Q26, moves to 3.375% in 3Q26, and reaches 3.125% in 2Q27. We forecast 2y and 10y yields at 4.05% and 4.45% in 2Q26, about 22bp and 18bp above forwards. By 4Q26 they fall to 3.75% and 4.25%, about 15bp and 9bp below forwards. By 4Q27 they sit at 3.45% and 4.15%, about 48bp and 33bp below forwards. We place more weight on our further-out forecasts than the near-term ones. Investors should follow our weekly strategic advice in the near-term…
…Of course, the tails remain wide. Our Treasury bull scenario, built off the global oil-led recession, takes the Fed to 1.625%, the 10y to 3.30%, and 2s10s to 170bp. The bear scenario, built off US aggregate demand, takes the Fed to 4.625%, the 10y to 5.15%, and 2s10s to -50bp. Our forecasts suggest investors should buy duration on early cheapening versus forwards, but express more confidence in steepeners than in a long-end rally…
Coming into this year, we were constructive on growth and remain so, but with increased caution amid the energy supply shock. Energy volatility generates a wide range of outcomes, particularly on the inflation front. The AI boom remains a critical driver of demand, but its effects on productivity are a wild card. We rely on scenarios to illustrate potential paths for the global economy depending on oil and AI outcomes.
Global growth is fundamentally supported by continued US momentum in AI-driven capex and high-end consumer spending, which over time should allow for a broadening in macro drivers. China is more insulated than Europe, although in each case the energy shock will damp but not derail the expansion.
The duration of the energy disruption is consequential – our base case assumes crude back to $90/bbl at the end of the year and further declines in 2027. A more-protracted oil price dislocation would exacerbate growth and inflation risks, and a permanent risk premium for oil would stall the return to target inflation globally. An “escalation” scenario – where oil prices surge through $150/bbl – would mean physical shortages, supply chain disruption, and recessionary outcomes.
The growth drag and inflation boost from the energy supply shock differ meaningfully across regions – we see only a modest and temporary effect on the US, while Europe is more exposed, with a particularly quick boost to inflation. Across Asia, the variation is high, but North Asian growth is somewhat insulated by fiscal policy.
Global disinflation was interrupted in 2026 by the energy supply shock but should resume in 2027. That said, even with a rapid resolution, production, shipping, and inventories will require months to normalize.
Monetary policy has shifted to be less accommodative across the G10 (excluding Japan), but the effect should be temporary if the conflict’s persistence is less than two quarters. We see the Fed cutting in early 2027 after data shows a clear path to disinflation; the BoJ retains its pre-existing hiking path; while the ECB grapples with energy-led inflation in 2026 before pivoting back to neutral in 2027.
Energy and commodity markets, policy choices, and the speed of AI adoption all combine to define growth through 2027. In the baseline, the energy shock slows the global economy modestly through mid-2026 before growth stabilizes and recovers into 2027. We see growth near potential across most major economies. AI-driven capex and fiscal spending on energy security and defense provide a firm floor to prolong late-cycle growth. But we are assuming that the conflict in Iran is resolved in the next month, limiting the effects to one quarter, and that volatility from energy prices subsides over the balance of the year…
HOT, HOT, HOT and getting hotter … AND the impact on Fed call…
12 May 2026 UBS: US Economic Perspectives April CPI recap: Getting hotter
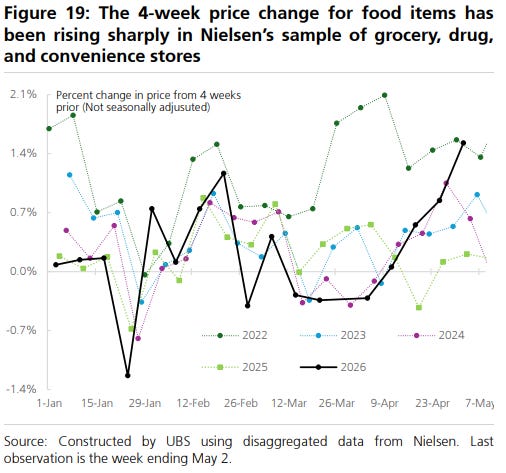
…Another strong headline increase next month, core more moderate We expect another strong increase in the headline CPI in next month’s May report with gasoline prices again rising strongly and Nielsen’s sample of food items sold in grocery stores showing a strong 4-week increase through early May. (Figure 19) Currently we project a 0.49% headline CPI increase and a 0.23% core CPI increase. Note that the headline CPI increase is down notably from our projection last weak as a result of falling retail gasoline prices.
We project that inflation rates will rise further in next month’s May report with headline CPI inflation at 4.25% and core CPI inflation at 2.87%. Inflation in May should be at, or very near, its peak for the year. We expect inflation will slow only very gradually over the next couple of years as tariff and oil price shock effects wane…
12 May 2026, 21:44 UTC UBS: Sticky inflation and supply bottlenecks push back Fed easing
Fed cut timing pushed back: We revise our Fed call to two cuts in December 2026 and March 2027, as the conditions needed to justify a September move—particularly sustained core goods disinflation and reduced supply-side uncertainty—have not yet been met.
Disinflation progress insufficient: Core PCE goods inflation remains too firm, with April tracking near 0.3% m/m, as AI-related software pricing and renewed supply-chain pressures offset disinflation in tariff-sensitive goods categories.
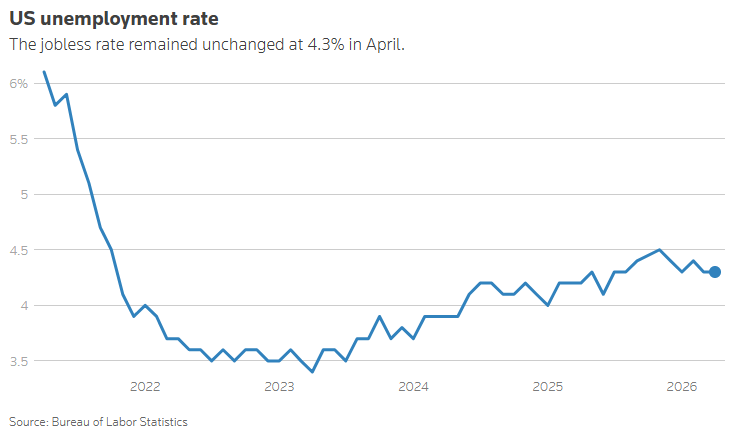
Growth and labor markets support patience: Solid 1Q private domestic final sales (2.5%) and stable unemployment reduce the urgency for near-term easing, leaving inflation dynamics as the dominant policy constraint.
Policy bias remains toward cuts, not hikes: Despite market pricing, the bar for a rate hike remains high given slowing wage trends, anchored inflation expectations, and leadership likely inclined to look through supply-driven inflation—keeping the next move a cut, albeit later…
US April consumer price inflation was slightly higher than expected—but with of the data being guesswork, and rising fictitious owner’s equivalent rent, it is unwise to overemphasize that. The details do raise political concerns. Since US President Trump took office, coffee prices have risen 24%, beef over 19%, gasoline over 19%, and vegetables 10.5%. These are price increases that consumers notice and remember. Trump claimed not to think about Americans’ financial situation, but markets are betting the president does care (and policy decisions will reflect that).
Trump’s visit to China’s President Xi is not creating too much market interest. Some social media-ready statements are to be expected, but if countries make investment or purchase pledges when dealing with this US administration, they do not necessarily follow through…
…US April producer price inflation does not carry the same political weight as consumer prices. Today’s data should confirm that US firms are passing on higher costs to consumers. As consumers use savings to cover those costs (as they did with tariffs), volumes have not been too affected.
On that LAST note …
AND finally, fresh off increased S&P target over weekend …
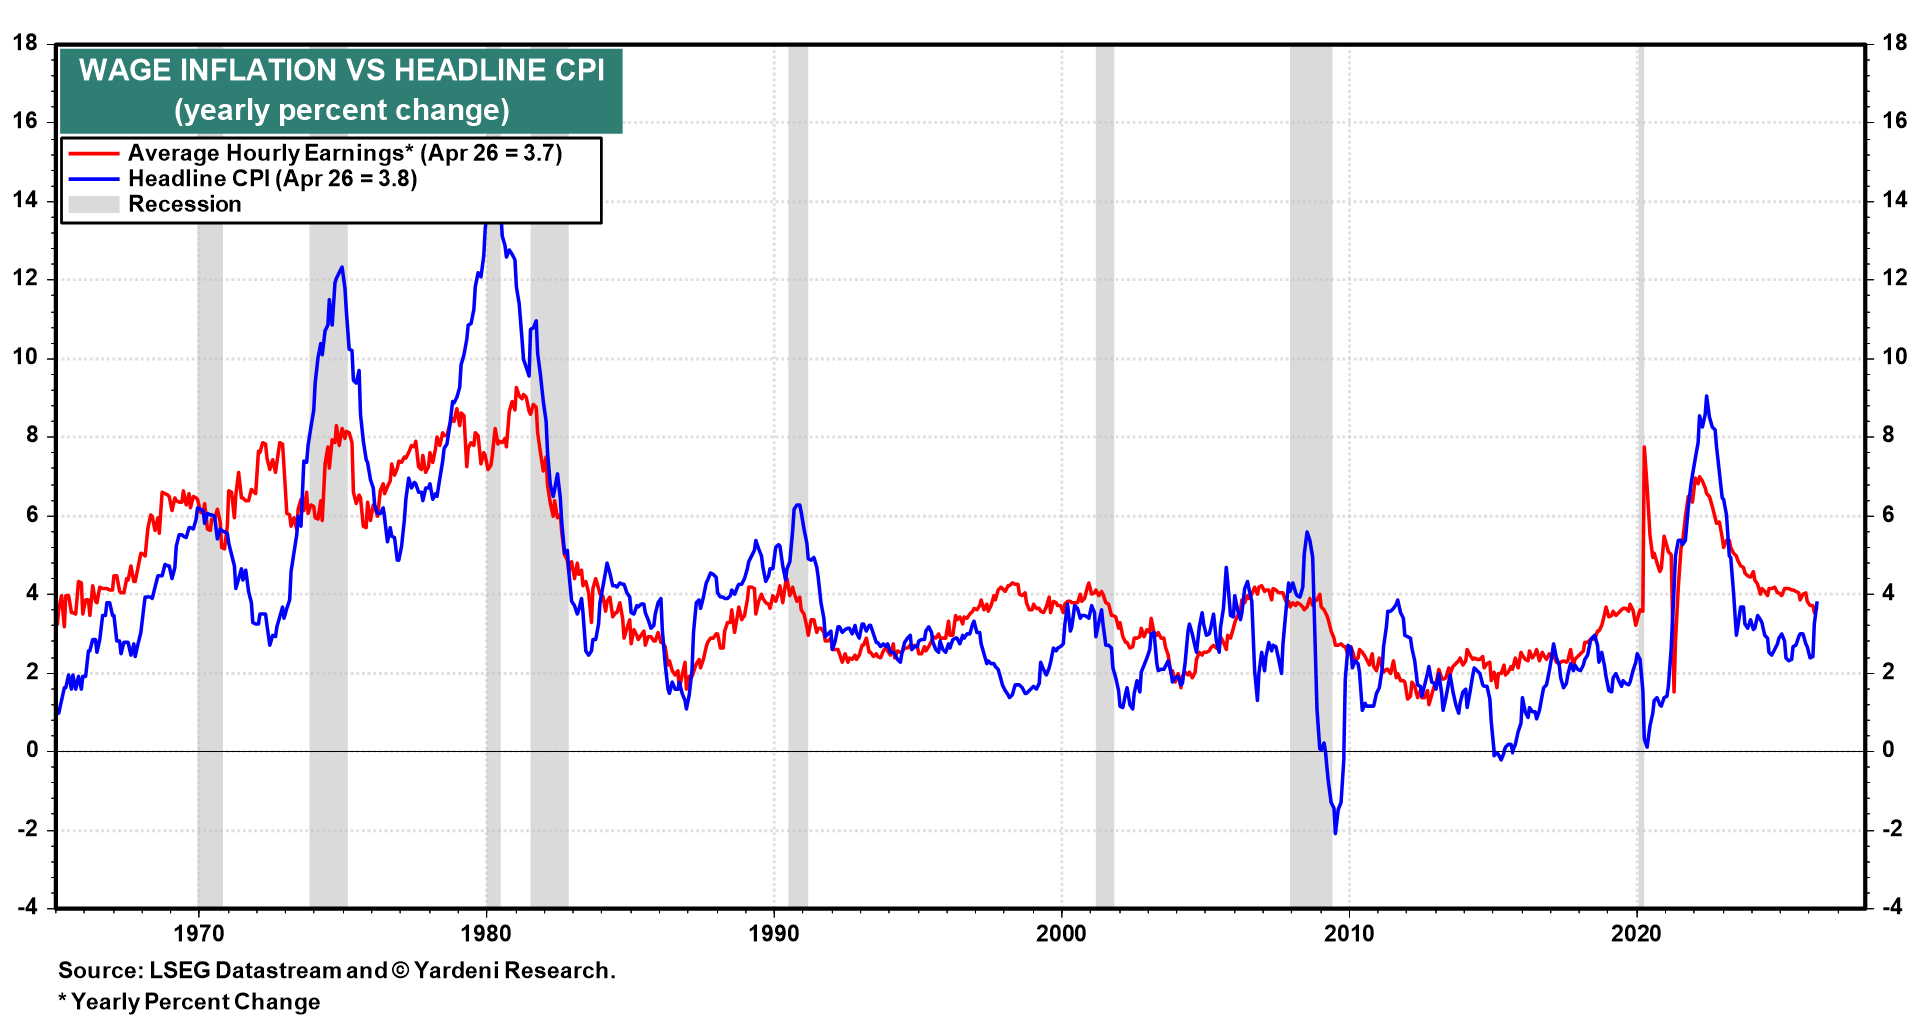
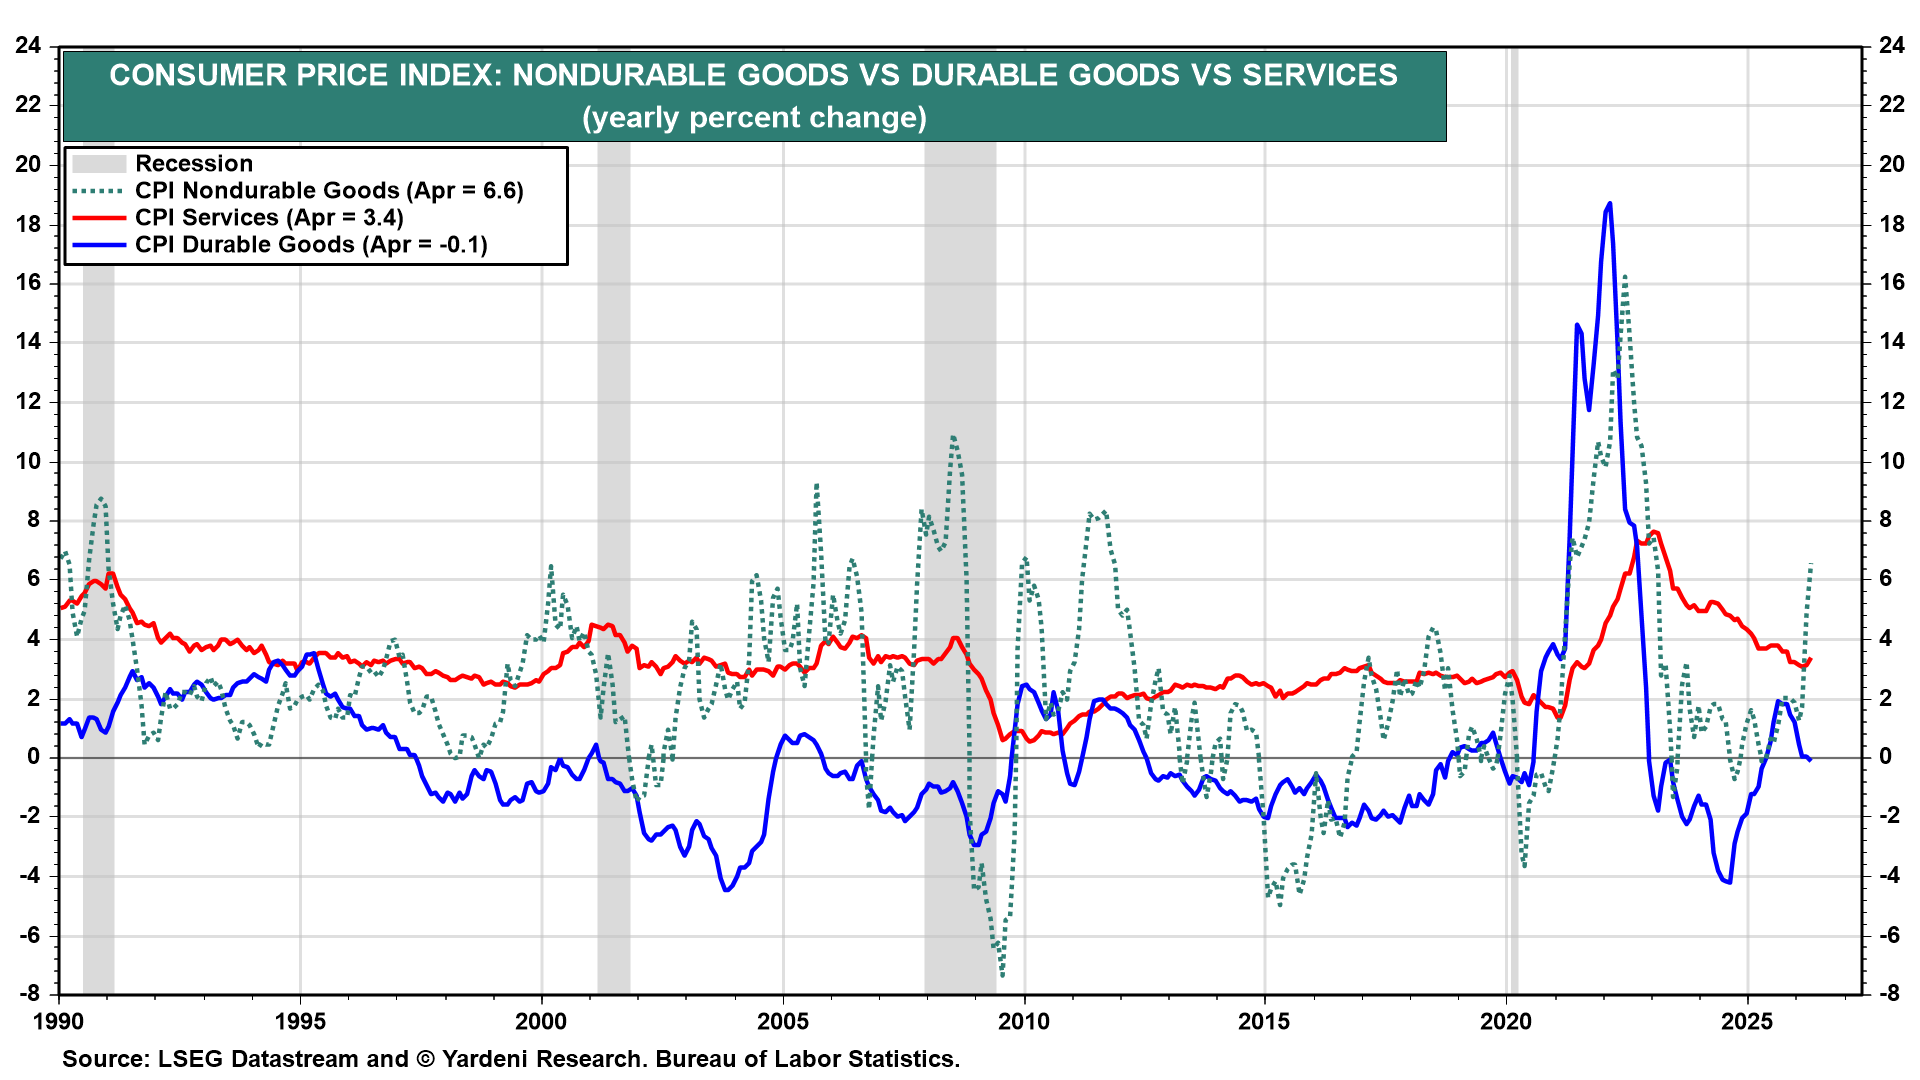
May 12, 2026 Yardeni: CPI Heats Up But, Unlike 2021-22, Wages Remain Cool
During 2021 and 2022, a wage-price spiral was exacerbated by widespread global supply chain disruptions and a spike in oil prices following Russia’s invasion of Ukraine (charts). This time, the war in the Middle East has caused oil prices to spike. Some supply chains have been disrupted. But a wage-price spiral is less likely.
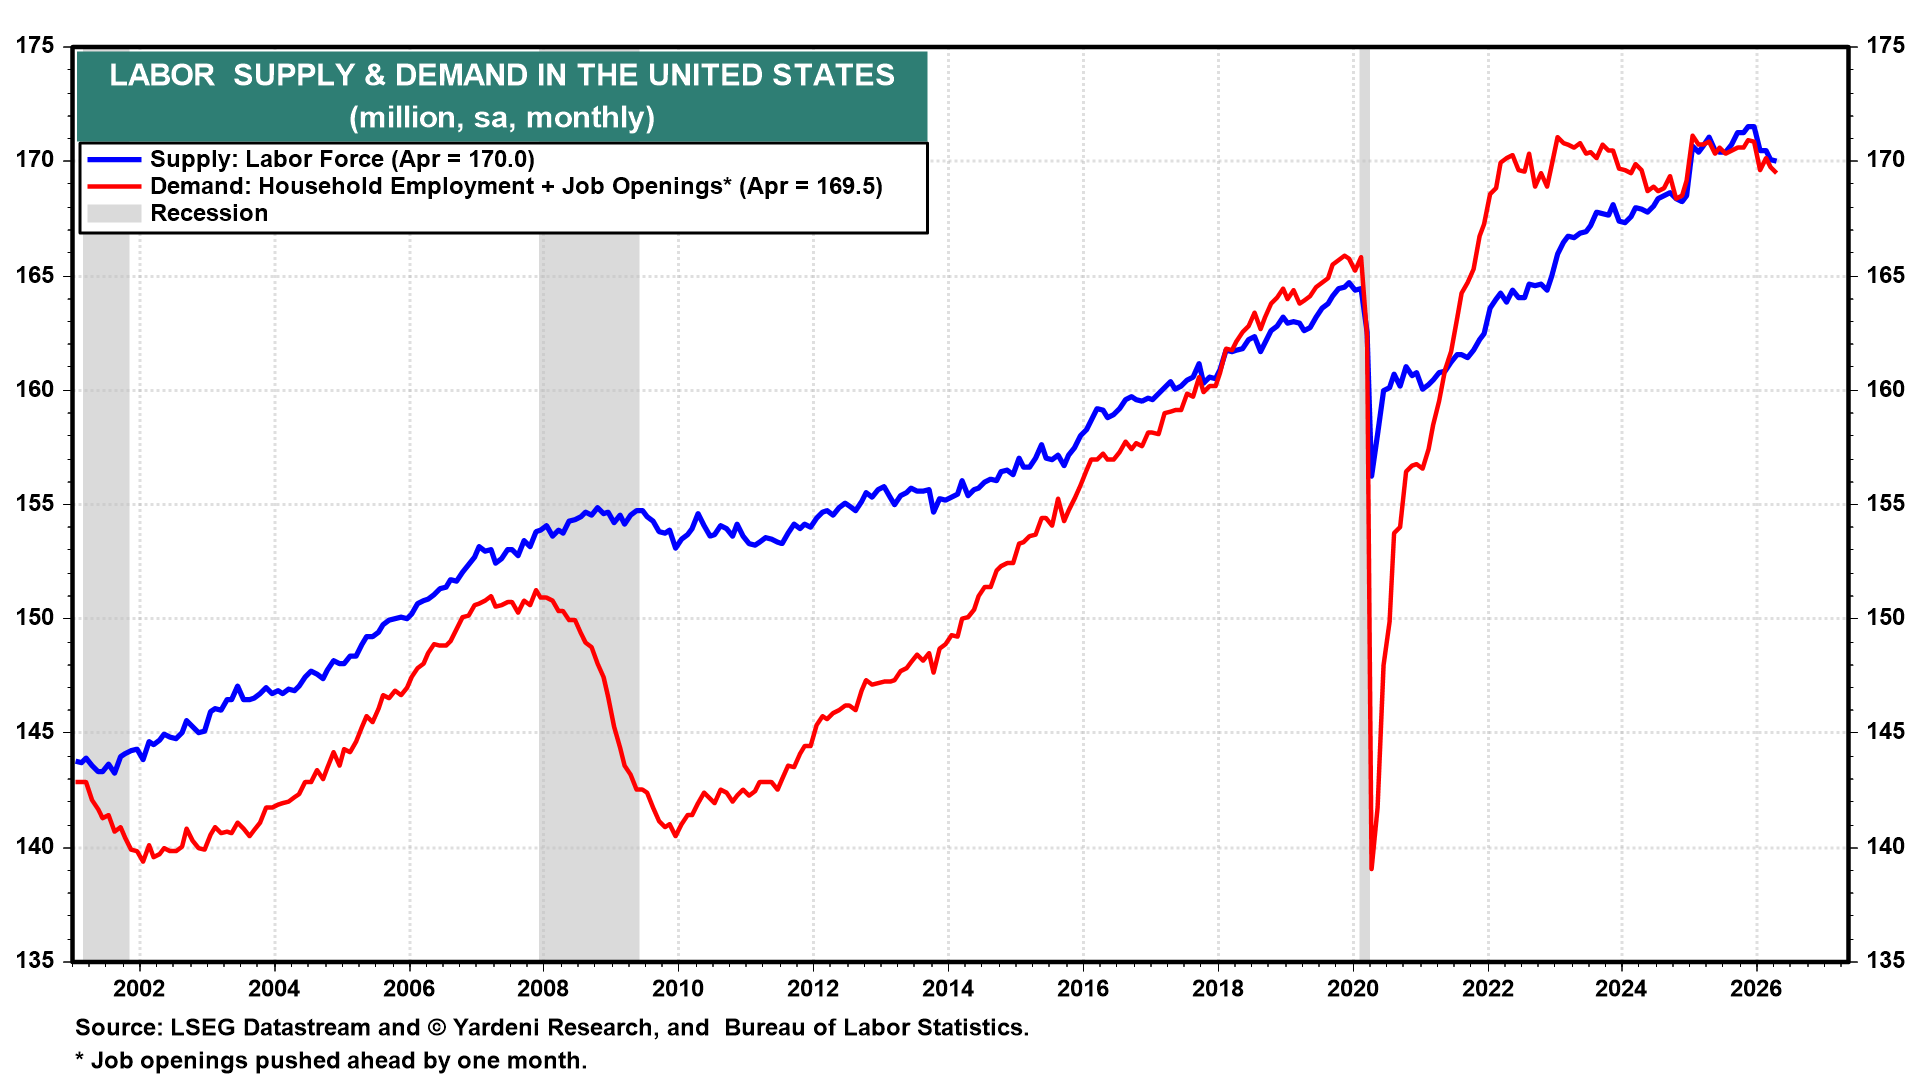
…The labor market is in equilibrium this time (chart). In 2021-22, demand for labor significantly exceeded the supply of labor. So, wage inflation should remain much more moderate this time than it was back then (chart).
If so, then a wage-price spiral is unlikely to amplify the inflationary consequences of the supply shock attributable to the Strait of Hormuz blockade (chart).
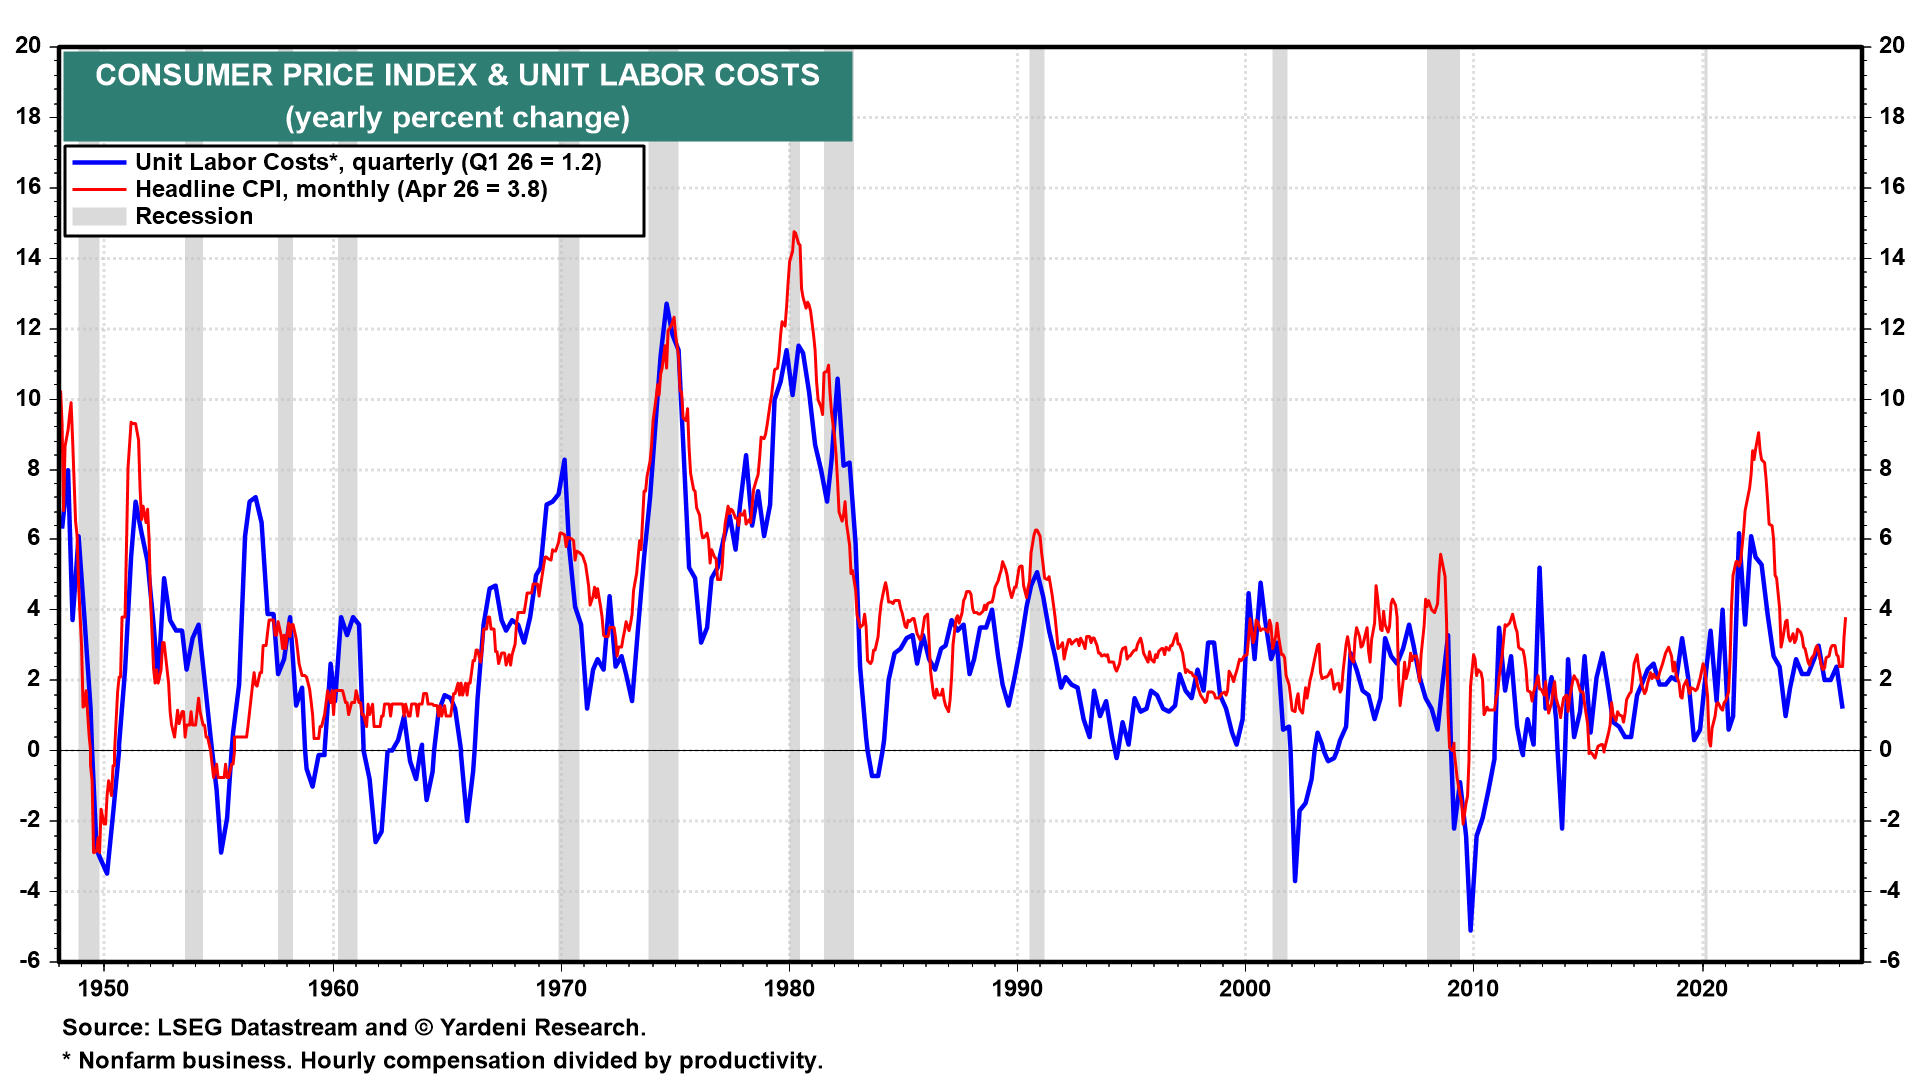
Unit labor cost inflation fell to 1.2% y/y during Q1 as productivity gains offset increases in hourly compensation (chart). In our Roaring 2020s scenario, productivity should remain a powerful disinflationary force, while wage inflation remains moderate.
…The CPI inflation rate was driven higher by a 6.6% y/y increase in nondurable goods prices, as energy prices rose 17.9% y/y (chart). Durable goods inflation continued to moderate to -0.1% y/y, indicating that the impact of tariffs is diminishing. The services inflation rate edged higher to 3.4%.
… Moving along TO a few other curated links from the intertubes. I HOPE you’ll find them as funTERtaining (dare I say useful) as I do … …
First up, the good Doctor SLOK says we’re (US GOVT FINANCES) not ready for recession …
May 13, 2026 Apollo: US Government Finances Are Not Ready for a Recession
During US recessions, the budget deficit typically widens by around 4% of GDP as unemployment benefits surge and tax revenues collapse, see here.
That would be manageable if the US were entering a potential recession from a position of fiscal strength. It is not. In fact, the US has never entered a recession with this little fiscal buffer, see chart below.
The investment implication is clear: do not expect lower interest rates to bail out valuations. The standard recession playbook that growth slows, the Fed cuts, rates fall and multiples expand breaks down when the sovereign borrower is already stretched.
In the front end, inflation driven by higher energy prices, tariffs and immigration restrictions is proving stickier than the Fed expected, constraining how aggressively it can cut. At the long end, the fiscal trajectory is structurally bearish for bonds. Treasury is already funding record deficits almost entirely through T-bills to avoid putting upward pressure on long yields, a strategy that cannot continue indefinitely. When coupon issuance eventually has to increase, the supply shock will push long yields higher, not lower. And in a recession, the deficit blows out further, requiring even more issuance at precisely the moment when market appetite for duration is most uncertain, see also here.
The bottom line is that rates are staying higher for longer across the curve, and the traditional path to value creation through multiple expansion is largely closed. Value will have to come from the hard work of operational improvement, i.e., earnings growth, margin expansion and cash generation, and not from the discount rate doing investors a favor.
A view from The TERMINAL DOT COM (and a read through on positions) …
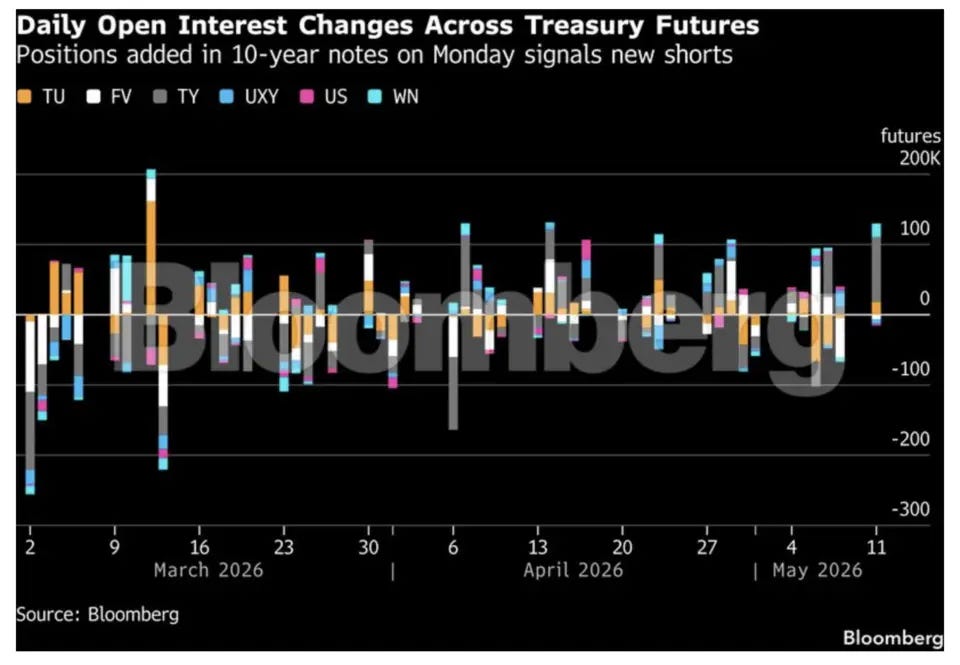
May 12, 2026 Bloomberg: Bond Traders Renew Bearish Treasuries Bets on Inflation
Traders have renewed bearish bets on U.S. Treasurys, lifting expectations that the Federal Reserve will raise interest rates as oil prices and inflation push higher.
The hawkish shift has rippled across maturities. At the short end of the curve, interest-rate swaps have resumed pricing a quarter-point rate hike by the middle of next year. Long-dated Treasurys are also under pressure as traders are betting on yields to sustain a move above 5%.
Meanwhile, a selloff in Treasury futures Monday sent 5-year yields further above 4% and sparked a buildup in short positions, including one of the largest new positions in 10-year notes in over a month.
The ramp-up in rate hike odds gained momentum Tuesday after consumer price data showed U.S. inflation accelerated in April due to rising gasoline and grocery costs.
“There’s a decent short base that has been building in the market,” said Kelsey Berro, fixed-income portfolio manager at JPMorgan Asset Management. “The market has been very efficient in repricing to a reality of higher inflation for longer as a function of the increase in energy prices.”
In the options market tied to the Secured Overnight Financing Rate, which closely tracks Fed policy expectations, traders are looking to hedge against more rate hikes being priced into SOFR futures over the coming weeks.
During Monday’s session demand emerged for put options targeting a couple of rate hikes to be priced in by the end of next year. Interest rate swaps currently show around 85% of a quarter-point hike by the April policy meeting, with traders adding to the bets after the latest CPI data.
“Bearish sentiment is rebuilding into the rise in yields with short risk being added to the front end in SOFR and in the belly of the curves,” Citigroup Inc. strategist David Bieber said.
A number of Fed officials have recently pushed back on the presumption that the Fed’s next policy move will be a cut. After Tuesday’s data, Federal Reserve Bank of Chicago President Austan Goolsbee said inflation readings show pervasive price pressures in the U.S. economy and may even indicate an overheating.
“What the market is pricing is a resilient economy and a Fed that is able to stay on hold for a significant period of time,” JPMorgan’s Berro said.
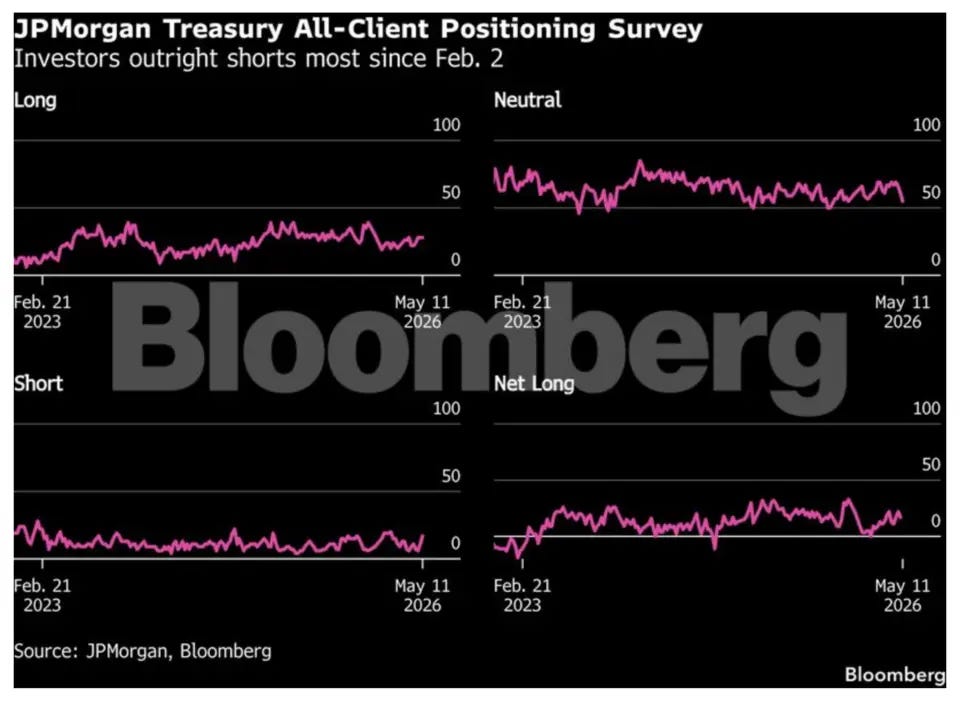
In the cash market, a survey of JPMorgan clients released Tuesday also showed bearish sentiment on the rise, as investor outright short positions rose to the most in 13 weeks.
May 13, 2026 at 4:00 AM UTC Bloomberg: Warsh could find inflation too hot to handle Pressure for rate cuts is running into a wall of a reality from the Iran war.
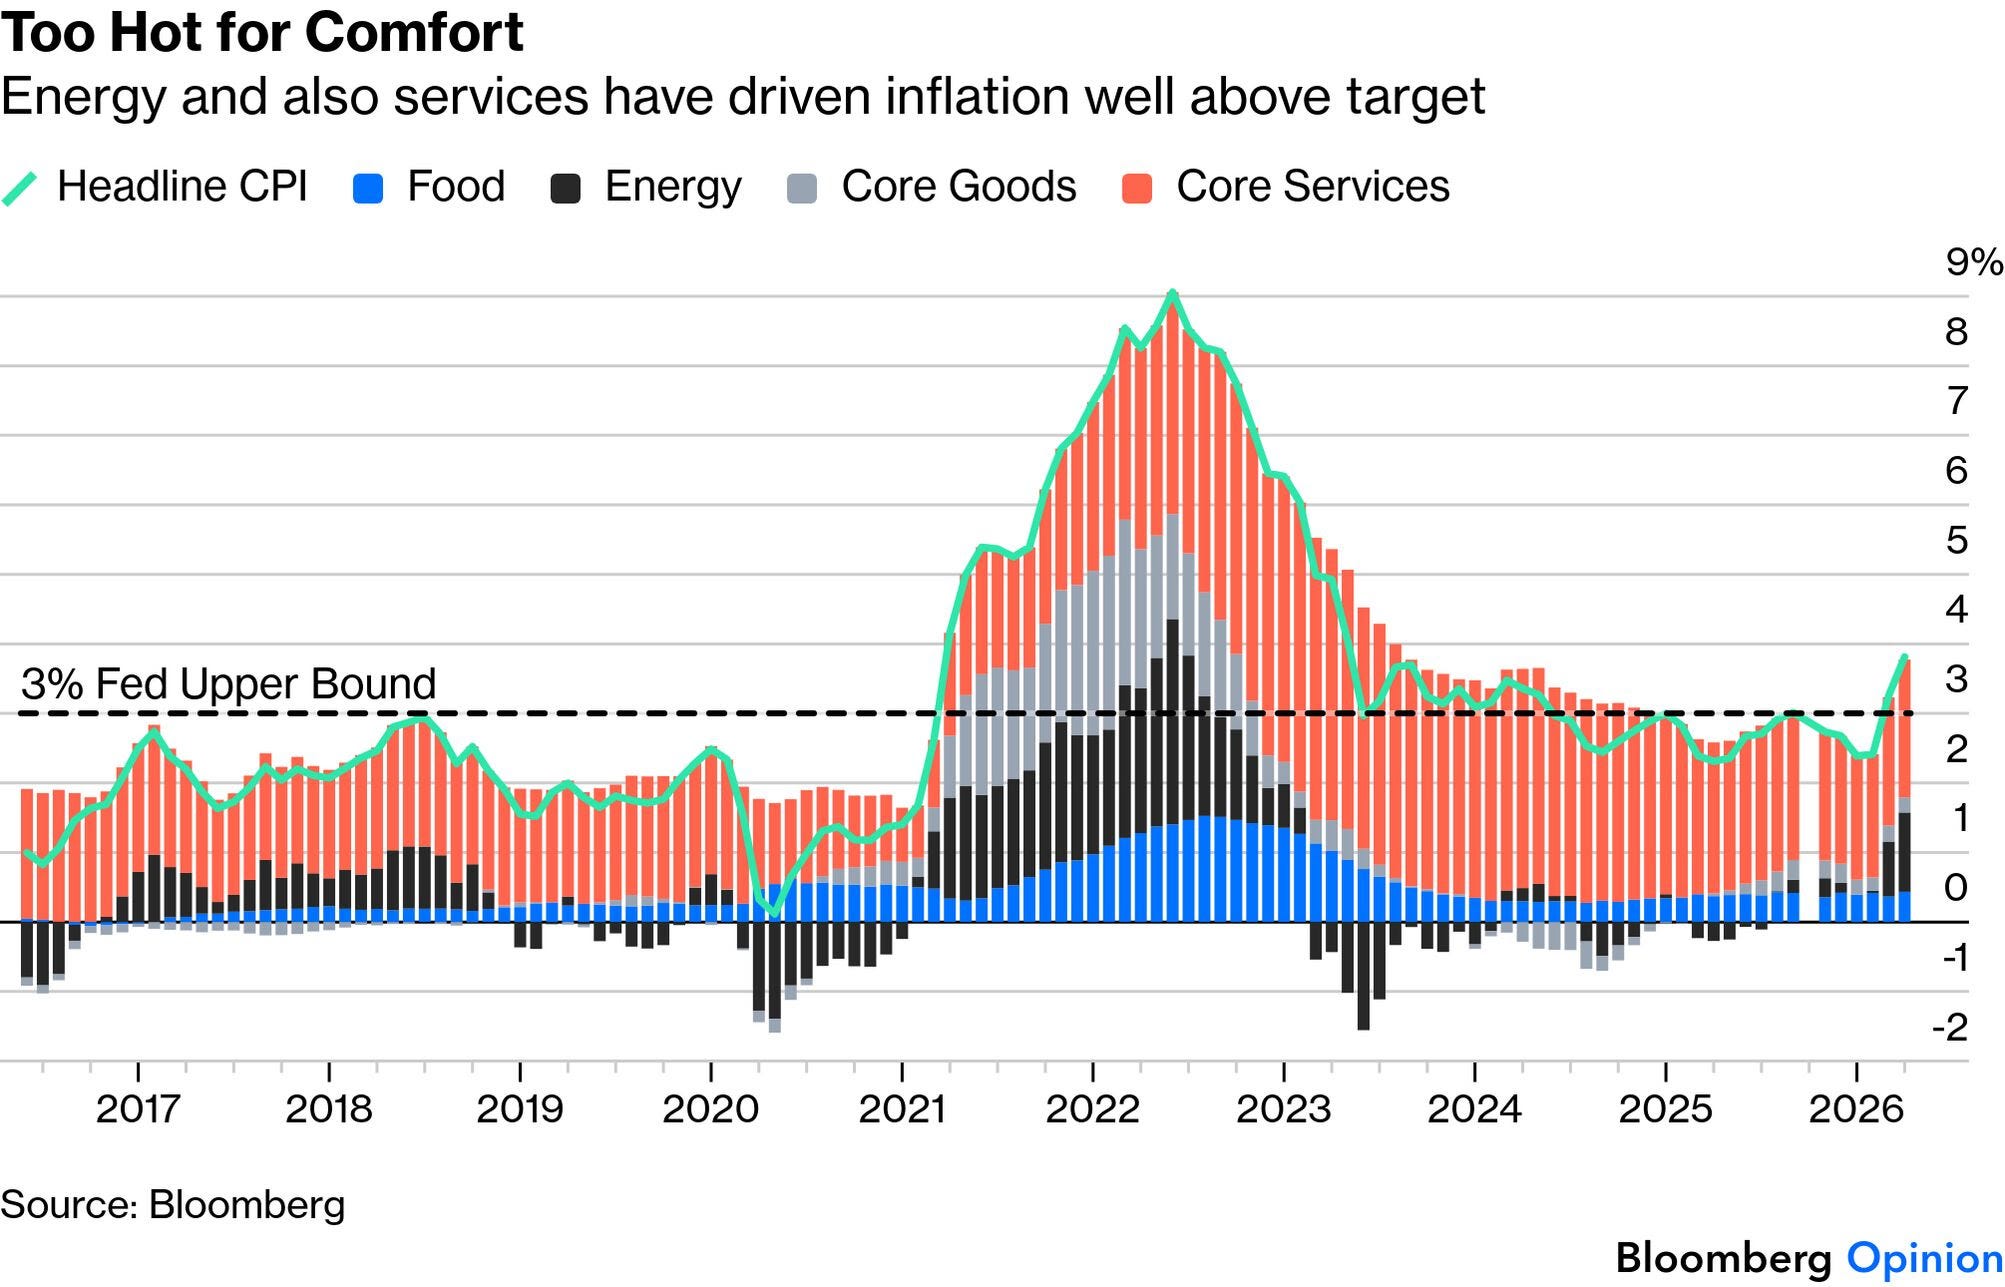
…Too Hot
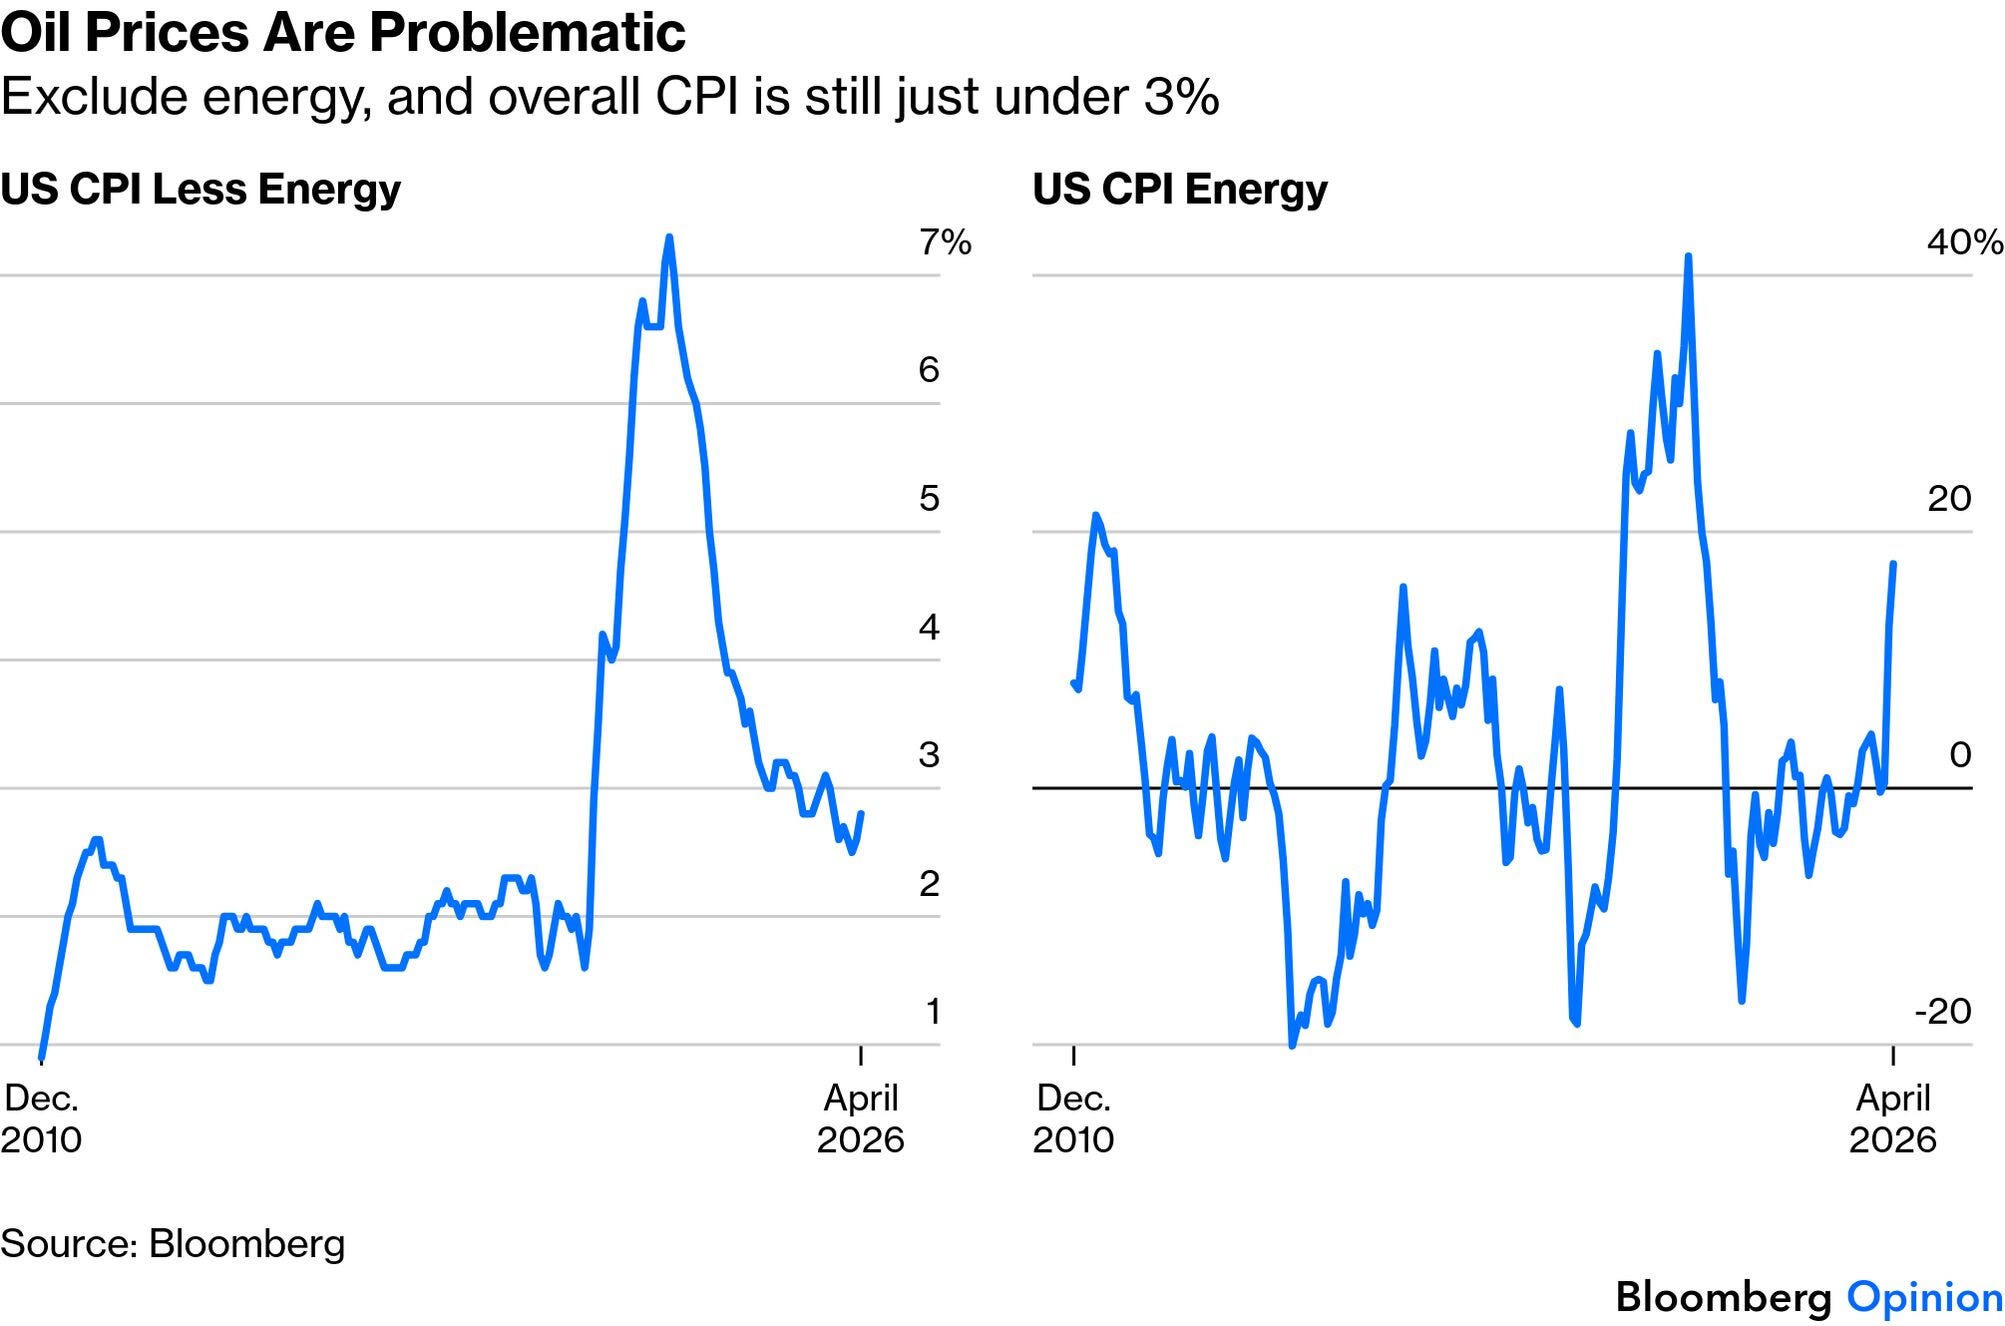
US inflation is too hot for comfort. The numbers for April reveal that the headline rise in consumer prices reached 3.8%, continuing an upward trend that started before the Iran war and well above the Federal Reserve’s upper band target of 3%. Overall inflation hasn’t been this high in three years:
The greatest problem is, of course, the spike in energy prices driven by the blockage of the Strait of Hormuz. Energy prices are always erratic and there is little monetary policy can do to control them, which is why central banks tend to look at core inflation, excluding both food and fuel. Merely removing energy is enough to bring inflation down to 2.8%. CPI minus energy looks far more contained than it did at the worst of the post-pandemic spike:
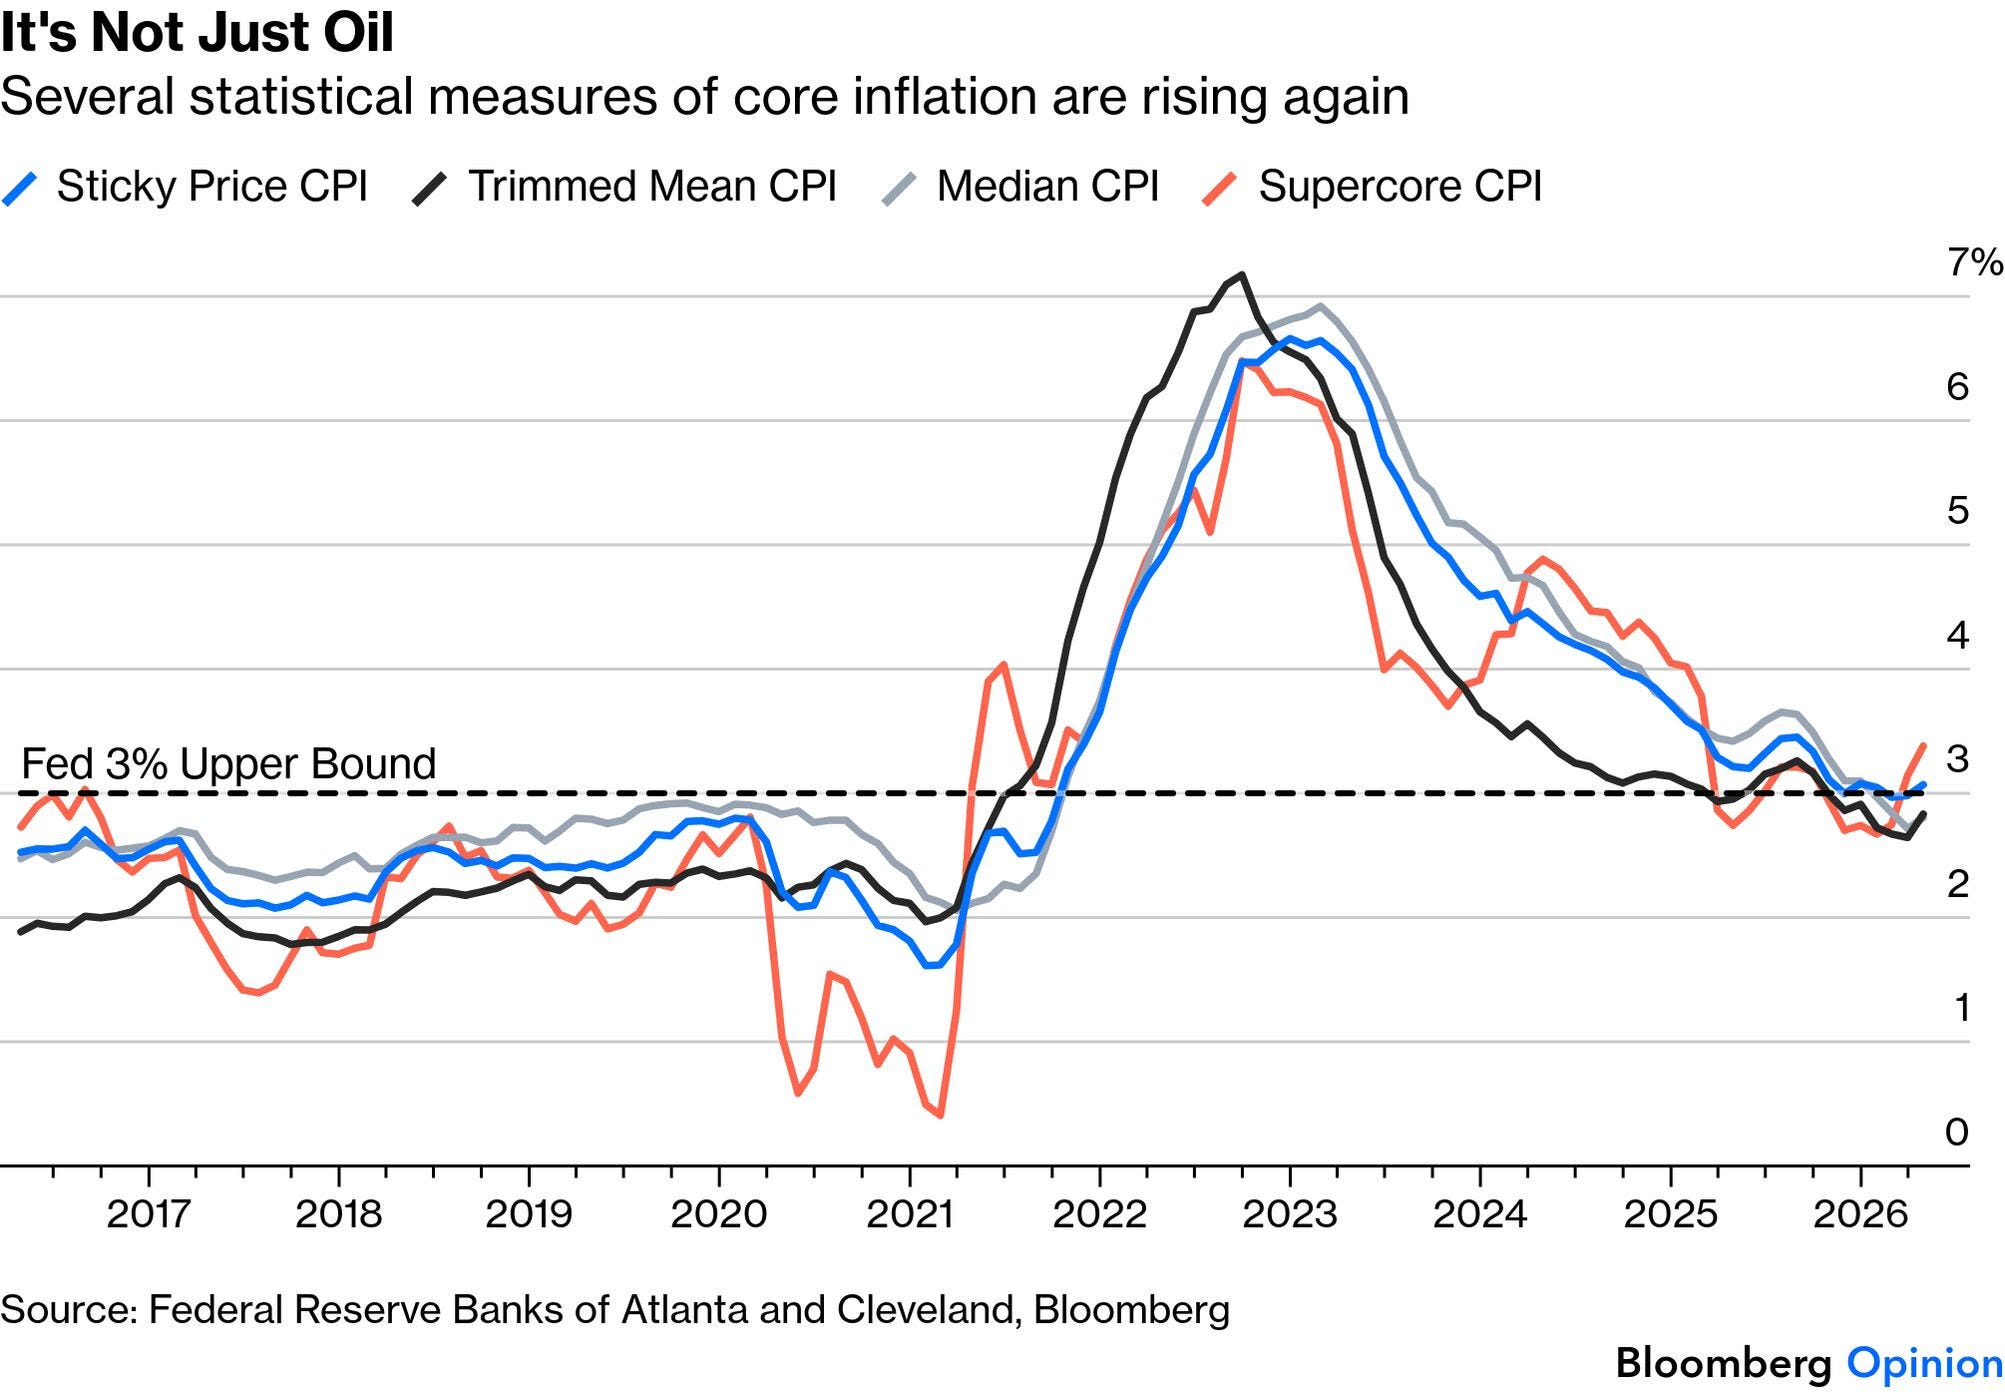
However, inflation excluding energy is still rising, while an array of other statistical measures of core price increases are also turning upward. Even if fuel prices are ignored (something that people in the real world aren’t able to do), the median and the trimmed mean (in which the outlying components are excluded and an average taken of the rest) are rising. Sticky prices, which take time to move and are hard to reduce, have ticked back up above 3%, while the Fed’s so-called “Supercore” (services inflation minus shelter) rose sharply. There is more to this than the first-order effects from the oil shock:
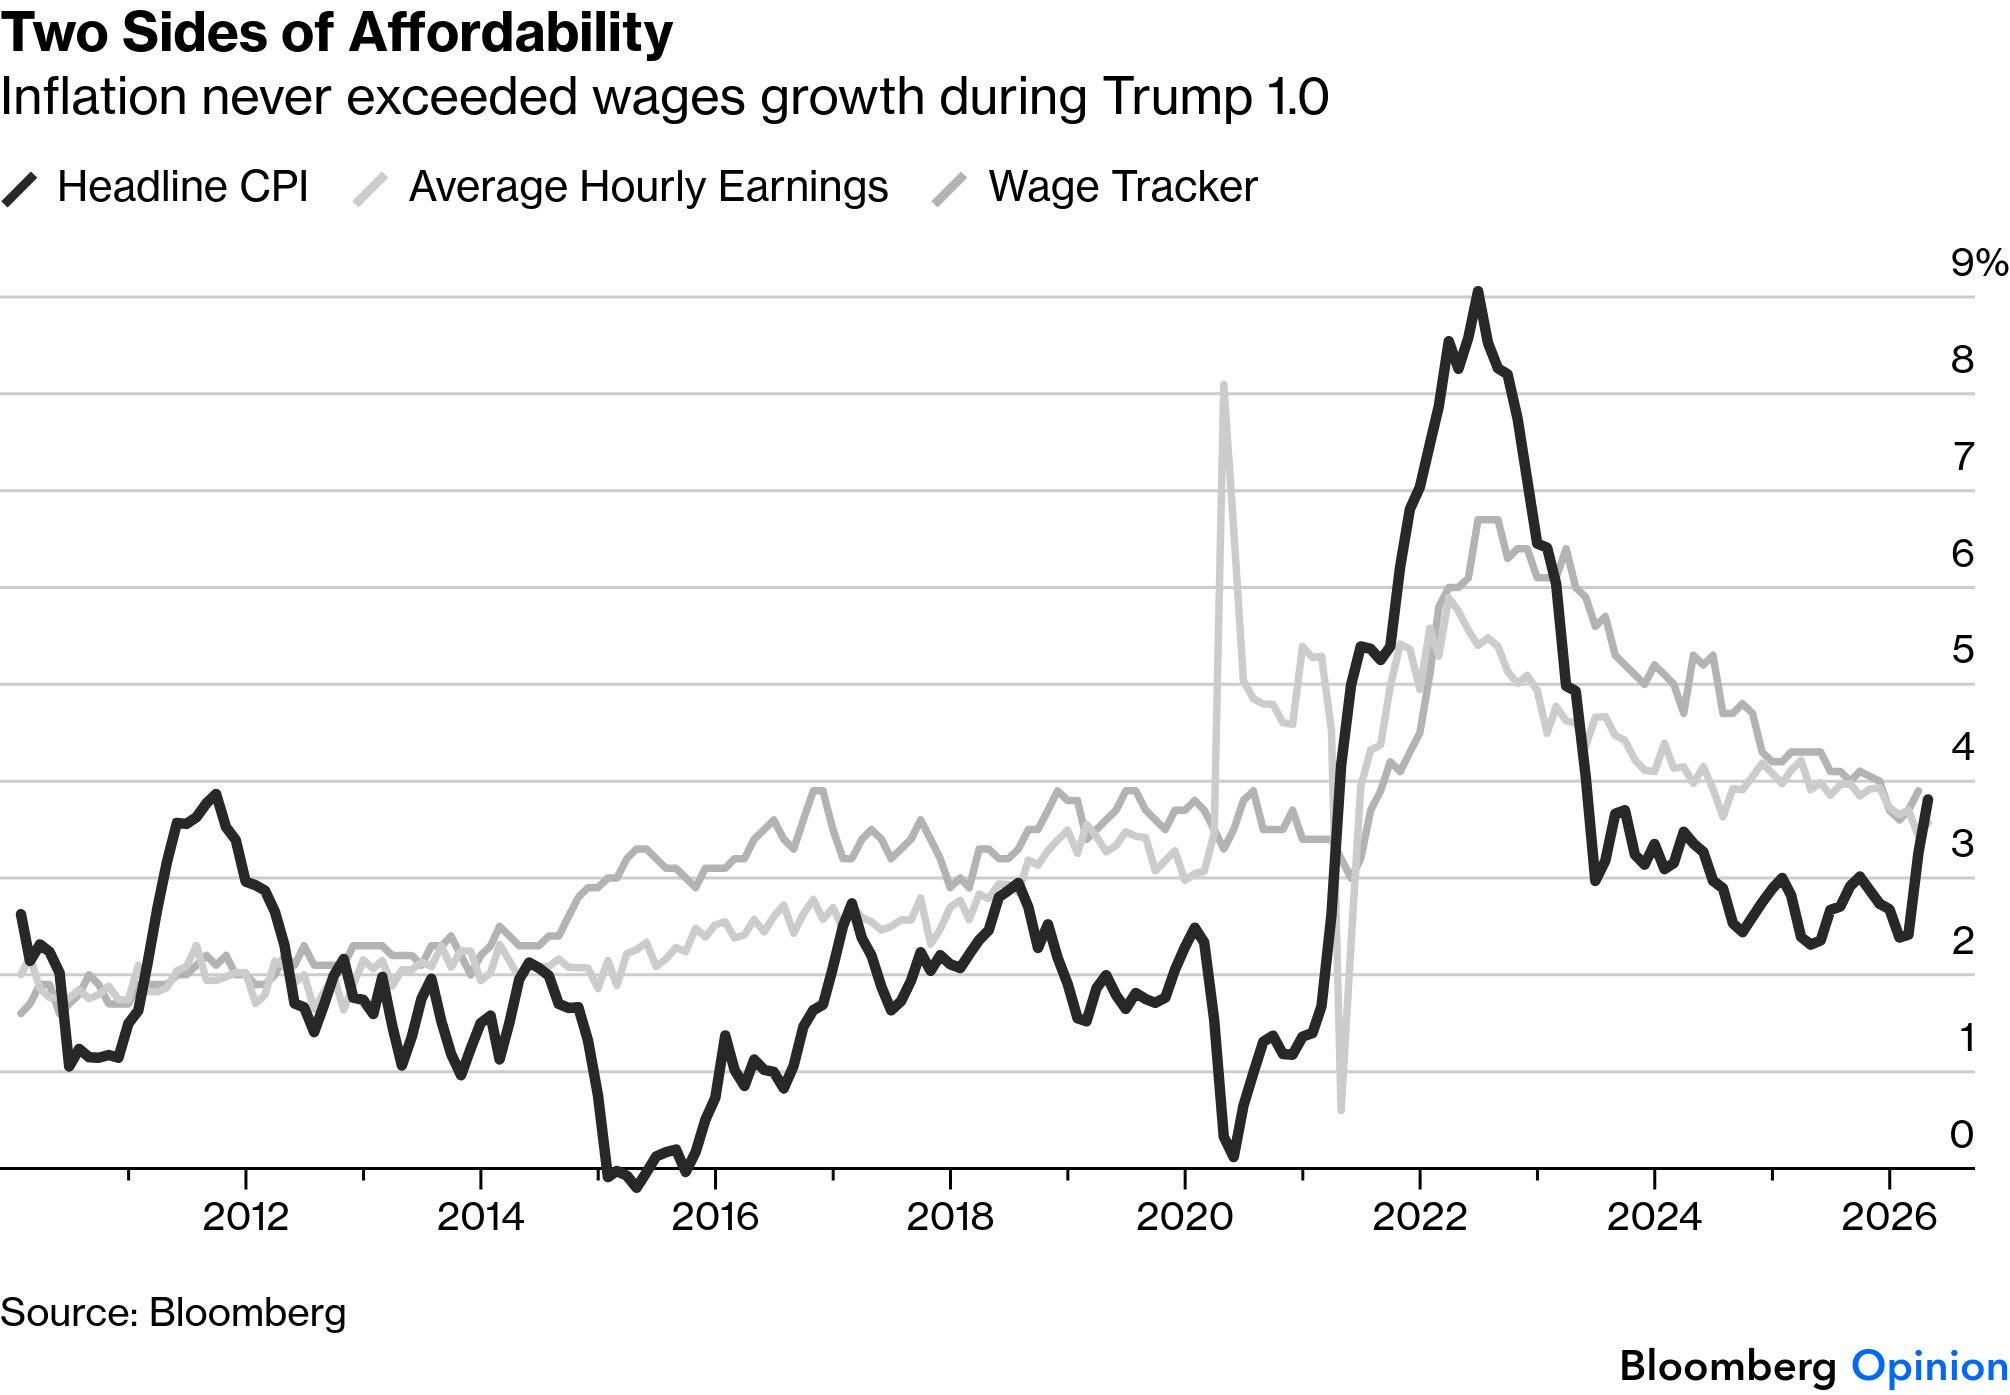
The really bad political news is on affordability. Prices can rise without making life less affordable if wages rise faster, which is what usually happens. But last month, consumer prices rose faster than average hourly earnings, for the first time since 2022. This never happened during the first Trump term.
Wages are deceptively difficult to measure. April’s inflation number is still slightly below the 3.9% wage growth recorded by the Atlanta Fed’s wage tracker, which is based on census data, in March. The April figure will be available later this week, but the squeeze on affordability is undeniable:
None of this is welcome news either for financial markets or for central banks…
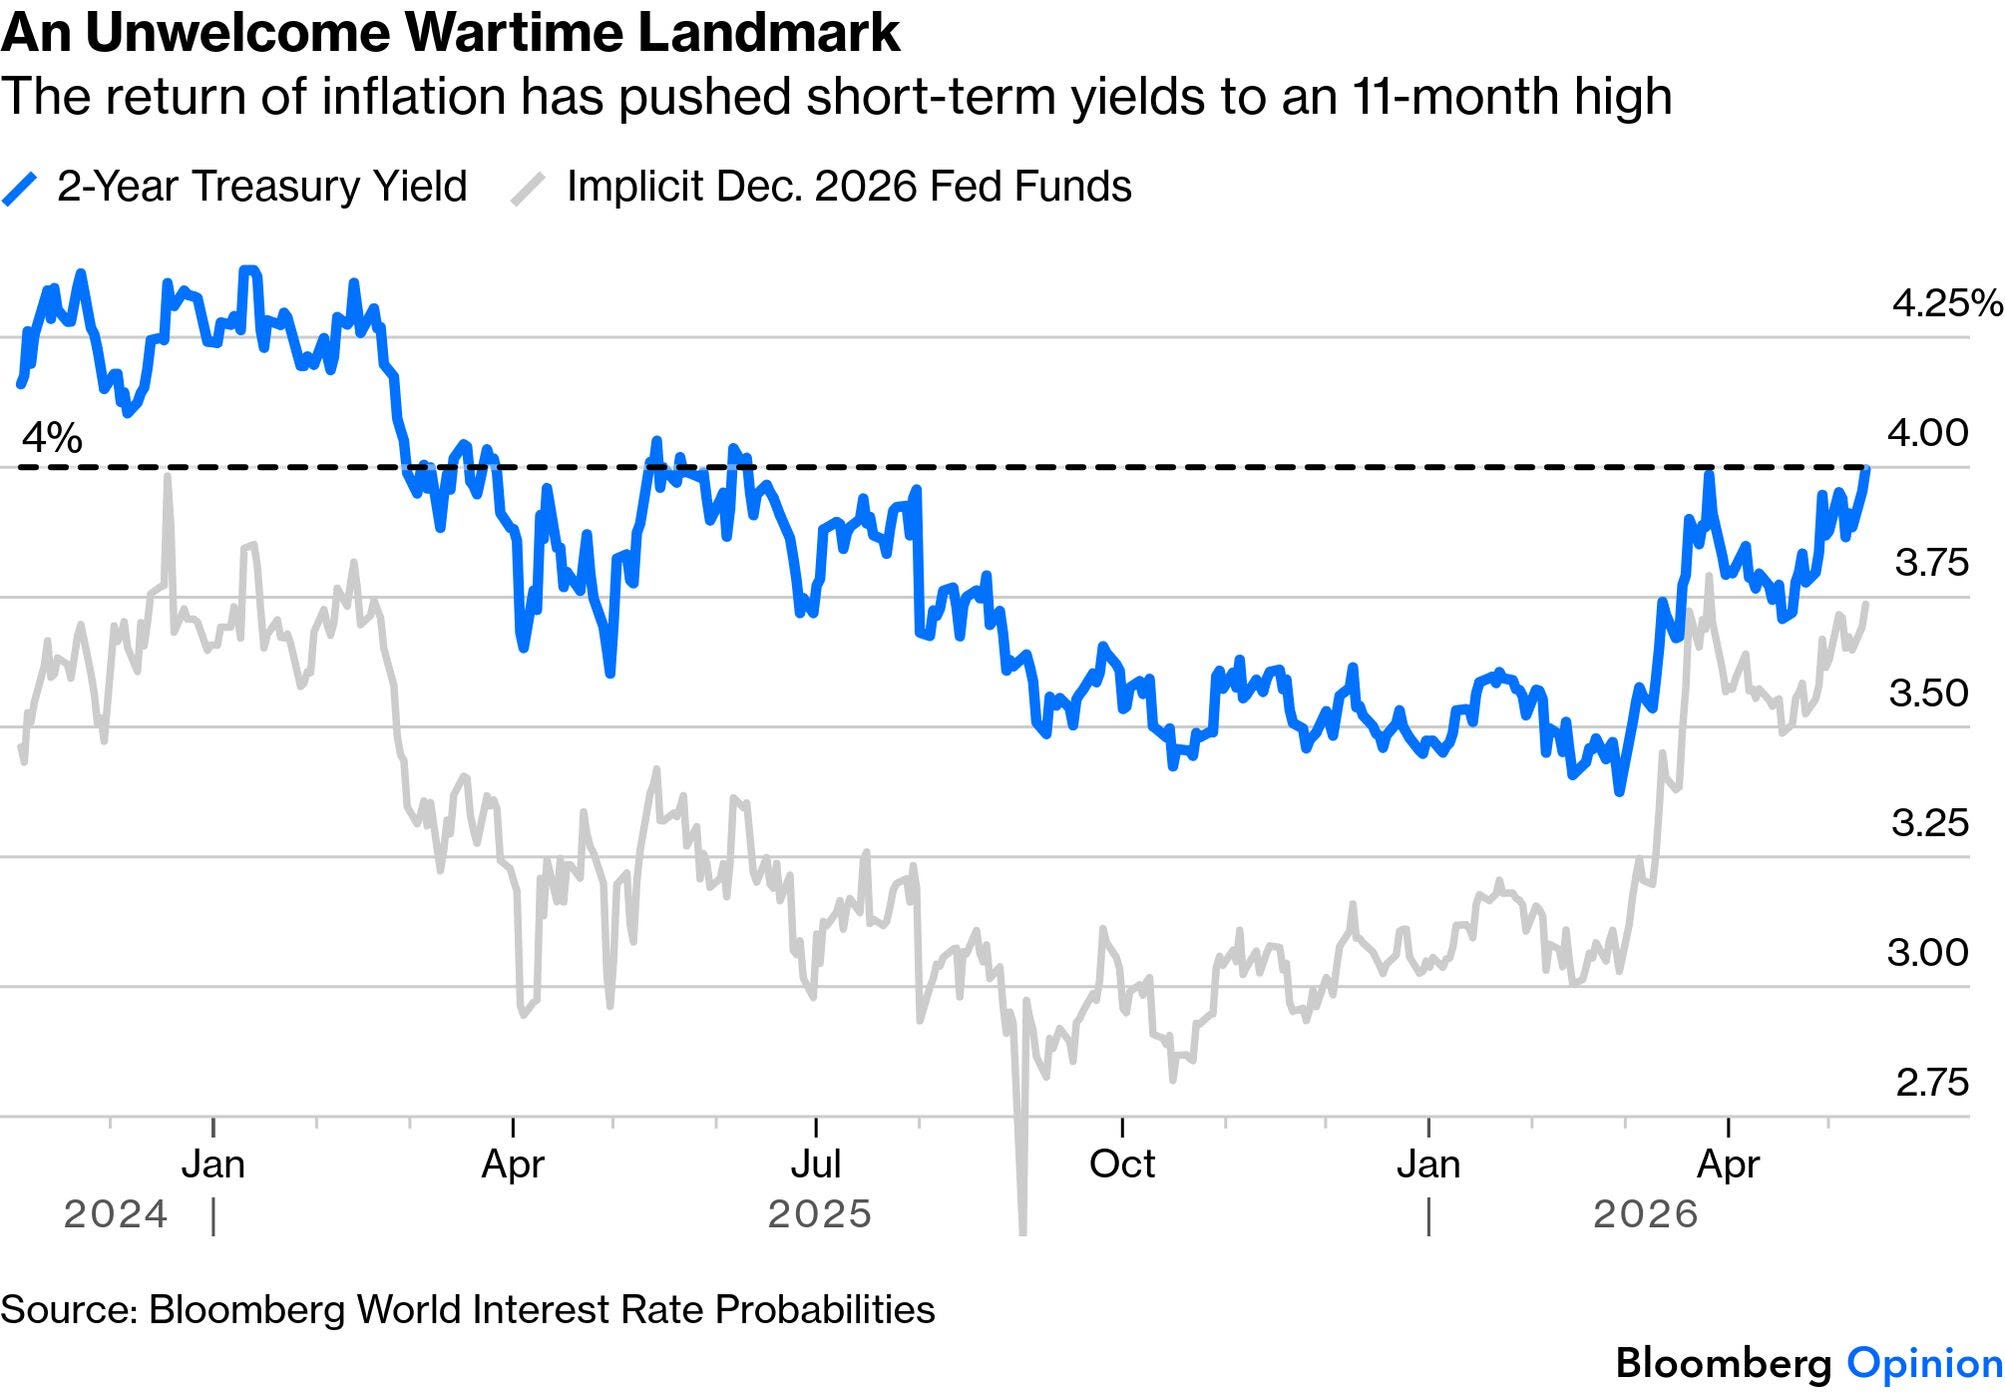
He arrives just in time for two-year Treasury yields to touch 4%, their highest since June last year, buoyed by the strong market expectation that the fed funds rate cannot move far from where it is now — but that the next move is now more likely to be a hike than a cut:
This is a direct byproduct of the war in Iran, which instantly pushed up both short-term yields and rate expectations. The latest miserable news, with Trump dismissing the most recent Iranian peace proposal as “garbage,” had a predictable effect on oil prices. Futures took December prices for Brent crude back above $90 per barrel to retouch their highs
CHARTS … couple / few good ones and so …
May 12, 2026 The Chart Report: Inflation Fears Are Creeping Back
oday’s Chart of the Day was shared by J.C. Parets.
Inflation-protected U.S. Treasuries are making new multi-year highs relative to nominal treasuries, signaling that the bond market is starting to price in higher inflation.
If inflation begins to re-accelerate similar to 2021, we could see a meaningful rotation of capital into more areas that are less sensitive to interest rates.
The Takeaway: Following today’s hotter than expected inflation data, we can look to both the bond market and commodities for clues on where inflation may be headed next…
May 12, 2026 Daily Chartbook: “This type of extreme narrow leadership barely existed in earlier decades”
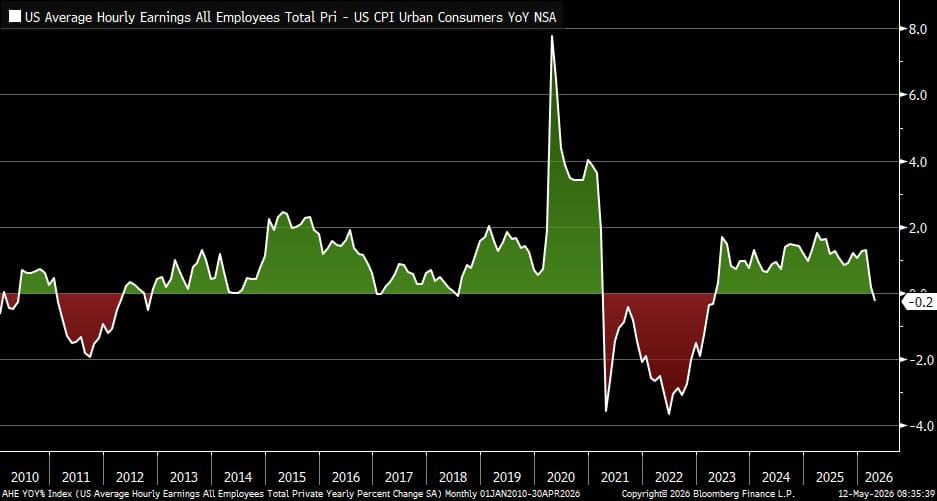
1. Real wages. “With headline inflation coming it at +3.8% y/y in April, that means real average hourly earnings growth (adjusted for CPI) slipped into negative territory for the first time since April 2023”.
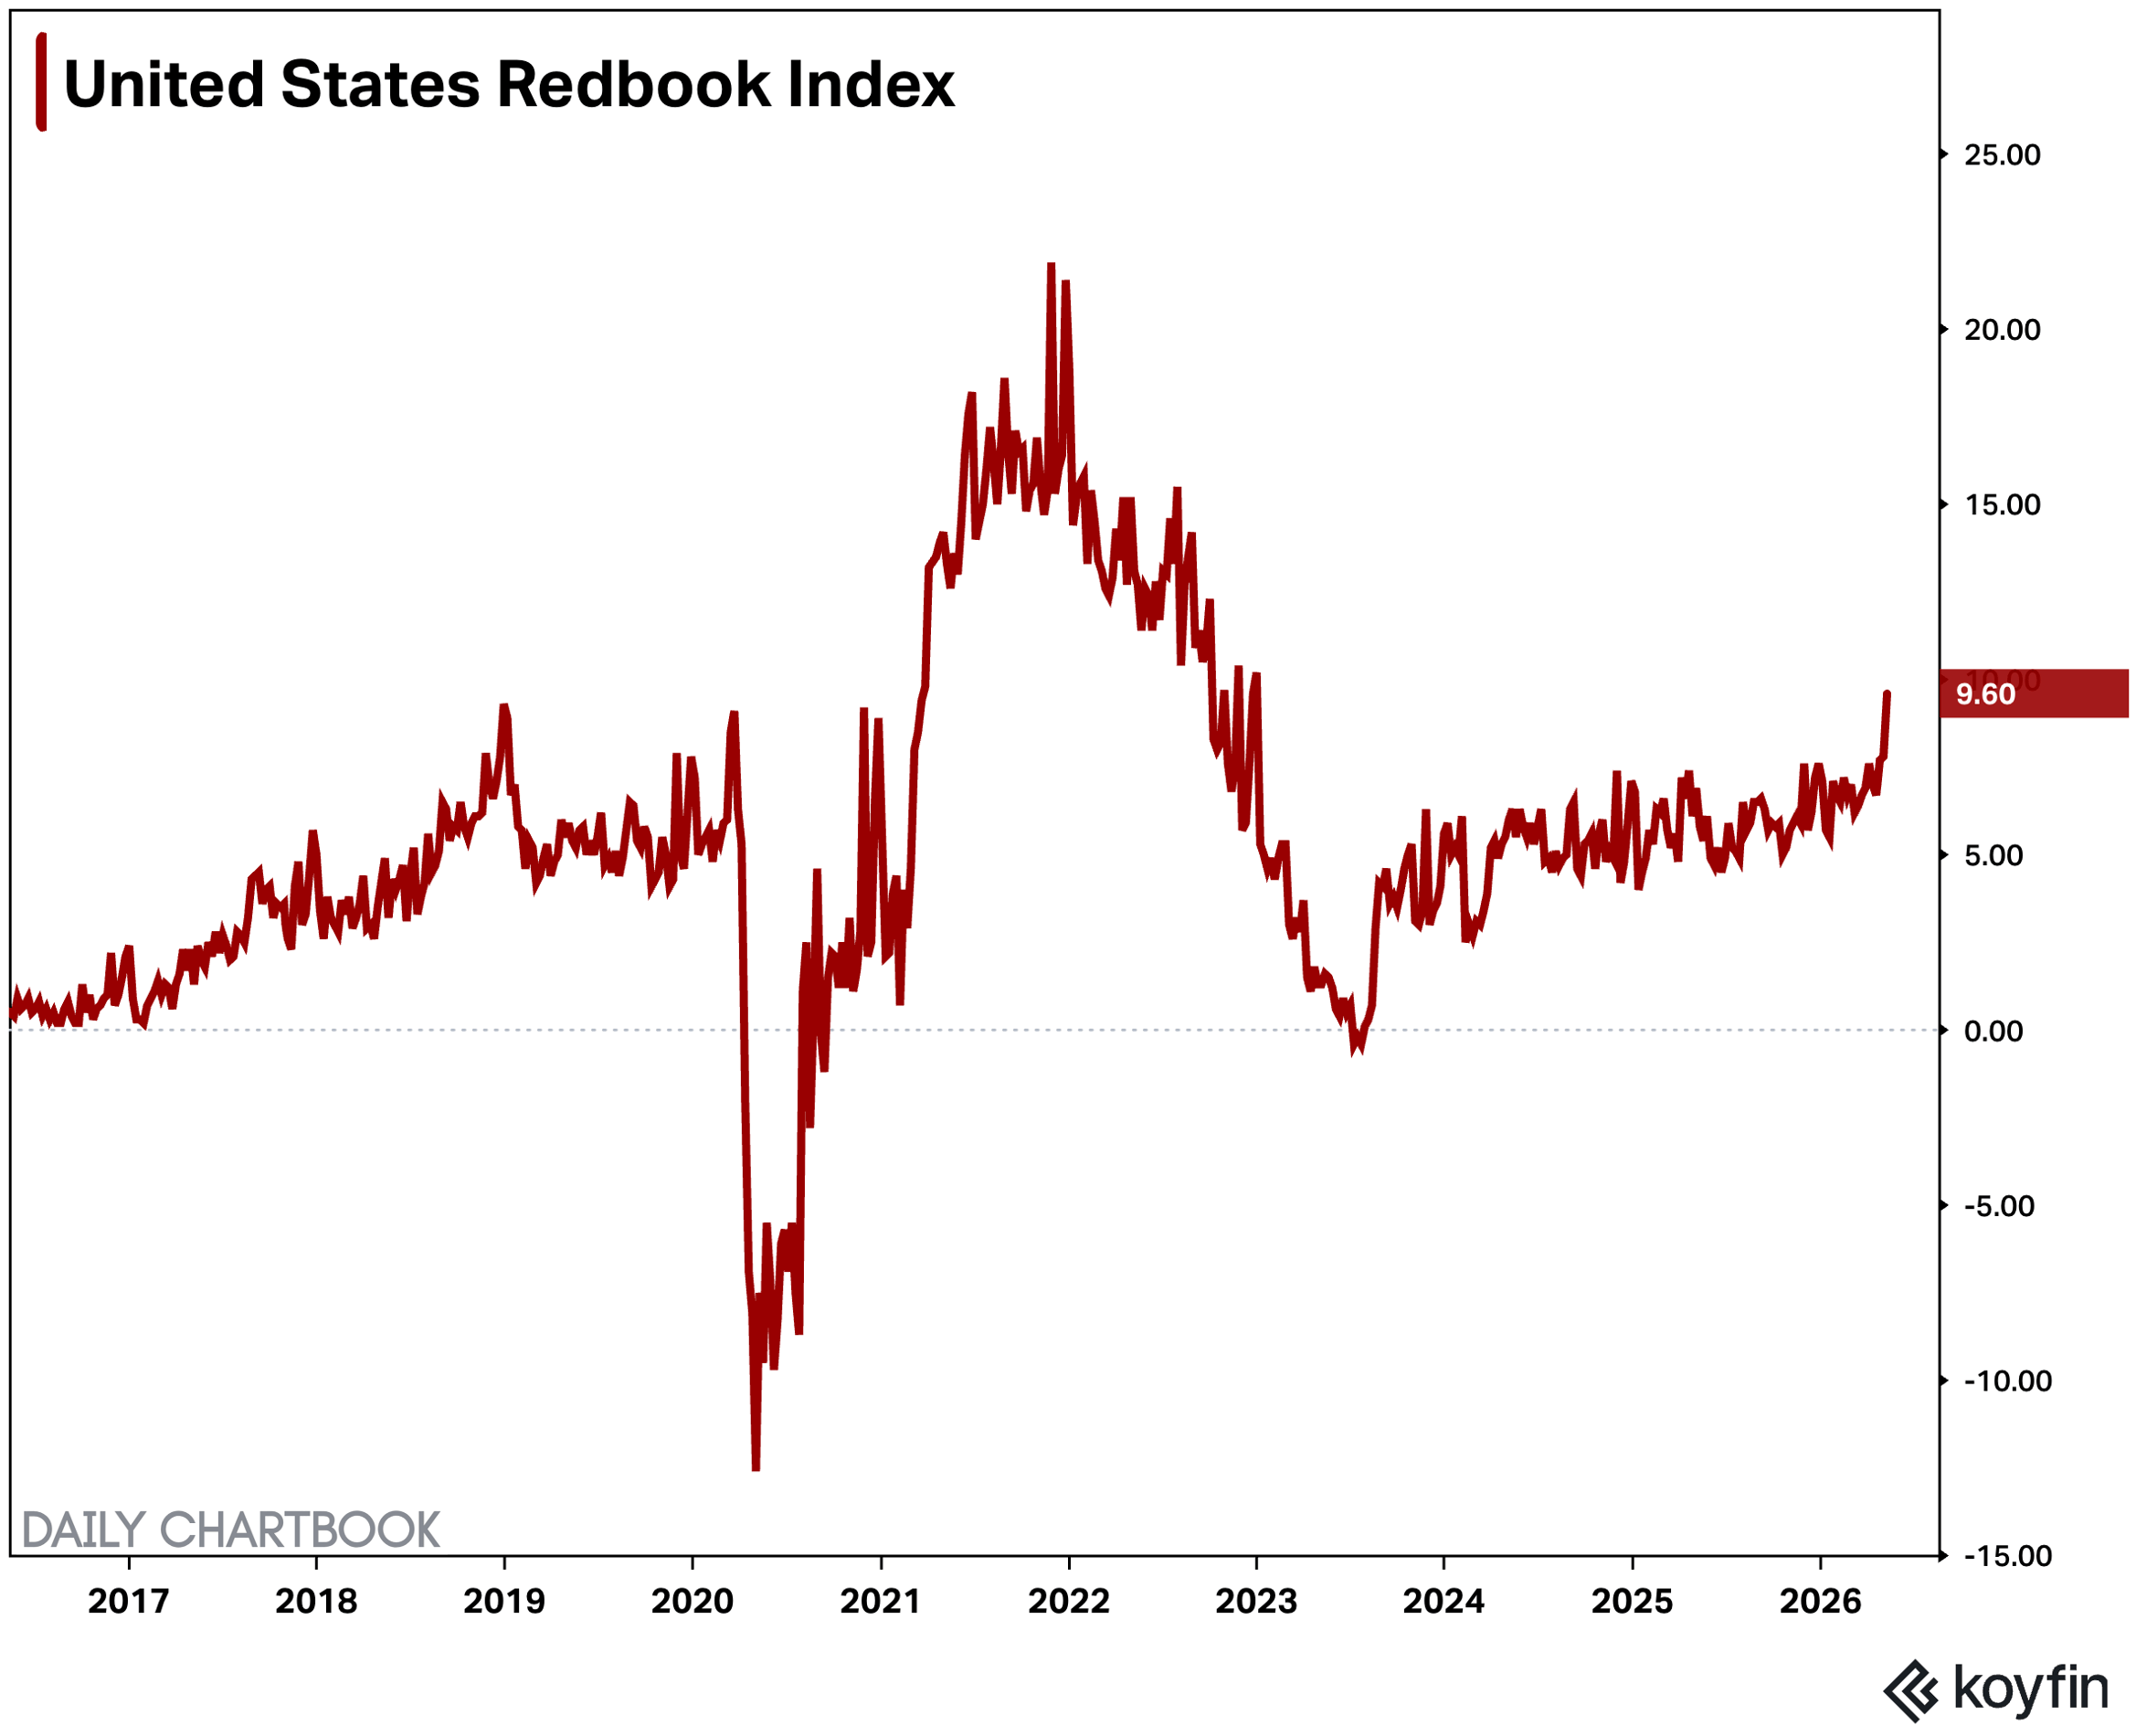
2.Redbook Index. Same-store retail sales jumped 9.6% YoY for the week ending May 9 (7.8% prev).
RECORD LOW, you say…?
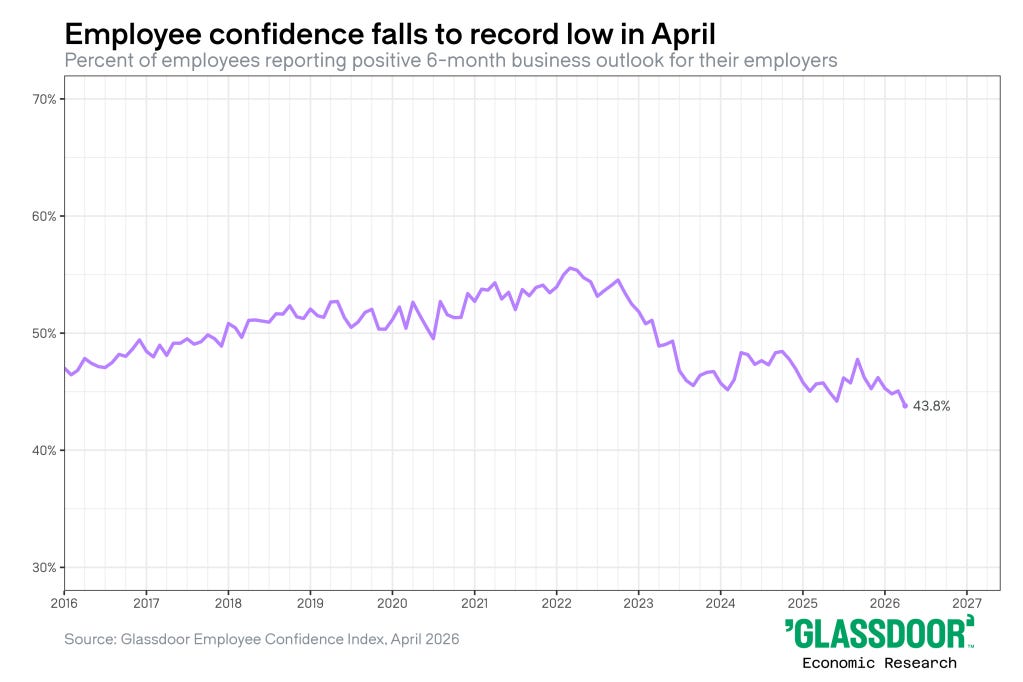
May 12, 2026 GlassdoorEmployee Confidence Index: A new record low
Employee confidence plummeted in April, reaching a new record low, according to the latest data from the Glassdoor Employee Confidence Index. The share of employees reporting a positive 6-month business outlook crashed to 43.8% in April 2026. The decline follows a significant downward revision to March 2026 from 47.1% to 45.1% with the complete month’s worth of data in. The U.S.-Iran war and subsequent increase in energy prices appears to be pulling down employee confidence, even if it took several weeks to take hold in workers’ psyches.
… Finally, thinkin ‘bout a haircut this weekend to show off my new tattoo …


Excellent blog ..