while WE slept: USTs soft, GILTS underperforming; sticky CPI recaps and victory laps and a message (from gold) and a key chart (on tariff impacts)
Good morning … 2s HELD vs 4.25% (YEST) and yields are UP since CPI and say whatever you want about it — proves disinflation or INflation — I don’t care what narrative you stand behind. Sorry. I only am taking signals from the market and they seem pretty clearly nervous and NOT buying the current rate CUT in DECEMBER idea (more on those chances INCREASING a bit after the data, in a min) …
That said, prices are perhaps nearing a(nother)inflection point & 10s MAY be rentable…
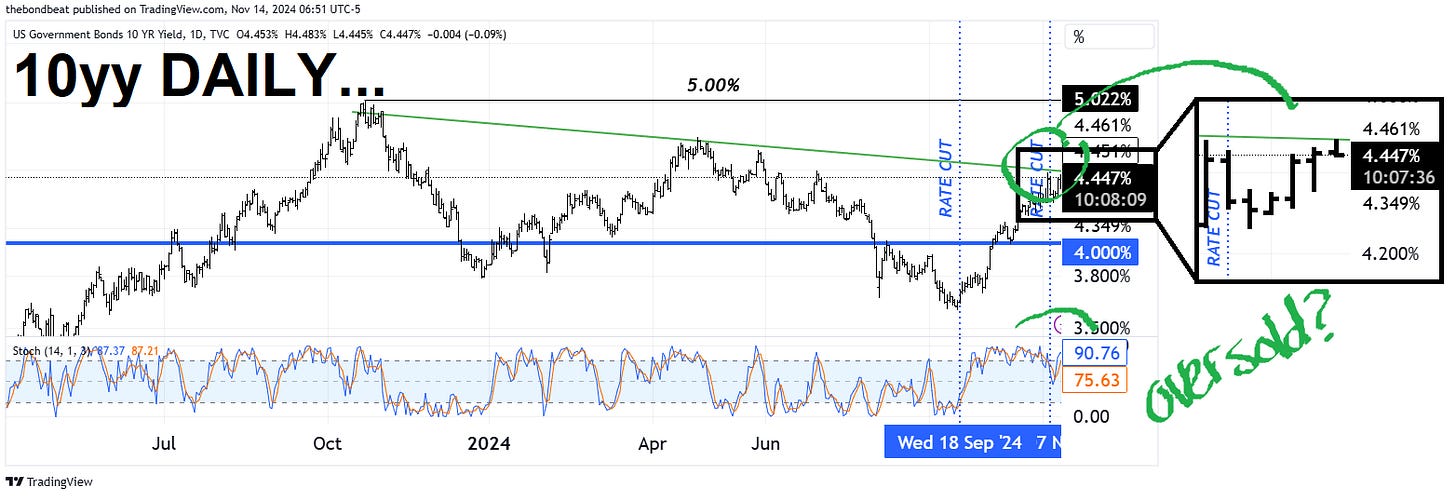
10yy DAILY: TLINE support is near … in fact, 10s touched it earlier this morning, just beneath psychologically important 4.50% …
… and momentum is becoming overSOLD
… and SO now we KNOW … as CPI has now become a known known, so too has the fate of the December FOMC meeting … as we also know the Fed makes up it’s mind and hangs its hat on a single point of data … A few links where this first one details / SPINS it good … Progress STALLED …
Bloomberg: US Inflation Keeps Steady as Fed Looks to Avoid Reversal
US inflation remained firm in October rather than continuing its irregular descent, giving the Federal Reserve less room to maneuver in completing any soft landing. The so-called core consumer price index—which excludes food and energy costs—increased 0.3% for a third month. Over the last three months it rose at a 3.6% annualized rate, marking the fastest pace since April, according to Bloomberg calculations.
Regionally, however, the picture can vary…
… in a less good light, then, there is this …
ZH: Core Consumer Prices Rise For 53rd Straight Month, Hit New Record High
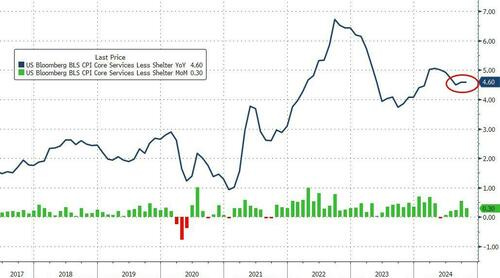
… Under the hood, the much-watched (for a while) SuperCore (Services Ex-Shelter) CPI remains stubbornly high...
Overall, headline consumer prices are up 20.4% since Biden/Harris took over (that is almost three times the pace of price inflation that was seen under Trump's first term)...
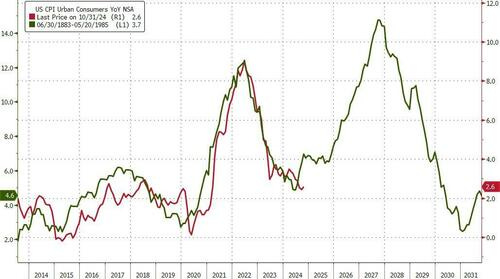
Finally, Could we really replay the '70s once again?
Will that really be Powell's legacy? Or will the timing of this resurgence in inflation be perfectly timed to coincide with Trump's election victory... and offer a perfect patsy for who is to blame?
… right. Good question…somewhat MORE (or less) ‘bout CPI below from Global Wall and the WWW … but for now, we see what happened just after the data
at MattCerminaro
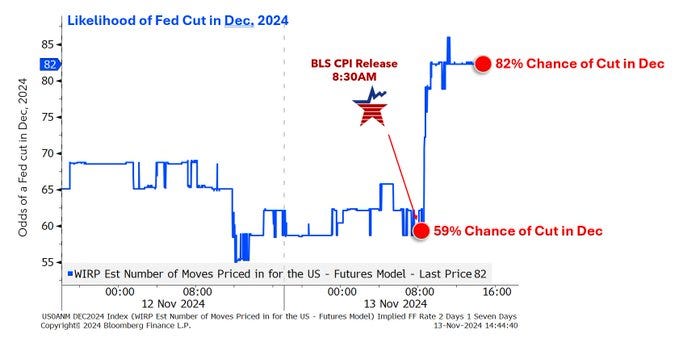
Inflation print may have come in at consensus this AM. But the odds of a cut in Dec, 2024 spiked. - From 59% pre-release - To 82% post release Means market took it as dovish
… and I’m done here … moving on TO a snapshot OF USTs as of 655a:
… and for some MORE of the news you might be able to use…
IGMs Press Picks: November 14 2024
NEWSQUAWK: European equities higher, ASML +5.6% after confirming 2030 outlook, DXY topped 107 ahead of Powell … Bonds are subdued with slight underperformance in Gilts ahead of Fed Chair Powell and BoE Governor Bailey … A slightly softer start to the session with USTs at a fresh 109-06 contract low. Yields bid across the curve with the belly leading and a very slight flattening bias overall. Docket ahead has PPI and IJC, which could spur reactions given the relevance for PCE and insight into the labour-side of the Fed’s mandate respectively. Thereafter, markets will await Fed Chair Powell and then Williams.
Opening Bell Daily: Americans rack up debt … Everyday Americans are missing payments and racking up debt … Delinquency rates are inching higher and loan balances won't stop climbing, Fed data shows.
Reuters Morning Bid: A twist in the U.S.'s inflation tale?
Finviz (for everything else I might have overlooked …)
Moving from some of the news to some of THE VIEWS you might be able to use… here’s SOME of what Global Wall St is sayin’ … mostly as it relates TO CPI …
BAML: October CPI Inflation: An in-line report
Par for the course
October CPI was broadly in line with consensus expectations. Headline CPI rose by 0.2% m/m (0.24% unrounded) as energy prices only fell modestly. As a result, the y/y rate rose from 2.4% to 2.6%. Core CPI, meanwhile, rose by 0.3% m/m (0.28% unrounded, 2bps above our expectations), which left the y/y rate unchanged at 3.3%. That said, much of the firmness can be attributed to two categories air fares and used cars. Overall, inflation shows little signs of reaccelerating, but disinflationary progress has slowed……25bp cut in December remains our base case
This is a business-as-usual print for the Fed. Inflation is moving sideways on a y/y basis, but there is nothing in today's report that would alarm the Fed. A lot of the firmness in the October CPI was in components that i) are idiosyncratic (used cars), ii) do not read through into the PCE (airfares) and iii) Powell is looking through (OER). Therefore, a 25bp cut in December firmly remains our base case.BARCAP: October CPI: Another 0.3% core
Core CPI increased 0.28% m/m (3.3% y/y), only 3bp lower than in September, as core services inflation held steady and core goods inflation retreated despite the sharp run-up in used car prices. The weakness in core goods ex used cars benefits the core PCE translation, pegging it at 0.22% m/m, SA.
…Looking ahead to the November release, here are some preliminary thoughts. On the core goods side, we don't think used car prices will register an increase of this magnitude again, given wholesale prices (Manheim) appear to be softening. At the same time, we also do not expect a repeat of the sharp deflation in apparel prices. The details suggest the price move was largely an unwind of the unseasonal strength in women's apparel and jewelry in September. On the core services side, while we continue to expect further disinflation in medical care services, we think rent/OER CPI inflation could be poised for a strong print in November, given the cohort positioning (Figure 6).
We retain our call for a 25bp cut in the December FOMC meeting, but maintain that it could still be a close call given we will get one more payroll report and CPI report before the meeting. We think October core PCE at 0.2% m/m would likely give the FOMC some comfort that the disinflation narrative is intact. That said, the evolution of data since the September FOMC meeting has been strong on balance, with core PCE slated to end the year higher than the FOMC's median projection of 2.6% Q4/Q4 and the unemployment rate likely to end the year below their median projection of 4.4% in the September SEP. We maintain our forecast for core PCE to have increased 2.8% Q4/Q4 this year…
BNP: US October CPI: Well-behaved, outside of used vehicles
KEY MESSAGES
The details of the October CPI report were softer than the rounded 0.3% m/m core print, which was boosted by a 6bp contribution from used vehicle prices and flattered by rounding.
Rent of primary residence inflation and non-shelter services inflation remained steady from last month, though owners’ equivalent rent ticked up, and warrants a close eye given lagging single-family home construction.
While we think current price trends remain disinflationary, the new administration’s policy proposals tilt inflation outlook risks to the upside.
DB: Early Morning Reid
… In terms of the details from the report, core CPI was at a monthly +0.28% in October (vs. +0.3% expected), so markets were relieved we didn’t get the +0.4% print some had feared. That said, it wasn’t all good news, as that’s the third consecutive reading which rounds to +0.3%. So the 3-month annualised rate of core CPI now stands at +3.6%, up from just +1.6% three months ago, when it felt like inflationary pressures were a lot more tame and the Fed were pivoting towards their 50bp rate cut in September. In the meantime, headline CPI was also broadly as expected at +0.24% (vs. +0.2% expected), but it wasn’t far from rounding up to +0.3% as well, and it was also the fastest headline CPI print since April. In turn, that pushed the 3m annualised rate up to +2.5%, whilst the year-on-year rate ticked up to +2.6%, ending a run of six consecutive monthly declines in the annual rate.
Nevertheless it could have been worse and investors dialled up the chance of the Fed cutting rates again at the December meeting, with futures now giving that an 82% probability. That was down to 59% just before the release, so there was a meaningful rise intraday. In turn, that led to a decent rally in front-end Treasuries, with the 2yr yield down -5.4bps on the day to 4.29%. However, 10yr yields rose +2.3bps to 4.45%, their highest since the start of July, and rising nearly 10bps from their intra-day low in the hour or so after the CPI release. And 30yr yields (+6.8bps) rose to their highest since May, with the 2s30s slope seeing its sharpest steepening YTD. There wasn’t a single clear driver for the long-end sell-off with strong corporate issuance so far this week potentially playing a role, while the “Trump trade” factor again appeared to dominate. Overnight, 2yr (+2.8bps) and 10yr USTs (+2.0bps) are trading at 4.313% and 4.471%, respectively, as we go to print …
RBC: U.S. October CPI data shouldn't prevent a December Fed cut
The Bottom Line:
The October CPI data was broadly as-expected and shouldn't prevent another cut in interest rates from the Federal Reserve in December.
Inflation has still slowed from where it was earlier this year, and (gradually) softening labour markets argue interest rates are higher than they need to be to get price growth fully and sustainably back to the Fed's 2% objective even with a resilient U.S. economy and the inflationary impact of a large government budget deficit.
The Federal reserve is still highly data dependent and will see another month of inflation and labour market data before the next policy decision in December. Our own base-case projections expect 25 basis point rate cuts to the fed funds range in December and January, and then a pause for the rest of 2025 at a 4% to 4.25% range.
UBS: Disinflation beneath inflation
US October producer price inflation is due. These numbers better reflect corporate pricing power than does the consumer price data. The tone should be consistent with a December rate cut—in this situation, the Federal Reserve does not want rising real rates, and inaction would raise real rates over the course of this year.
Yesterday’s US consumer price inflation data remains in thrall to the fantasy owners’ equivalent rent (at over a quarter of the index and rising over 5% a year, this is a price no one has ever actually paid). Middle-income homeowners’ true cost of living inflation has been below 2% y/y for six months. Egg-price inflation is more Fabergé than dairy, but this is a relative price anomaly, not underlying inflation pressure…
Wells Fargo: October CPI: Sticky as Expected
Summary
The October CPI report held few surprises but highlighted that progress on inflation has started to stall. Consumer prices rose 0.2% last month, pushing the year-over-year change up to 2.6%. Excluding food and energy, inflation also has proved sticky in recent months. The core CPI rose 0.3% for a third straight month, with the three-month annualized rate of 3.6% running faster than the 12-month rate of 3.3%. Outside of autos, core goods prices fell, but the moderation in core services inflation remains painfully slow.We believe the FOMC is still on track to reduce the federal funds rate by another 25 bps at its December 17-18 meeting. The cumulative progress on inflation, cooling of the labor market and still-tight monetary policy likely will push the FOMC to cut rates one more time before the end of the year. That said, the inflation data over the past few months have not shown much additional progress, and the election outcome has raised new questions about the path ahead for price growth. In addition, recession risks seem to have diminished somewhat relative to the summer months. As a result, we think the time is fast approaching when the FOMC will signal that the pace of rate cuts will slow further, perhaps to an every-other-meeting pace starting in 2025.
Yardeni: Sticky Landing For Inflation?
Today's CPI report suggests that inflation may be getting stuck north of the Fed's 2.0% target. The headline and core CPI inflation rates rose 2.6% and 3.3% y/y during October. Goods prices are still deflating. But supercore inflation, rent inflation, and wage growth all rose last month suggesting they are getting sticky at relatively high rates. This along with strong economic growth confirms our view that the Fed has eased too much too soon. Our view is confirmed by rising bond yields, which are challenging the wisdom of the Fed's rate cutting.
We're not worried about a second wave of inflation because we believe that productivity is already boosting real GDP, while keeping a lid on unit labor costs inflation. Recent upward revisions in productivity confirm this view. However, we think that the Fed needs to give consumer price inflation more time to get unstuck before even considering whether any more rate cuts are necessary…
… and couple / few more things NOT CPI related …
DB: A message
Gold has confounded expectations and is dropping sharply following the US election. Why? We see three messages from the gold price:
1. This market is NOT worried about US credit risk..
2. Demand for gold reserves from central banks is going down…
3. The USD remains the pre-eminent safe-haven currency of choice…
DB: The key chart
Below is the chart we find best summarizes the global impact of US trade policy. We show which countries would be most impacted by US tariffs by doing three things. First, we calculate how much tariffs on a country's exports would rise based on a minimum universal tariff combined with a reciprocal matching US tariff. This means that if a country has high tariffs for inbound imports from America, the US would match those duties. Second, we scale the tariff increase by the share of US exports in a country's export basket. So the bigger trade with the US is for a country, the bigger the impact. Finally, we scale this by the size of that country's export basket as a share of GDP. So the more open an economy and the bigger the reliance on the US, the bigger the impact. The chart demonstrates what should by now be a familiar conclusion - Mexico and Vietnam are the most vulnerable countries in EM, while Canada and Europe are in DM.
There is one key caveat, however: our analysis does not include the risk of countervailing "antidumping" tariffs by other countries. For example, it would be highly likely that the Eurozone applied countervailing tariffs to Chinese goods in the event of a US "tariff wall" on Chinese imports. This would make the impact of a trade war on China much bigger than implied by the below analysis…
HSBC: Fixed Income Asset Allocation
Floor plans
We shift our end-2025 10-year US Treasury forecast to 3.5% (from 3.0%) reflecting uncertainty over the floor
For Bunds and UK gilts our end-2025 forecasts are 1.90% (from 1.50%) and 3.25% (from 3.0%) respectively
Our conviction for EM local rates is moved down to neutral given high US real rates
US Treasuries – playing with the floor
What if the Fed’s response to the incoming US administration’s policies was rate hikes in 2025 and a longer-run equilibrium of 4%, more than 100bp higher than Fed guidance for end-2026 and longer-run? We play with the floor in a scenario that implies much higher short-dated yields, contributing to resistance for a steeper curve. Meanwhile, the reversal of the summer rally looks overdone, so we keep the nearterm conviction at bullish, reflecting relative value versus the rest of the world.… It is notable that while the overall yield curve has shifted higher in recent weeks, meaningful cheapening on a relative basis has been seen in the intermediate tenors – for example in the 5Y versus the 2Y and 10Y, as Figure 7 below shows. This may seem counterintuitive at first. History shows the five-year tends to underperform (an upwards spike in the red series) when the Treasury rapidly cuts rates – such as during the Global Financial Crisis (GFC) and dot-com crisis. The recent shift in expectations, however, has been towards a shallower easing cycle.
If higher yields are explained by fears of the president elect’s policies, leading to a more hawkish Fed, this suggests upward pressure on front-end yields. Concerns over expansionary fiscal policy and the duration supply required as a result would typically be associated with term premium being demanded at the long end. We think there are different drivers explaining yield shifts in different parts of the curve, hawkish Fed at the front-end and term premium further out.
We think there are two reasons for the five-year segment’s relative cheapening on the curve.
First, from a positioning perspective, the 5Y tenor tends to be the preferred habitat of buyers such as banks who are hedging out their liabilities – as well as investors seeking directional duration exposure to rates without the term premium risk of longer maturities. Following five consecutive months of lower yields, we think it is plausible that the broad-based repricing may have been exacerbated by positioning at this tenor.
Secondly, relative cheapening at the 5Y segment could be seen as reflecting market repricing of the longer-run equilibrium – the anchor level for the future path of the policy rate…
… And from Global Wall Street inbox TO the WWW …
First up, it’s crazy-eyes …
Bloomberg: Fed Officials Fret Over How Far They Can Lower Interest Rates
Elevated uncertainty causing officials to urge caution on cuts
Policymakers still showing confidence over inflation path
… THEN there’s a political (OpED) view of ‘flation (and a good visual of REALZ …)
Bloomberg: Inflation needs subtlety right now. It's getting Trump
What had been a steady decline is definitely stuck, and it’s feeding through into higher expectations for interest rates next year.…Definitional issues now grow more complicated, as Jerome Powell argued last year that the real rate should be defined as the fed funds rate minus the one-year inflation breakeven. This produces a much more volatile figure, and at the time it was considerably higher than the TIPS yield, so it was seen as the beginning of an argument that the Fed could afford to cut. Another popular real rate just subtracts core CPI from the fed funds rate.
Those three measures are illustrated below. Adding the extra definitions shows 1) that it really was mad to leave rates so low for so long after the pandemic, and 2) that we can now agree that the real rate is a high but not extreme 2% (ish):
Then there’s the possibility of big changes in macroeconomic policy once Donald Trump takes office…
… AND something not directly CPI related (at least not yet, anyways) …
LPL: Are Tariffs Always Inflationary?
Key Talking Points
Reported this morning, October inflation rose 0.2% from a month ago, the same monthly pace as July, August, and September as inflation is finding its balance.
Despite the fairly steady monthly pace of inflation, the annual rate rose to 2.6% and is attributed to abnormal and large declines in gas prices back in October 2023. It does not appear to be signaling a new trend but rather base effects.
The sticky components of inflation continue to ease, giving the Fed some leeway to cut rates next month, but they could pause in January. The strength of some cohorts of the consumer is keeping upward pressure on prices and stronger-than-expected economic growth is likely keeping bond yields elevated.
But most importantly, markets seem preoccupied with the inflationary impact from rogue tariffs. From lessons learned during the 2018 tariffs, consumer prices may not reflect the full cost of a tariff, although somebody must bear the burden.
…In this blog, we notice that tariffs imposed in early 2018 impacted producer prices more than consumer prices as wholesalers did not fully pass along the cost of importing
Wholesalers Didn't Fully Pass Along Tariffs of 2018–2019
Summary
In general, a tax from tariffs, or any other policy, creates a deadweight loss to the economy. Businesses and consumers feel the impact; employment typically shrinks, and our foreign trading partners often retaliate. Among the possible positive impacts from these types of trade actions are negotiating opportunities, shifts toward more domestic production, and maybe some humanitarian improvements as well. Maybe trade threats could punish foreign businesses who exploit their workers with inhumane working conditions. We could hope the world becomes a safer and fairer place, even for workers in other parts of the globe.As it relates to the investment outlook, markets are right to have caution as we enter 2025. There are economic headwinds, but so far, a stable consumer, looser Fed policy, and businesses planning to ramp up capital expenditures may keep supporting this market. Caveat emptor.
… CPI …
FirstTrust: The Consumer Price Index (CPI) Rose 0.2% in October
The Consumer Price Index (CPI) rose 0.2% in October, matching consensus expectations. The CPI is up 2.6% from a year ago.
Food prices rose 0.2% in October, while energy prices were unchanged. The “core” CPI, which excludes food and energy, rose 0.3% in October, also matching consensus expectations. Core prices are up 3.3% versus a year ago.
Real average hourly earnings – the cash earnings of all workers, adjusted for inflation – rose 0.1% in October and are up 1.4% in the past year. Real average weekly earnings are also up 1.4% in the past year.
… a subset category of prices the Fed used to tell investors to watch closely but no longer seems to mention – known as the “Supercore” – which excludes food, energy, other goods, and housing rents, rose 0.3% in October and are up 4.4% in the last year, worse than the 3.7% reading in the year ending in October 2023. No matter which way you cut it, inflation is still running above the Fed’s 2.0% target, now for the 44th consecutive month. We have said for some time that easing in inflation will come should the Fed have the resolve to let the lagged effects of tighter monetary policy do its work. But the Fed has now cut rates a total of 75bps since September. And yet the embers of inflation continue burning. Since we have yet to see a significant or prolonged slowdown in growth, much less a recession, it remains to be seen whether inflation will reach 2.0% or less on a consistent basis. This month’s report did no favors proving that.
Inflation Guy’s CPI Summary (October 2024)
…The Fed’s actions can clearly affect that eventual equilibrium level, but it doesn’t look like they are yet taking this seriously. The game isn’t over and there will be more CPI reports and more after that. But for now, this looks like a policy error – or worse, a blatant attempt to influence the election – and unless something unexpected happens with prices it looks like the Fed is going to have to choose between the right policy move (which means continuing tight policy) that appears to be political, or continuing to loosen policy so as to not appear to be political, and temporarily surrendering on inflation. I suspect that the FOMC will vote to keep rates steady at the next meeting.
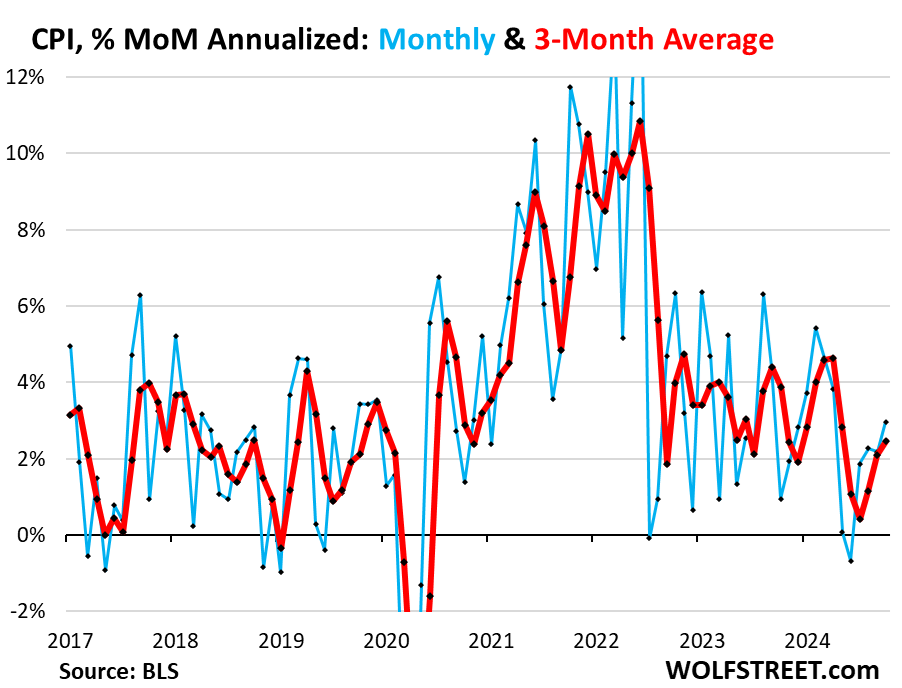
WolfST: Beneath the Skin of CPI Inflation: Overall CPI Accelerates for 4th Month, “Core” CPI for 3rd Month on Re-spiking Used Vehicle Prices & Homeowner Cost
Year-over-year, CPI and “core” CPI are starting to show the effects of the month-to-month increases since the “inflation is vanquished” summer.
…The overall CPI is still held down by the plunge in gasoline prices. But it accelerated to +3.0% annualized in October from September (+0.24% not annualized), the fastest increase since March, despite the drop in gasoline prices, and the fourth month in a row of acceleration.
The three month-average accelerated to +2.5%, also the third month in a row of acceleration.
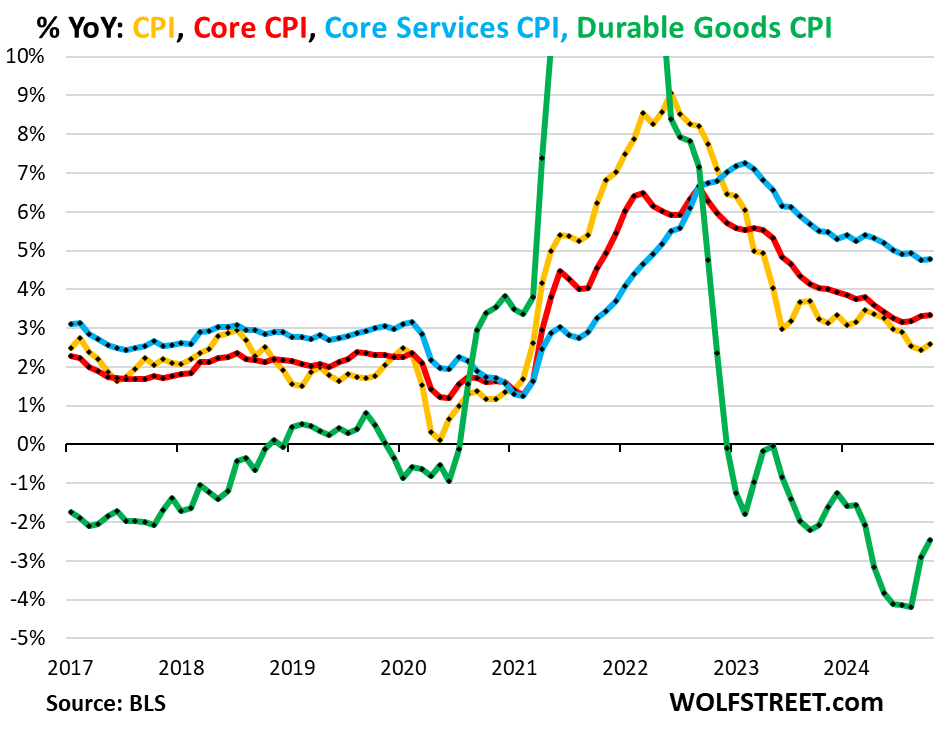
Year-over-year, CPI and core CPI accelerated:
Overall CPI, despite the plunge in gasoline prices, accelerated to +2.6% (yellow).
Core CPI accelerated slightly for the third month in a row to +3.3% (red in the chart below).
Core Services CPI rose by +4.8%, same as in the prior month (blue).
Durable goods CPI, which has been in deflation on a year-over-year basis since late 2022, became less negative, at -2.5% (from -2.9% in the prior month).
… THAT is all for now. Off to the day job…








Different take on Gold, fear trade unwind-look at Bitcon/Bitcoin, guess digimoney wasn't feeling Komila's 'joy', and seasonal weakness. Rumor is Chinese get goldbug busy in their New Yrs. Could be yrs/decades before gold breaches $3,000 though. If not Look Out!